GBPUSD Q3 | D25 | W30 | Y25 FUN COUPON FRIDAYGBPUSD Q3 | D25 | W30 | Y25
Daily Forecast🔍📅
Here’s a short diagnosis of the current chart setup 🧠📈
Higher time frame order blocks have been identified — these are our patient points of interest 🎯🧭.
It’s crucial to wait for a confirmed break of structure 🧱✅ before forming a directional bias.
This keeps us disciplined and aligned with what price action is truly telling us.
📈 Risk Management Protocols
🔑 Core principles:
Max 1% risk per trade
Only execute at pre-identified levels
Use alerts, not emotion
Stick to your RR plan — minimum 1:2
🧠 You’re not paid for how many trades you take, you’re paid for how well you manage risk.
🧠 Weekly FRGNT Insight
"Trade what the market gives, not what your ego wants."
Stay mechanical. Stay focused. Let the probabilities work.
FRGNT
FX:GBPUSD
Trend Analysis

BTC / USDT : Broke down and now going for retestBitcoin Analysis:
Bitcoin has broken down and is now retesting the support zone. As mentioned earlier, a shakeout can happen at any time, and this looks like the potential retest phase.
Bullish Scenario:
Reclaims Resistance: If BTC manages to break through the resistance after the retest, it will stabilize for the short term. This could lead to a move towards higher levels.
Bearish Scenario:
Failure to Break Resistance: If the retest fails and BTC can't reclaim the resistance, further downside could be expected.
Targets: Keep an eye on the CME gap at $114,000 and 92K as key levels to watch for potential price action.
Note:
Manage your risk carefully. The market is volatile, and a shakeout could happen anytime. If BTC fails to break resistance after retest, more pain may be ahead.

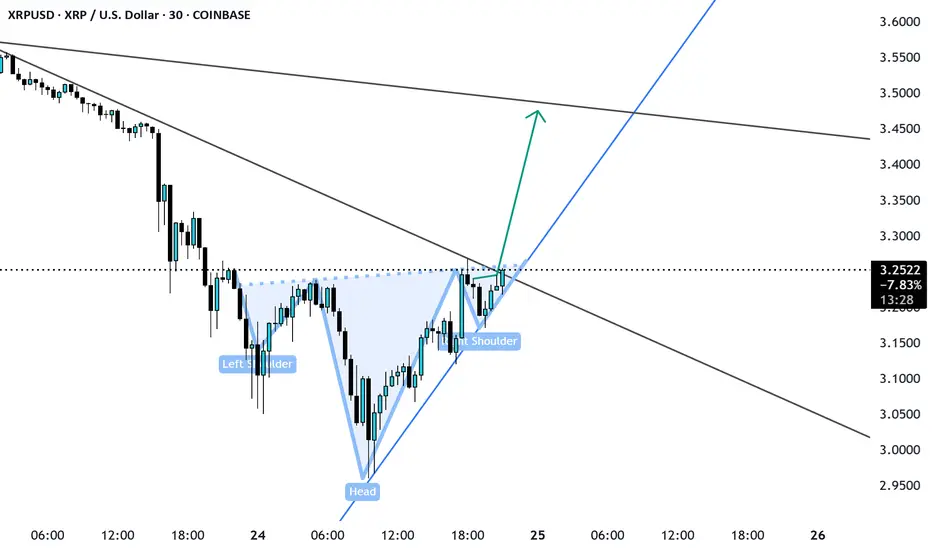
XRP SHS pattern Enter on Neckline breakout XRP pulled back from the support of 3.0 currently formed a head and shoulder pattern is likely to grow till 3.4 -3.45. let us see.
Elliott Wave Analysis – XAUUSD July 25, 2025📊
________________________________________
🔍 Momentum Analysis
• D1 Timeframe: Momentum is declining. Based on the current pace, it’s likely that only 1–2 more daily candles are needed before momentum enters the oversold zone → suggesting one more potential downward leg.
• H4 Timeframe: Momentum is about to turn bearish, indicating we might see a sideways movement or a slight drop in the short term.
• H1 Timeframe: Momentum is currently falling. By the end of the current H1 candle, momentum will likely enter the oversold zone → potential for a bullish reversal soon.
________________________________________
🌀 Elliott Wave Structure
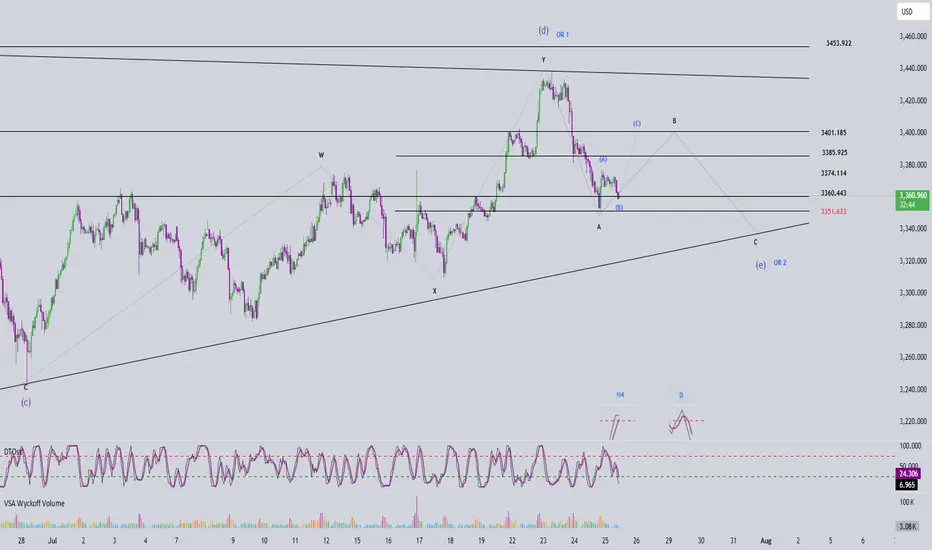
• A clear 5-wave Wave A has already formed with no irregular patterns, so I’m expecting Wave B (black) to unfold as a 3-wave structure.
• Within this black Wave B, price is now developing Wave B (blue), meaning Wave A (blue) has already completed. Looking at the lower timeframe, I can identify a 5-wave structure → suggesting a zigzag correction in the form of 5-3-5 for black Wave B.
• Target for Wave B (blue): The 3360 area – this is a support level and also aligns with Fibonacci confluence, making it a strong candidate for the end of Wave B (blue) and a potential reversal zone.
• If price respects the 3360 level, then projected targets for Wave C (blue) would be around 3386 or 3402.
• However, if price breaks below 3351, the current wave count becomes invalid. In that case, we will shift to an alternate scenario and look for a buy opportunity near the lower edge of the triangle (c)-(e) and other confluence support zones.
________________________________________
🔄 Combining Momentum & Wave Structure
• D1 momentum shows weakening in this downward move, and the lower boundary of the triangle (c)-(e) is a prime area to look for the end of Wave e.
• Ideally, we want to see:
o A short-term bounce upward aligning with H1 momentum reversal to complete Wave C (blue).
o Then a confluence with H4 momentum turning bearish, indicating possible trend continuation or reversal.
________________________________________
📌 Trade Plan
• For experienced traders:
Watch closely around 3385 and 3401 for reversal signals to enter Sell positions.
• For beginners, I recommend the following limit setup:
o SELL ZONE: 3399 – 3402
o SL: 3501
o TP1: 3374
o TP2: 3351
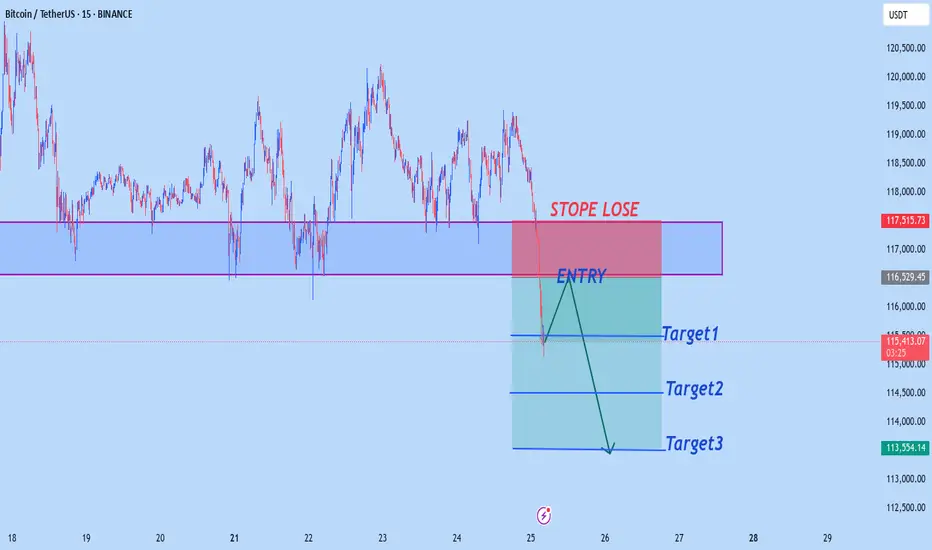
BTCUSD M15 OUTLOOKBtcusd sell from 116,500
target1 115,500
target2 114,500
target3 113,500
Stope Lose 117,500
Trade at your own risk
XAUUSD NEW OUTLOOKXauusd buy from 3360
Tp1 3370
Tp2 3380
Tp3 3390
Stope Lose 3350
TRADE AT YOUR OWN RISK

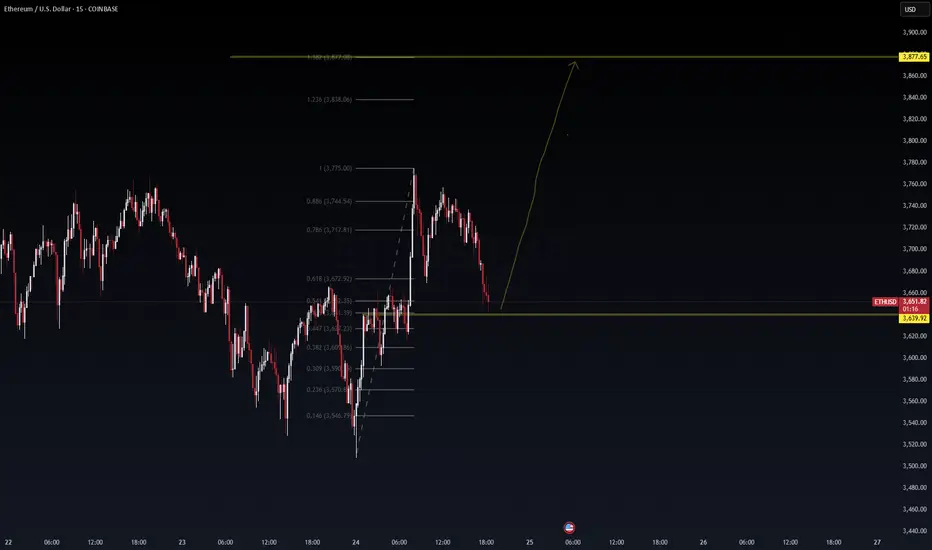
ETHUSD – Long Setup Activated | VolanX Protocol AlertEthereum (ETHUSD) is displaying strong bullish intent after reclaiming the VolanX Alert Line (~$3,659). Price action is forming higher lows with BOS (Break of Structure) signals, indicating that smart money is accumulating before a potential continuation rally toward the premium zones.
Key Levels & Zones:
Entry Zone: $3,660 – $3,680 (retest of equilibrium/alert line)
Target 1: $3,767 (weak high zone)
Target 2: $3,875 (premium zone)
Target 3: $4,000+ (extended bullish target)
Invalidation: Close below $3,620 (discount zone breach)
Rationale:
CHoCH → BOS → Retest Pattern: Multiple change-of-character moves followed by a BOS above $3,705 signal bullish market structure.
Liquidity Hunt Completed: Price swept the $3,540 discount zone and rebounded sharply, confirming smart money entry.
OPEX Volatility Catalyst: With options expiration tomorrow, volatility could drive ETH toward key liquidity zones. Favoring long bias as buy-side liquidity builds above $3,750.
Volume Surge: Breakout volume on 15m and 1H charts suggests institutional participation.
Trade Plan:
Long Entry: On a successful retest of $3,660–$3,680 zone with strong bullish candle confirmation.
Stop-Loss: Below $3,620 (structure invalidation).
Targets: Scale out at 3,767 → 3,875 → trail above $3,900.
Risk-Reward: ~1:3 or better, depending on execution and trailing strategy.
Disclaimer:
This analysis is for educational purposes only and not financial advice. Trade responsibly and use proper risk management.
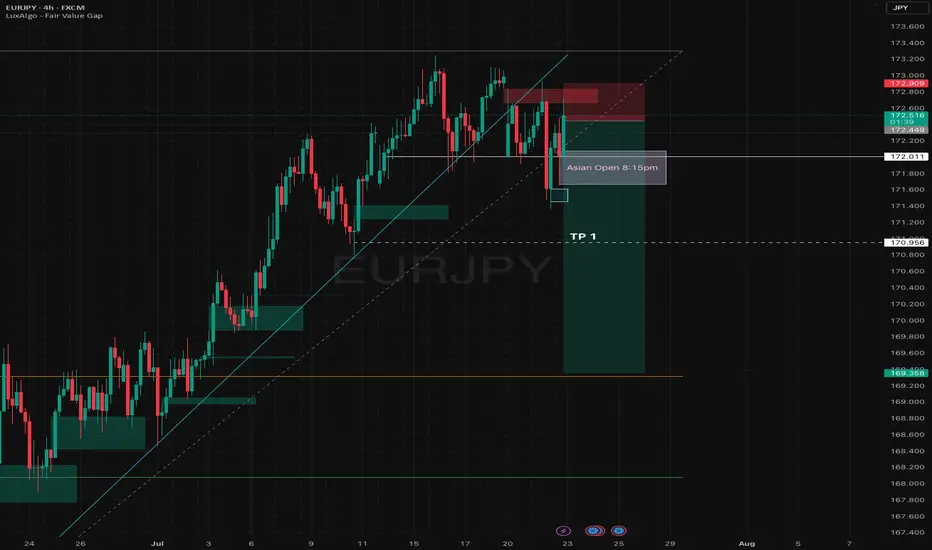
My outlook on EJJust my outlook so I can come back to this trade and see, I broke one rule here, so lets see if it plays out
Rule broken, didnt wait for Trend confirmation from London
EURUSD pullbackYesterday, EURUSD attempted to continue its bullish move but was rejected at 1,1788.
Keep an eye on whether it has the strength for another push higher. If it fails again, a correction is more likely to follow.
The first support levels to watch are 1,1699 and 1,1644.
Next week, the FED’s interest rate decision is due.
That news will likely determine both the direction and timing for entry.

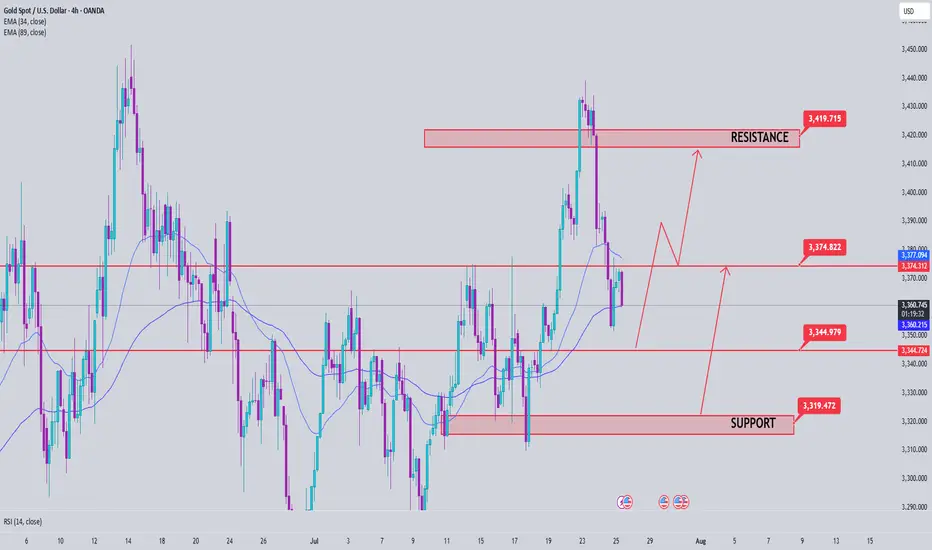
Gold price analysis July 25Gold Analysis – D1 Uptrend Still Maintains, But Needs New Momentum
Yesterday’s trading session recorded a D1 candle closing above the Breakout 3363 zone, indicating that buying power in the US session is still dominant. This implies that the uptrend is still being maintained, although the market may need a short-term technical correction.
In today’s Tokyo and London sessions, there is a possibility of liquidity sweeps to the support zone below before Gold recovers and increases again in the New York session.
Important to note:
The uptrend will only be broken if Gold closes below the 3345 zone on the D1 chart.
In this case, the 3320 level will be the next support zone to observe the price reaction and consider buying points.
For the bullish wave to continue expanding towards the historical peak (ATH) at 3500, the market needs stronger supporting factors, which can come from economic data or geopolitical developments.
📌 Support zone: 3345 – 3320
📌 Resistance zone: 3373 – 3418
🎯 Potential buy zone:
3345 (prioritize price reaction in this zone)
3320 (in case of breaking through 3345)
🎯 Target: 3417
Is the DOLLAR bullish? Look at the weekly support zone levelsI am trying to figure out what the recent bullish days mean within the overall range.
Please let me know what you think 🙏🏾

GBPUSD H4 Bullish Reversal Based on the H4 chart analysis, the price is approaching our buy entry level at 1.3404, a pullback support that aligns with the 50% Fib retracement.
Our take profit is set at 1.3555, a pullback resistance.
The stop loss is placed at 1.3404, a swing low support.
High Risk Investment Warning
Trading Forex/CFDs on margin carries a high level of risk and may not be suitable for all investors. Leverage can work against you.
Stratos Markets Limited (tradu.com ):
CFDs are complex instruments and come with a high risk of losing money rapidly due to leverage. 63% of retail investor accounts lose money when trading CFDs with this provider. You should consider whether you understand how CFDs work and whether you can afford to take the high risk of losing your money.
Stratos Europe Ltd (tradu.com ):
CFDs are complex instruments and come with a high risk of losing money rapidly due to leverage. 63% of retail investor accounts lose money when trading CFDs with this provider. You should consider whether you understand how CFDs work and whether you can afford to take the high risk of losing your money.
Stratos Global LLC (tradu.com ):
Losses can exceed deposits.
Please be advised that the information presented on TradingView is provided to Tradu (‘Company’, ‘we’) by a third-party provider (‘TFA Global Pte Ltd’). Please be reminded that you are solely responsible for the trading decisions on your account. There is a very high degree of risk involved in trading. Any information and/or content is intended entirely for research, educational and informational purposes only and does not constitute investment or consultation advice or investment strategy. The information is not tailored to the investment needs of any specific person and therefore does not involve a consideration of any of the investment objectives, financial situation or needs of any viewer that may receive it. Kindly also note that past performance is not a reliable indicator of future results. Actual results may differ materially from those anticipated in forward-looking or past performance statements. We assume no liability as to the accuracy or completeness of any of the information and/or content provided herein and the Company cannot be held responsible for any omission, mistake nor for any loss or damage including without limitation to any loss of profit which may arise from reliance on any information supplied by TFA Global Pte Ltd.
The speaker(s) is neither an employee, agent nor representative of Tradu and is therefore acting independently. The opinions given are their own, constitute general market commentary, and do not constitute the opinion or advice of Tradu or any form of personal or investment advice. Tradu neither endorses nor guarantees offerings of third-party speakers, nor is Tradu responsible for the content, veracity or opinions of third-party speakers, presenters or participants.

XAUUSD Locked In| Waiting for 5M OB SparkPair: XAUUSD (Gold)
Bias: Bullish
Timeframes: 30M / 5M
Gold has followed structure beautifully — top-down alignment from 30M into 5M is clear. Price respected the 30M OB and showed intent, but now we’re approaching the moment of truth.
I’m watching the 5M OB for entry — this is where execution mode activates. No rush. I’m in analysis mode right now, but the shift is coming.
Entry zone is mapped, structure’s in place, order flow is aligned — all I need now is price to do what it always does: respect the blueprint.
Entry Zone: 5M OB
Target: 5M highs
Mindset Note: Patience before the spark. I don’t force entries — I wait for the market to hand me the move it already hinted at. ⚡️

Gold Next Bullish Move.As we see the bullishness in Gold Market, so I am here to share with you the idea to capture the expected bullish move.
1) On Daily TF, market has taken out FVG as well as mitigated the OB.
2) On 4-Hour TF, market has taken out previously unmitigated FVG and sweeped and closed above the recent recent 4 Hour Candle low.
3) Market has given a CHoCH on 15 mins with a significant FVG, which I expect market to fill it.
So, with all above analysis I expect market to go bullish after filling FVG.
I hope to see your comments regarding my analysis and hope to see some of your ideas.
Thank You.

sp500 up to 6535sp500 with in my pov target to 6535 by a flag created maybe and with this super upside trend for these days

Gold fluctuated downward. Or it will continue.Gold was blocked near 3393 in the early trading on Thursday and began to fluctuate and fall, falling to 3351 as low as possible, then stopped falling and rose, and after rebounding near 3377, it was blocked and fell back to 3370 and fluctuated up and down, and the daily line closed with a negative line.
After three consecutive positive rises from last Friday to Tuesday this week, gold ushered in a turning point on Wednesday. On Thursday, it continued to fall and broke through the 5-day and 10-day moving averages, and the short-term market weakened. From the overall structure, the rising channel since June 26 remains valid. The highs on Tuesday and Wednesday approached the upper edge of the channel and then fell. The current price turned to fall and approached the lower edge of the channel.
There are two key positions for the support below: the first support level is near 3345, which is the lower edge support of the current rising channel; the second support level is near 3325, which is the trend line support formed by the connection of the previous low points.
From the 4-hour chart, the 3351 low point and the rebound resistance level can be used as a reference for today's long-short game. The breaking of key support and resistance will determine the trend direction of the next stage.
Operation strategy:
Short near 3375, stop loss 3385, profit range 3350-3330
Long near 3330, stop loss 3320, profit range 3350-3370

BITCOIN Indicates Consolidating Moves Before StronBitcoin (BTC) Market Analysis Report
Summary and Conclusion
Bitcoin (BTC) is currently trading around $117,000 to $118,000, showing a slight pullback from its recent all-time high near $123,000. The market sentiment is moderately bullish but cautious, with technical indicators signaling some overbought conditions and short-term consolidation. Institutional interest appears to be cooling off slightly, as evidenced by recent outflows from Bitcoin ETFs, while accumulation continues across various investor tiers, including whales and retail holders.
Key resistance is near $119,400-$120,000, and support lies around $117,200-$116,900. The market is in a "perfect accumulation" phase, with strong buying support despite some profit-taking. The Fear & Greed Index is at 70, indicating greed but not extreme euphoria.
Recent news highlights a mixed picture: Bitcoin remains dominant and stable, but altcoins are gaining some momentum. Institutional flows are shifting somewhat from Bitcoin to Ethereum and other altcoins. Experts predict potential for Bitcoin to reach $200,000 to $250,000 later this year, driven by macroeconomic factors like credit expansion and fiat inflation.
Detailed Analysis
1. Price and Market Data
Market Type Last Price (USD) 24h Change 24h High 24h Low 24h Volume (USD) Funding Rate (Contract)
Spot 116,959.8 -1.65% 119,498.4 116,946.6 1.43B N/A
Contract 116,962.7 -1.65% 119,492.9 116,935.5 8.91B 0.0001
Bitcoin is consolidating below $120,000 after reaching a peak of $123,218 on July 14.
Trading volume remains robust, indicating active market participation.
2. Technical Indicators
Bullish Signals: No strong bullish technical indicators currently detected.
Bearish Signals: RSI indicates overbought conditions, suggesting short-term caution.
Support and Resistance:
Resistance: ~$119,416.6
Support: ~$117,227.4
MACD and other momentum indicators show indecisiveness, implying possible sideways movement or minor corrections before the next major move.
3. Market Sentiment
Fear & Greed Index: 70 (Greed)
Investor sentiment is bullish but tempered by profit-taking and cautious positioning.
ETF flows show a recent reversal with $68 million outflows from Bitcoin ETFs, ending a 13-day inflow streak.
Ethereum and altcoins are attracting more inflows, signaling a rotation in institutional interest.
4. Recent News Highlights
Bitcoin remains dominant but has been mostly stagnant below $120K, while altcoins struggle for momentum.
Institutional investors are shifting some capital from Bitcoin to Ethereum and other altcoins.
Bitcoin is in a "perfect accumulation" phase, with all investor tiers building positions despite some whale transfers.
Experts like Arthur Hayes predict Bitcoin could reach $250,000 by year-end, driven by credit expansion and macroeconomic factors.
Network activity shows a slight dip in active addresses, indicating a short-term pause.
Support levels around $116,952 and $114,354 are critical to watch for downside risk.
Bitcoin's dominance remains strong at around 61%.
5. Outlook
Short-term: Bitcoin may continue to consolidate between $117,000 and $120,000, with potential minor pullbacks due to overbought RSI.
Medium to Long-term: Positive macro factors and accumulation trends suggest potential for new highs, possibly targeting $150,000 to $250,000.
Watch for a breakout above $120,000 to confirm bullish momentum continuation.
Monitor ETF flows and on-chain activity for signs of renewed institutional interest or caution.
Recommendations for Traders and Investors
Traders: Consider cautious trading around current levels, watching for RSI and MACD signals for entry/exit points. Be mindful of resistance near $120,000.
Investors: Accumulation phase suggests good opportunities for long-term holding, especially if Bitcoin holds above $117,000.
Risk Management: Keep stop-loss orders near support levels to mitigate downside risk in case of a correction.

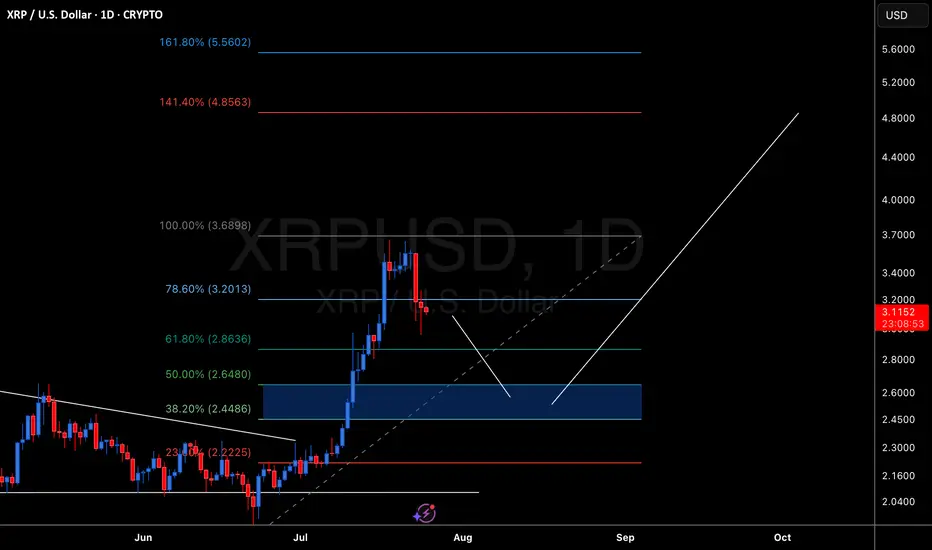
XRP Temporary Pull Back Followed Bu Move Up To $4.00XRP Created a new high. Looking for a pull back to the 50% retracement level. Followed by a move up to the 141 fib level of around $4.00
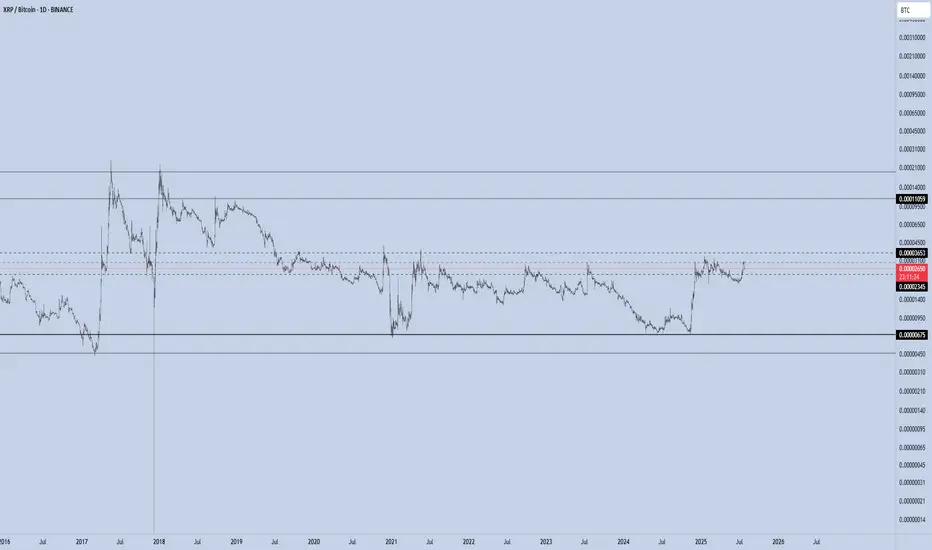
XRP/BTC – Channel Midline in Play The XRP/BTC pair trade inside a multi-year channel, with price currently testing the midline of this structure — a pivotal level that could define the next macro leg.
If bulls manage to break the midline to the upside and successfully retest it as support, the upper boundary of the channel becomes the next major target.
🔼 Upside Scenario:
A confirmed breakout above the midline would signal structural strength and likely lead to a rally toward the upper channel resistance.
If this move aligns with BTC dominance dropping below the 60% threshold, we could see a full-blown altseason emerge.
Under such conditions, historical XRP/BTC behavior suggests that XRP/USD could reach $12–$24.
🔽 Downside Risk:
Losing the mid-channel from here would weaken the structure and invalidate the breakout thesis.
In that case, XRP/BTC would likely rotate back toward range lows, and a defensive strategy is warranted.
Macro Implication:
The 60% BTC Dominance level remains critical. A clean breakdown below it historically marks the beginning of altseason, where high-beta plays like XRP against BTC have outperformed. XRP’s current posture within the channel reflects this high-stakes moment.

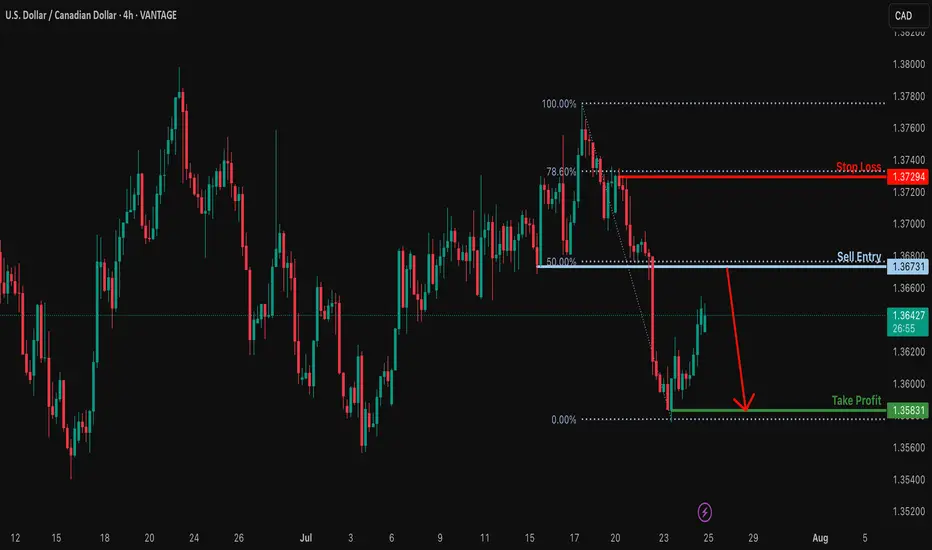
Heading into 50% Fibonacci resistance?USD/CAD is rising towards the resistance level, which serves as a pullback resistance that aligns with the 50% Fibonacci retracement and could reverse from this level to our take-profit target.
Entry: 1.3673
Why we like it:
There is a pullback resistance that lines up with the 50% Fibonacci retracement.
Stop loss: 1.3729
Why we like it:
There is a pullback resistance that lines up with the 78.6% Fibonacci retracement.
Take profit: 1.3583
Why we like it:
There is a swing low support.
Enjoying your TradingView experience? Review us!
Please be advised that the information presented on TradingView is provided to Vantage (‘Vantage Global Limited’, ‘we’) by a third-party provider (‘Everest Fortune Group’). Please be reminded that you are solely responsible for the trading decisions on your account. There is a very high degree of risk involved in trading. Any information and/or content is intended entirely for research, educational and informational purposes only and does not constitute investment or consultation advice or investment strategy. The information is not tailored to the investment needs of any specific person and therefore does not involve a consideration of any of the investment objectives, financial situation or needs of any viewer that may receive it. Kindly also note that past performance is not a reliable indicator of future results. Actual results may differ materially from those anticipated in forward-looking or past performance statements. We assume no liability as to the accuracy or completeness of any of the information and/or content provided herein and the Company cannot be held responsible for any omission, mistake nor for any loss or damage including without limitation to any loss of profit which may arise from reliance on any information supplied by Everest Fortune Group.
Ethereum Price Target $3,120 by Sunday?Ethereum short position Price Target $3,120 by Sunday ? Negative divergence on the hrly RSI.
Exhausted the 15 minute positive divergence when bouncing off the EMA 200 on the 1 Hour chart. First profit target is $3,350 second is $3,120. I am usually wrong with my estimations... I would recommend the opposite. So go long!

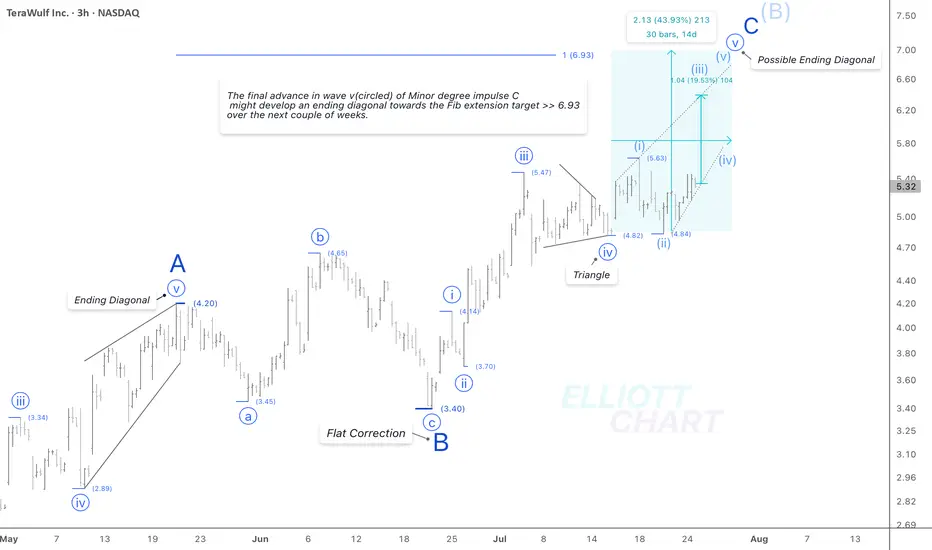
WULF / 3hWave Analysis >> While the current outlook on WULF remains consistent with previous analysis, the internal structure of wave v (circled) suggests the potential development of an ending diagonal in the final leg of Minor degree wave C.
Trend Analysis >> Upon completion of Minor degree wave C, the countertrend advance of Intermediate degree wave (B), which has been unfolding since April 9, is likely to give way to a decline in wave (C) of the same degree. This downtrend might begin in the coming days and potentially extend through the end of the year.
NASDAQ:WULF CRYPTOCAP:BTC BITSTAMP:BTCUSD MARKETSCOM:BITCOIN
#CryptoStocks #WULF #BTCMining #Bitcoin #BTC