CHFJPY ASIA Session BearsDuring this trading session, we should see price retest the lows created before a strong bullish continuation.
Trend Analysis

AUDUSD(20250725)Today's AnalysisMarket news:
The European Central Bank announced that it would maintain the three key interest rates unchanged, reiterated data dependence, warned that the external environment is highly uncertain, and President Lagarde did not rule out the possibility of future rate hikes. Traders reduced their bets on ECB rate cuts.
Technical analysis:
Today's buying and selling boundaries:
0.6598
Support and resistance levels:
0.6638
0.6623
0.6613
0.6583
0.6573
0.6559
Trading strategy:
If the price breaks through 0.6598, consider buying in, with the first target price of 0.6613
If the price breaks through 0.6583, consider selling in, with the first target price of 0.6573

XAUUSD – healthy correction, ready to bounce from 3,338Gold is retracing within an ascending channel after facing rejection at the FVG zone near 3,402.800. This pullback is seen as a healthy correction, with confluence support around 3,338, which previously acted as a springboard for bullish momentum.
As long as price holds above this zone, a rebound toward 3,402 remains likely.
Primary scenario
Buy zone: 3,338
Target: 3,402
Invalidation: Break below 3,320
Note
Weak volume near the FVG zone may cause short-term consolidation, but the broader trend still favors buyers.

EURUSD – The Comeback is Real! After weeks trapped in a descending channel, EURUSD has broken out in style, launching into a clean bullish channel. Price is now carving a staircase of FVG zones, with momentum clearly favoring the bulls.
What’s fueling the fire?
Flash Manufacturing PMI from Europe beat forecasts
Eurozone consumer confidence improved
Markets pricing in dovish Fed as jobless claims dropped but inflation expectations stall
As long as price stays above 1.1750 and respects the ascending channel, the 1.1850 zone is well within reach.
Strategy: Buy the dips inside the bullish channel. FVGs act as stepping stones for further upside.

XAUUSDXAUUSD Updated in 15M :
The gold signal is marked on the chart based on the latest price changes and the supply and demand in the market. These points include the entry point, stop loss, and take profit
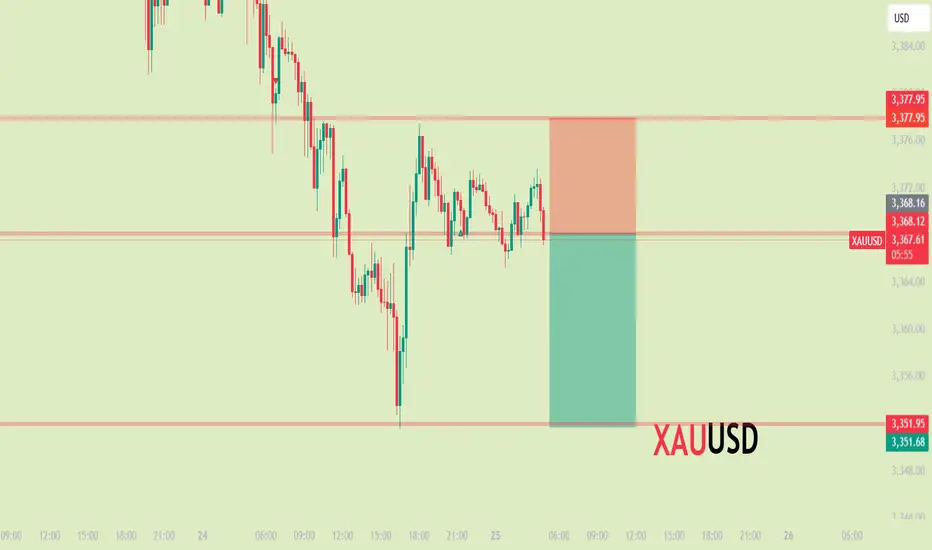
July 25, 2025 - XAUUSD GOLD Analysis and Potential OpportunitySummary:
The downtrend continues, with 3350 providing some support — though not strong enough to indicate a solid reversal. Watch for a retest of this level; if 3350 breaks, bearish momentum may resume. For now, price is ranging between 3365–3375. Continue to trade the range with a sell-high, buy-low mindset.
• Break below 3365 → look to short on pullbacks.
• Break above 3375 → switch to buying on dips.
🔍 Key Levels to Watch:
• 3434 – Resistance
• 3420 – Resistance
• 3405 – Key resistance
• 3400 – Psychological level
• 3384 – Resistance
• 3375 – Key resistance
• 3364 – Support
• 3358 – Support
• 3345 – Strong support
• 3336 – Support
• 3330 – Support
📈 Intraday Strategy:
• SELL if price breaks below 3365 → target 3362, then 3358, 3351, 3345
• BUY if price holds above 3375 → target 3380, then 3385, 3390, 3396
👉 If you find this helpful or traded using this plan, a like would mean a lot and keep me motivated. Thanks for the support!
Disclaimer: This is my personal view, not financial advice. Always use proper risk control.
Gold technical outlook – Signs of exhaustion at channel topOANDA:XAUUSD is climbing within a well-defined ascending channel, and price is now brushing up against the upper boundary, a dynamic resistance zone that has historically triggered pullbacks. If price gets rejected here, we may see a healthy correction toward the key support at 3,350, offering a potential reload point for bulls.
Should buyers step in and defend this level, the bullish structure remains intact, setting the stage for a renewed push higher. On the other hand, a clean break below 3,350 could open the door for a deeper retracement toward the lower edge of the channel, where more significant demand may lie.
All eyes should be on price action and volume in this regio, watch for reversal patterns like bullish pin bars or engulfing candles to confirm entries. As always, risk management comes first. Don't trade assumptions, trade confirmations.
What’s your take on this setup? Drop your thoughts below and let’s discuss!

AUDCHF expecting bullish contianution
OANDA:AUDCHF interesting structure, trend based analysis, here exepcting bullish continuation.
SUP zone: 0.52200
RES zone: 0.52900, 0.53200

GBPUSD Rebounds Strongly – Is the Uptrend Ready to Resume?Hello traders!
On the D1 chart, GBPUSD is showing a strong recovery after bouncing off the support zone around 1.33500–1.34500. This rebound happened right at the ascending trendline and the confluence with the EMA, reinforcing the strength of the bullish zone.
The overall bullish structure remains intact. As long as price stays above the trendline, I expect GBPUSD to continue its move toward the resistance area near the recent highs.
My strategy is to look for buying opportunities around the support zone or after a confirmation signal from price action following a minor pullback.
Good luck and happy trading!

GBPJPY Buy Setup
📈 Entry: 199.017
🎯 Target: 200.912
🔒 Reason: Bullish momentum in play with clean structure. Buying the breakout continuation aiming for psychological resistance near 201.00.

Bearish Bias on USD/JPYBearish Bias on USD/JPY
Pair: USD/JPY
Bias: Bearish
Entry Type: Pending Sell Limit Order
Entry Zone: 147.54
Stop Loss: 148.10
Take Profit: 145.17
Technical Rationale:
Market Structure Shift (MSS):
The chart shows a clear break of structure (BoS) to the downside after a prolonged bullish move. The most recent lower low and lower high formation confirms a shift in market sentiment.
Supply Zone (Order Block):
Price is retracing back into a 2H supply zone (highlighted red), which is aligned with a bearish order block around 147.54–148.10. This zone represents institutional selling interest from a previous strong sell-off.
Liquidity Grab / Sweep:
Prior to the drop, there was an internal liquidity sweep above a local high, potentially indicating a buy-side liquidity grab. The retracement may now be engineered to tap into this supply zone to mitigate orders before a continuation downward.
Premium Pricing:
Using a FVG (Fair Value Gap) or Fibo level reference, this supply zone sits in the premium pricing area, ideal for institutional short positioning in SMC theory.
Confluence:
Bearish break of structure
Return to supply zone
Liquidity sweep before drop
Fair value gap alignment

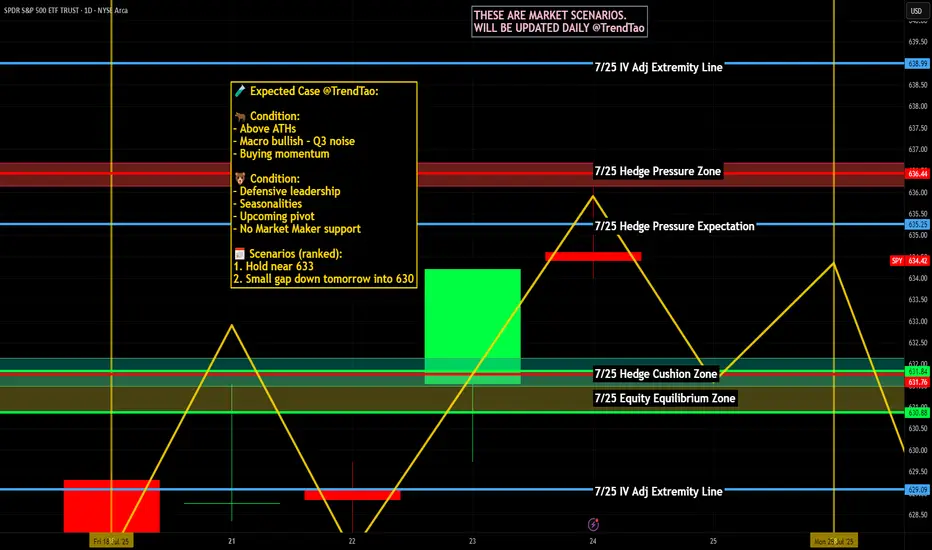
Nightly $SPY / $SPX Scenarios for July 25, 2025🔮 Nightly AMEX:SPY / CBOE:SPX Scenarios for July 25, 2025 🔮
🌍 Market‑Moving News 🌍
🏔️ Copper Market Flashpoint
Following President Trump’s announcement of steep copper tariffs (15–50% range), U.S. copper futures surged, then sharply reversed. Inventory arbitrage between CME and LME markets surged, distorting pricing dynamics and triggering concern over metal market stability.
🇪🇺 EU–China Summit Signals Trade Reset
EU leaders concluded their 25th summit with China, fostering deeper economic and strategic ties. Observers expect follow-up on mutual trade agreements, particularly regarding tech and sustainability sectors.
🌍 EM Equity Rally Consolidates Gains
Emerging markets continue to outperform global equities in 2025—with MSCI EM up ~18% vs. S&P 500. Analysts highlight strong opportunities in AI/fintech stocks in China and Latin America, suggesting further rotations out of U.S. markets.
📊 Key Data Releases & Events 📊
📅 Friday, July 25:
8:30 AM ET – Durable Goods Orders (June):
Forecast shows a sharp drop (~–10%), following a ~16% gain in May—signaling possible cooling in business-related equipment purchases.
10:00 AM ET – U.S. Imports of Steel Products (June):
Trade-data release monitoring steel flows amid evolving tariff frameworks.
All Day – Corporate Earnings Reports:
Companies such as First Financial Bancorp (FFBC), HCA, AON, Charter, and others report earnings. Outlooks may influence small- to mid-cap sentiment.
⚠️ Disclaimer:
This report is for educational and informational purposes only—not financial advice. Always consult a licensed financial advisor before making investment decisions.
📌 #trading #stockmarket #economy #data #earnings #commodities #EM #technicalanalysis
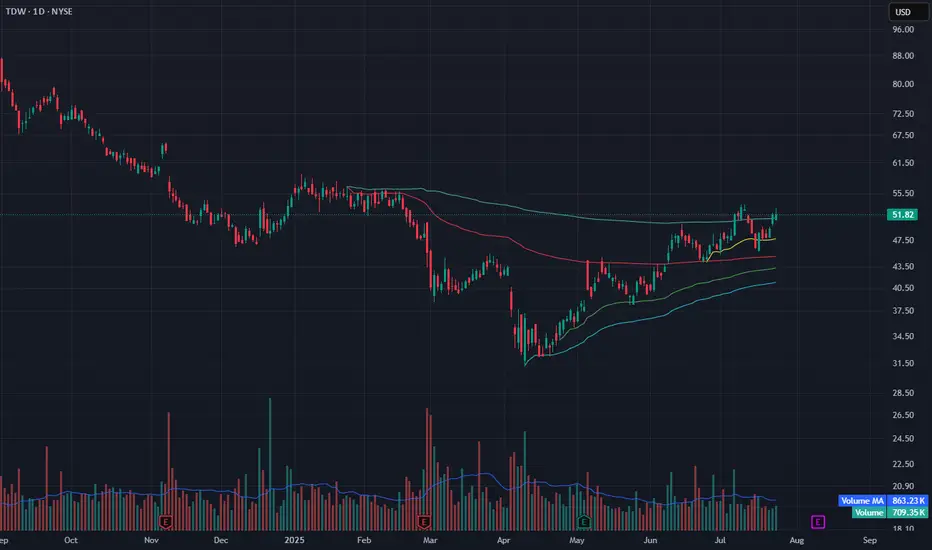
TDW Breaks Out from VWAP Stack – Testing Long-Term ResistanceTDW has broken out from a clean VWAP stack structure and is now testing long-term resistance near $52. Price has made a strong recovery since April and is currently holding above the yellow and red VWAP levels with a higher low pattern.
Today’s close at $51.82 keeps it right at resistance, and a break above $52 could open room toward $55+. Volume is slightly below average (709K vs. 863K MA), but the structure remains bullish as long as it holds above $48.50.
Indicators used:
Anchored VWAP (multi-tier support)
Volume + Volume MA (momentum context)
Price structure (higher lows, breakout test)
Entry idea: Breakout above $52
Target: $55–56.50
Stop: Below $48.50 or red VWAP
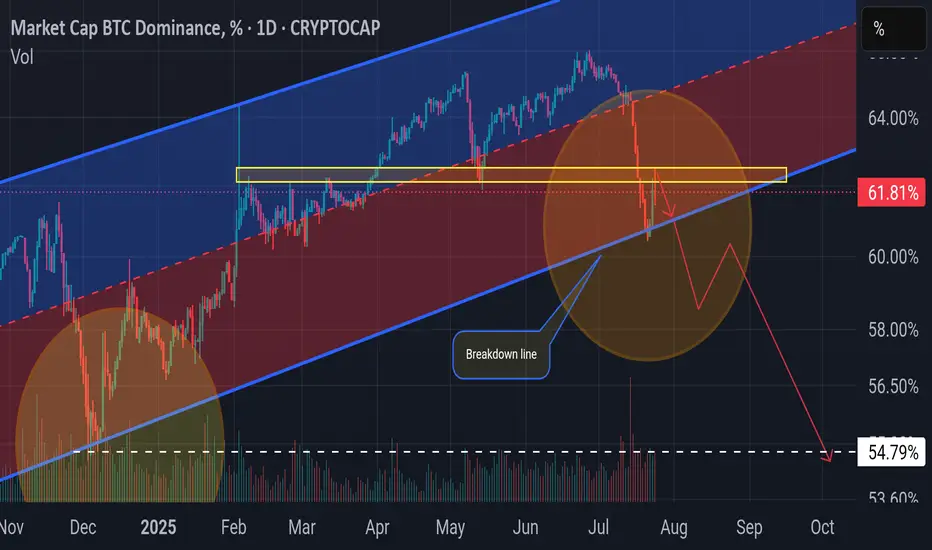
BTC.D The party begins 🚀 Altseason has kicked off. BTC.D's candle body already broke below the breakdown line briefly and is now bouncing slightly off the trendline — just a retest before another leg down. Once it breaks again, that’s when the real party starts 📈🎉.
SILVER Retest of Cup and Handle Neckline📈 XAGUSD Trade Idea – July 25, 2025
Timeframe: 4H
Instrument: Silver / USD (XAGUSD)
Direction: Bullish continuation
Entry Zone: $39.00 - $39.10
Current Price: $39.103
🔍 Technical Analysis:
Cup & Handle Pattern: A clean cup formation is visible from July 15–21, followed by a bullish breakout and minor handle-like retracement.
Retest in Progress: Price is retesting the breakout zone around $39.00, showing consolidation above a strong support structure.
Dynamic Support Confluence: Multiple EMAs (green/orange/red cloud) are acting as support, with recent bullish candles bouncing off the mid-band area.
TD Sequential: A new "7" count signals potential continuation of the trend if support holds.
Volume Gap Below: Clean inefficiency (thin volume) below $38.40–$38.00 which may act as a magnet in case of invalidation, but is also untested demand.
📌 Trade Setup:
Entry: Around $39.00–$39.10 on confirmed support hold
Stop Loss: Below $38.50 (beneath EMA and recent higher low)
Take Profit Zones:
TP1: $39.80 (recent swing high)
TP2: $40.60 (measured move from cup breakout)
TP3: $41.00 psychological round number

XAUUSD Bullish ScenarioAccording to the data in the chart, the price has proven its bullishness by breaking important levels. Overall analysis can be buying at $3340 towards the target of $3450. On the other hand, if the price breaks $3340 with strength, the bullish scenario can fail.

Gold:- Top - Down Opportunities for both bulls and bearsGold - Opportunities for both bulls and bears. First, there will be a buy after taking out the structural liquidity. For the bears, after taking out all minor structures, will sell from the visible zone as shown in the diagram.

GOLD (XAU/USD) SHORT TRADE PLAN
July 25, 2025
Trade Overview (My setup)
- Direction: Short (SELL)
- Entry Price: $3,330
- Take-Profit: $3,270
- Stop-Loss: $3,370
- Lot Size: 0.18 lots (18 oz)
- Risk: $720
- Reward: $1,080
- Risk/Reward Ratio: 1.5 : 1
Technical Analysis Supporting the Bearish Bias
1. Price Structure & Trend
- Descending channel observed on the 4H chart - strong short-term bearish signal.
- Series of lower highs and lower lows confirms bearish trend.
- Price is testing $3,325-$3,300 support - breakdown opens downside to $3,270-$3,250.
2. Key Support/Resistance Zones
- Key support: $3,300 being tested.
- Resistance: $3,360-$3,370 zone - logical stop-loss location.
3. Indicator Confirmations
RSI (4H): ~35-40, bearish territory, no bullish divergence.
Moving Averages: Price below 50 EMA and 200 EMA - bearish crossover.
MACD: Bearish crossover, histogram confirms selling momentum.

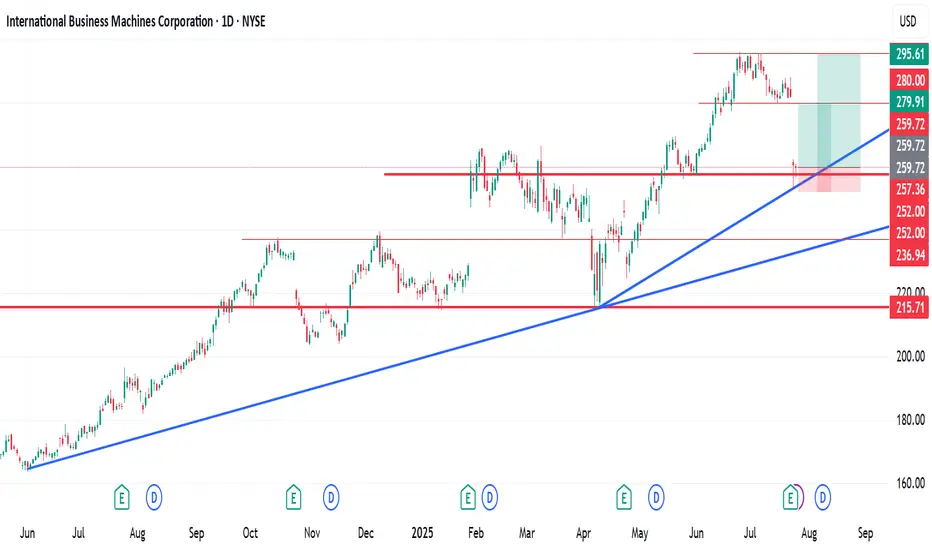
IBM Stock Forecast and Technical OutlookIBM Stock Forecast and Technical Outlook.
International Business Machines Corporation (IBM) reached a recent peak in June 2025 before experiencing a gradual decline. On July 24th, the stock saw a significant drop of over 10%, likely triggered by investor reaction to recent company news or broader market sentiment.
Despite this sharp decline, technical indicators on my chart suggest the potential for a short- to medium-term recovery. Based on my analysis, there are two potential setups with favourable Risk-to-Reward (R:R) ratios:
Scenario 1: R:R of 1:2.63
Scenario 2: R:R of 1:4.65
I bought some shares at $260.17
These figures indicate that for every unit of risk taken, there is a potential return of 2.63x or 4.65x, respectively, depending on the chosen entry and exit strategy.
As always, investors are advised to conduct their due diligence and apply proper risk management techniques before entering any position.
Hey friends, if this is helpful, kindly like, follow, subscribe, share and comment
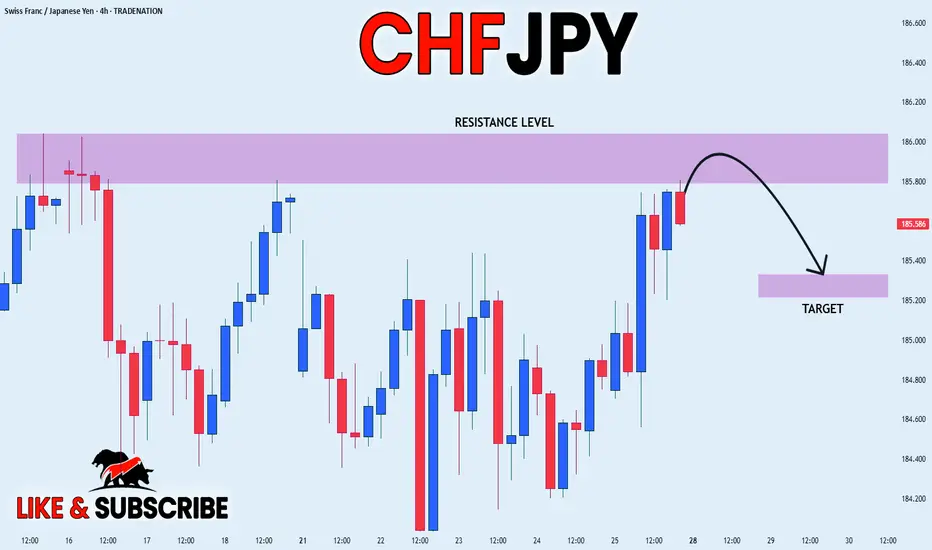
CHF_JPY RISKY SHORT|
✅CHF_JPY is going up now
But a strong resistance level is ahead at 186.036
Thus I am expecting a pullback
And a move down towards the target of 185.329
SHORT🔥
✅Like and subscribe to never miss a new idea!✅
Disclosure: I am part of Trade Nation's Influencer program and receive a monthly fee for using their TradingView charts in my analysis.
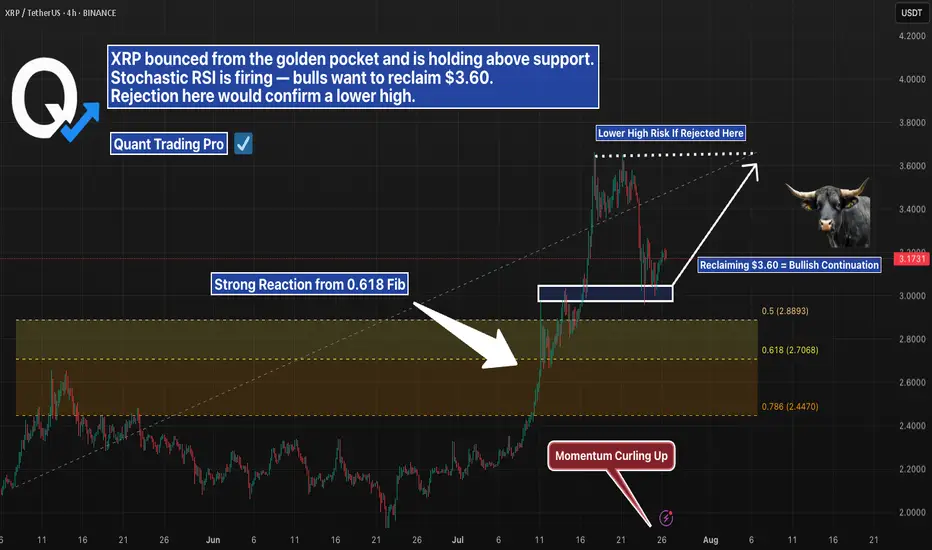
XRP 4H – Golden Pocket Bounce, But Will Bulls Reclaim $3.60?XRP pulled back cleanly into the golden pocket (0.618 Fib) after a strong rally — and buyers stepped in with force. Momentum flipped quickly, and Stochastic RSI is curling up with bullish intent.
Now price is holding above short-term support, but faces a key challenge:
→ $3.60 marks the prior high
→ Reclaiming that level would confirm bullish continuation
→ A rejection here would set up a lower high and shift structure bearish
This is a make-or-break moment for XRP in the short term. The golden pocket held — now the top of the range needs to flip.
#XRP #GoldenPocket #Fibonacci #CryptoAnalysis #StochasticRSI #LowerHighRisk #PriceAction #QuantTradingPro
CRUDE OIL Risky Long! Buy!
Hello,Traders!
CRUDE OIL will soon hit
A horizontal support
Of 64.50$ and as it is
A strong level we will be
Expecting a local bullish
Rebound on Monday
Buy!
Comment and subscribe to help us grow!
Check out other forecasts below too!
Disclosure: I am part of Trade Nation's Influencer program and receive a monthly fee for using their TradingView charts in my analysis.

SILVER SUPPORT AHEAD|LONG|
✅SILVER has been falling recently
And Silver seems locally oversold
So as the pair is approaching
A horizontal support of 37.80$
Price growth is to be expected
LONG🚀
✅Like and subscribe to never miss a new idea!✅
Disclosure: I am part of Trade Nation's Influencer program and receive a monthly fee for using their TradingView charts in my analysis.
