BTCUSD LONGIt's a long time to write and explain everything, just buy the level with the limit that is at ~117.550. You can count on a short-term rebound.
The one below the touchdown is not worth taking. I'll let you know if it works or not later.
Trend Analysis

Bitcoin Cash $2,615 Minimum · $4,178 Possible · Plan Ahead105 days. This is definitely the longest stretch of bullish action since 2021. Bitcoin Cash has been growing non-stop for 105 days.
If someone told you this would be the case some months ago or a few years back you wouldn't believe it. What if someone tells you now that you've seen nothing yet? What if I told you that the best is yet to come? This is only the build-up process. Bitcoin Cash is about to shoot up really strong. It will skew the chart. People won't be able to comprehend what is happening less adapt to the market. It will be chaos, bullish chaos.
Years of consolidation. Bitcoin Cash has been on a wide trading range since February 2024. We can easily say since mid-2023 if we consider using a wider range. This is all the build-up process for this moment now. The 2025 bull market. Predicted years ago, now it cannot be denied, it is right in your face.
Let's play the other side for entertainment's sake. Bitcoin Cash stops rising, either a lower high now or a reversal at the December or April 2024 high. What would happen then? A bear market? No! Just a down-wave, more consolidation before the final advance, price jump and market bull run.
Let's go back to reality for accuracy's sake. Bitcoin Cash will grow in bullish momentum and will break all resistance one next to the other, stops will be short. If there is a correction in-between the action, it won't be long.
Look back to the 2021 bullish wave, the fifth wave; notice three weeks red, two weeks red, one week red, etc., in-between the rising wave. Straight up but obviously, there are some stops. When we are in the experience, when it is happening, these weeks feel like forever and we never know if it will continue rising or if that's it, we reached the end. I am telling you now, it will not be over until a major new all-time high hits, and the levels are being shown now. When we are more advanced in the market cycle, I will not try to predict the short-term. Instead, I will tell you to secure profits and move on. Once prices are really high, close your position and start looking for the ones still trading low near support. Of course, writing this won't change anything, people will still be attracted to the action and mistakes will be the norm. Only if you bought early when prices were low, you will be able to withstand the market pressure. If you buy late, the market will kill you and take everything from you. This is a friendly reminder. Plan ahead.
Namaste.

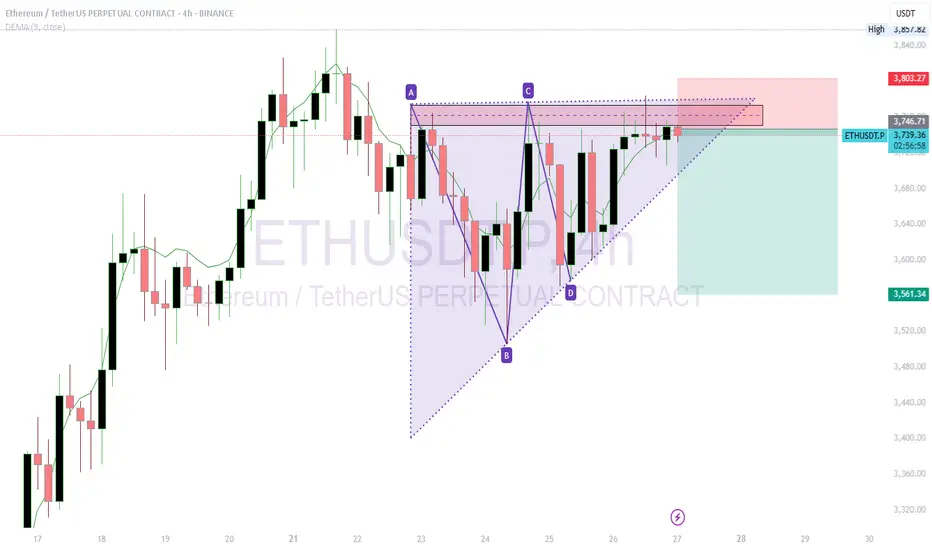
ETHUSDT Short Trade IdeaShort ETHUSDT at $3,745.22 with a target of $3,561.34.
Reason for Short: The 4-hour chart shows a symmetrical triangle pattern with resistance around $3,745-$3,800. The price is testing this upper trendline, and a recent bearish candle suggests potential rejection. The DEMA at $3,747.75 indicates overextension, supporting a pullback.
What I See: Heavy sell pressure is forming near $3,745, with the triangle nearing a breakout/breakdown point. Support lies around $3,561, aligning with prior lows.
Stop Loss: Set at $3,802, above the recent high and triangle resistance, to avoid a bullish breakout.
Trade Rationale: A breakdown from the triangle with volume confirmation could drive the price to $3,561. The tight stop above resistance minimizes risk while targeting a key support level.
ETH/USD Long Setup Targeting $3,790ETH/USD 1H Trade Setup:
Price is currently at $3,748.5 with a long (buy) setup targeting $3,790.9. The stop loss is set at $3,725.4, aiming for a breakout to the upside within a tight consolidation range.

GOLD Ignites! Triangle Breakout Targets $3,760Gold has broken out of a multi-month symmetrical triangle on the daily chart, signaling a potential continuation of the broader bullish trend. The measured move targets the $3,760 zone, with risk managed below the recent support $3244. According to latest COT report money managers increased the net long positions, reflecting institutional confidence in gold's upside.

SONIC. USDTIt's been a long time the current Sonic( S ), and the Fantom of the past have been moving in neutral.
So,
It's time to make a profit for their investors.

Hedera 2025 All-Time High · Simple Analysis Bullish ConfirmedHedera is about to close five weeks green. Five weeks green and we only have a minor advance, relatively speaking. Some 100%. Back in late 2024 five weeks green resulted in more than 800% growth. Huge difference, but after the fifth week growth stopped. This time it will be different.
We already have five weeks of bullish action and this is only portion of the entire bullish period, just a small part. This can continue for months, then a stop and one final jump. Or this can start now and just keep on going until it peaks and that's it, nor more growth until the next bullish phase. So we would see a bear market after the completion of the bull market and the only bullish action would be corrections within the bear market. Right now market conditions are extremely bullish.
We have a long-term lower high. In early 2025 the action peaked below the 2021 all-time high. The wave that is developing now will break this barrier and produce a new all-time high. This is very easy to predict, market conditions are bullish.
The interesting part will be to see how far up Hedera will go. We can use this project, since it is definitely going to be one of the first to peak, to know how the rest of the market will perform. Easy we have between 200% and 400% potential for growth.
I hope you are being entertained and I really hope you enjoy the content. If you do, give me a follow @MasterAnanda
Namaste.

PERPUSDT – Right Setup, Right PlaceThe target is clear, the green line.
But how you get there matters more than if you get there.
🧊 Inclusion Plan
The blue boxes are where I’d consider entry.
They’re not just price zones — they’re areas of alignment:
Historical consolidation - Volume profile acceptance
Footprint showing seller weakness
Yes, you could enter earlier,
but that wouldn’t be optimal.
✅ Smart Execution
Wait for price to revisit the box with control.
Watch CDV for demand confirmation,
and structure reclaim on LTFs before committing.
“You don’t win by being early. You win by being precise.”
No chasing. No guessing.
Just smart inclusion where the math makes sense.
📌I keep my charts clean and simple because I believe clarity leads to better decisions.
📌My approach is built on years of experience and a solid track record. I don’t claim to know it all but I’m confident in my ability to spot high-probability setups.
📌If you would like to learn how to use the heatmap, cumulative volume delta and volume footprint techniques that I use below to determine very accurate demand regions, you can send me a private message. I help anyone who wants it completely free of charge.
🔑I have a long list of my proven technique below:
🎯 ZENUSDT.P: Patience & Profitability | %230 Reaction from the Sniper Entry
🐶 DOGEUSDT.P: Next Move
🎨 RENDERUSDT.P: Opportunity of the Month
💎 ETHUSDT.P: Where to Retrace
🟢 BNBUSDT.P: Potential Surge
📊 BTC Dominance: Reaction Zone
🌊 WAVESUSDT.P: Demand Zone Potential
🟣 UNIUSDT.P: Long-Term Trade
🔵 XRPUSDT.P: Entry Zones
🔗 LINKUSDT.P: Follow The River
📈 BTCUSDT.P: Two Key Demand Zones
🟩 POLUSDT: Bullish Momentum
🌟 PENDLEUSDT.P: Where Opportunity Meets Precision
🔥 BTCUSDT.P: Liquidation of Highly Leveraged Longs
🌊 SOLUSDT.P: SOL's Dip - Your Opportunity
🐸 1000PEPEUSDT.P: Prime Bounce Zone Unlocked
🚀 ETHUSDT.P: Set to Explode - Don't Miss This Game Changer
🤖 IQUSDT: Smart Plan
⚡️ PONDUSDT: A Trade Not Taken Is Better Than a Losing One
💼 STMXUSDT: 2 Buying Areas
🐢 TURBOUSDT: Buy Zones and Buyer Presence
🌍 ICPUSDT.P: Massive Upside Potential | Check the Trade Update For Seeing Results
🟠 IDEXUSDT: Spot Buy Area | %26 Profit if You Trade with MSB
📌 USUALUSDT: Buyers Are Active + %70 Profit in Total
🌟 FORTHUSDT: Sniper Entry +%26 Reaction
🐳 QKCUSDT: Sniper Entry +%57 Reaction
📊 BTC.D: Retest of Key Area Highly Likely
📊 XNOUSDT %80 Reaction with a Simple Blue Box!
📊 BELUSDT Amazing %120 Reaction!
📊 Simple Red Box, Extraordinary Results
📊 TIAUSDT | Still No Buyers—Maintaining a Bearish Outlook
📊 OGNUSDT | One of Today’s Highest Volume Gainers – +32.44%
📊 TRXUSDT - I Do My Thing Again
📊 FLOKIUSDT - +%100 From Blue Box!
📊 SFP/USDT - Perfect Entry %80 Profit!
📊 AAVEUSDT - WE DID IT AGAIN!
I stopped adding to the list because it's kinda tiring to add 5-10 charts in every move but you can check my profile and see that it goes on..

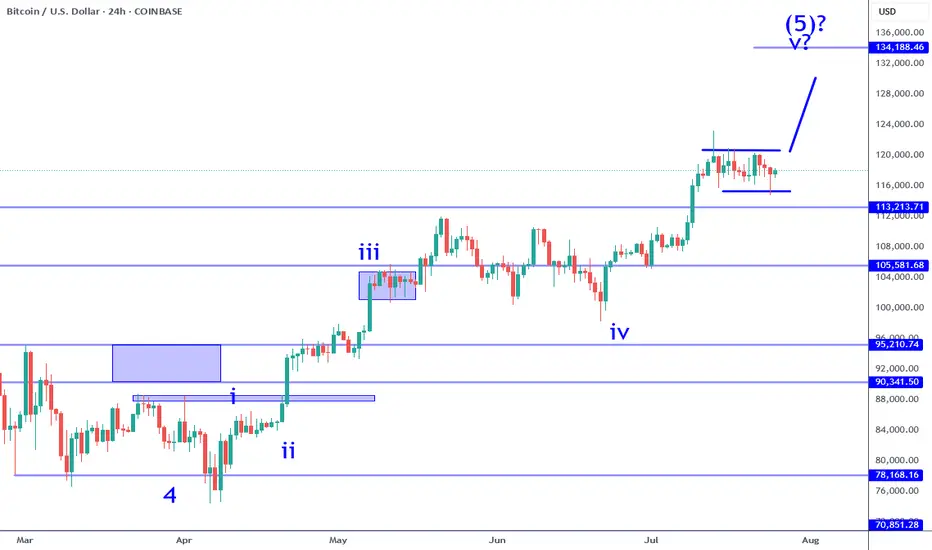
Bitcoin Still Consolidating For Wave 5 RallyBitcoin sub wave 4 consolidation continues to persist. While there was a failed break out over the previous week, it has not changed the bullish impulse at all. The current structure implies that there is a higher probability that one more leg higher (sub wave 5) is likely. It could be the coming week or next, it is all a function of catalyst. Keep in mind this consolidation can test as low at 113K and still be within the criteria of a wave 4. There are numerous opportunities in this situation when it comes to day trade and swing trade longs.
The break out: IF price pushes beyond 120K with conviction (large sustained candle on this time frame) that would be a swing trade long signal. IF there is no instant pullback (fake out), this can be the momentum required to test the 130Ks. Keep in mind, there is an inflection point in the 133K area which serves as a profit objective to measure from. Price can potentially go beyond that point, but participating in that is all about waiting and watching how price behaves. There is NO way to know how this will play out in advance. You have to adjust as new information becomes available.
The retest: if price pulls back into the 116K to 113K area and establishes a reversal on this time frame (or on adjacent time frames like 4H). This can appear in numerous ways: pin bar, engulfing candle, inverse head and shoulders, etc. This scenario would offer greater potential especially if the break out occurred soon after (high probability). IF the 113K level breaks instead, it will put the impulse structure into question. Meaning the probability of a wave 5 to follow will become lower.
This environment in my opinion is not easy to navigate for traders. People who bought into the alt coin weakness months ago are now getting paid and enjoying "alt season", which is great but not good if you are looking to buy something now with a longer time horizon in mind. Wave 5's often signal a corrective move is likely to follow and Bitcoin is potentially completing a very large magnitude Wave 5. I have been pointing this out for months. Most investors will ignore this because they will be biased by greed. The wise this to do is lock in profits along the way at inflection points such as whole numbers, price proportions (like 133K) and/or clear candle reversal signals after significant moves.
Thank you for considering my analysis and perspective.
$BABY Breakout.LSE:BABY just broke out of a long-term downtrend on the daily chart.
If it holds above the $0.056–$0.058 zone, it could rally toward $0.109, a potential 186% move.
Momentum looks strong, and this breakout might be the start of a bigger trend
DYOR, NFA

REIUSDT – The Setup Is in the WaitingPatience is often underrated,
but waiting for price in the blue box might offer the best R:R scenario here.
📍 Strategy
If REIUSDT pulls back into the blue box,
and then gives a 1H structure break
with CDV supporting the move,
that’s where my plan activates.
🔁 What I’ll Watch For
✅ Controlled pullback
✅ CDV backing the breakout, not just wicks
✅ Clean 1H close above the box with structure forming
“Price is what you pay. Value is what you get.” – Benjamin Graham
"You don’t need to chase. You need to notice."
This setup isn’t about hope.
It’s about recognizing clarity when it forms.
📌I keep my charts clean and simple because I believe clarity leads to better decisions.
📌My approach is built on years of experience and a solid track record. I don’t claim to know it all but I’m confident in my ability to spot high-probability setups.
📌If you would like to learn how to use the heatmap, cumulative volume delta and volume footprint techniques that I use below to determine very accurate demand regions, you can send me a private message. I help anyone who wants it completely free of charge.
🔑I have a long list of my proven technique below:
🎯 ZENUSDT.P: Patience & Profitability | %230 Reaction from the Sniper Entry
🐶 DOGEUSDT.P: Next Move
🎨 RENDERUSDT.P: Opportunity of the Month
💎 ETHUSDT.P: Where to Retrace
🟢 BNBUSDT.P: Potential Surge
📊 BTC Dominance: Reaction Zone
🌊 WAVESUSDT.P: Demand Zone Potential
🟣 UNIUSDT.P: Long-Term Trade
🔵 XRPUSDT.P: Entry Zones
🔗 LINKUSDT.P: Follow The River
📈 BTCUSDT.P: Two Key Demand Zones
🟩 POLUSDT: Bullish Momentum
🌟 PENDLEUSDT.P: Where Opportunity Meets Precision
🔥 BTCUSDT.P: Liquidation of Highly Leveraged Longs
🌊 SOLUSDT.P: SOL's Dip - Your Opportunity
🐸 1000PEPEUSDT.P: Prime Bounce Zone Unlocked
🚀 ETHUSDT.P: Set to Explode - Don't Miss This Game Changer
🤖 IQUSDT: Smart Plan
⚡️ PONDUSDT: A Trade Not Taken Is Better Than a Losing One
💼 STMXUSDT: 2 Buying Areas
🐢 TURBOUSDT: Buy Zones and Buyer Presence
🌍 ICPUSDT.P: Massive Upside Potential | Check the Trade Update For Seeing Results
🟠 IDEXUSDT: Spot Buy Area | %26 Profit if You Trade with MSB
📌 USUALUSDT: Buyers Are Active + %70 Profit in Total
🌟 FORTHUSDT: Sniper Entry +%26 Reaction
🐳 QKCUSDT: Sniper Entry +%57 Reaction
📊 BTC.D: Retest of Key Area Highly Likely
📊 XNOUSDT %80 Reaction with a Simple Blue Box!
📊 BELUSDT Amazing %120 Reaction!
📊 Simple Red Box, Extraordinary Results
📊 TIAUSDT | Still No Buyers—Maintaining a Bearish Outlook
📊 OGNUSDT | One of Today’s Highest Volume Gainers – +32.44%
📊 TRXUSDT - I Do My Thing Again
📊 FLOKIUSDT - +%100 From Blue Box!
📊 SFP/USDT - Perfect Entry %80 Profit!
📊 AAVEUSDT - WE DID IT AGAIN!
I stopped adding to the list because it's kinda tiring to add 5-10 charts in every move but you can check my profile and see that it goes on..

Stock Market Forecast | TSLA NVDA AAPL AMZN META MSFTStock Market Forecast | CME_MINI:NQ1! CME_MINI:ES1! SPY QQQ
Mag 7 forecast NASDAQ:TSLA NASDAQ:NVDA AAPL AMZN META MSFT GOOG

AT&T – Still Ringing?AT&T. The name alone evokes landlines, long-distance charges, and a time when phones had cords (and possibly rotary dials). But don’t let the vintage vibes fool you — this telecom titan might still have some signal left on the price chart.
Now, I’m not saying AT&T is about to moonwalk up the NASDAQ leaderboard — but I’ve seen slower giants pick up speed. And if you squint just right, the chart has been whispering, "Maybe I’m not dead yet."
From a chart perspective:
After what felt like years of sideways static, the price may finally be picking up a bar or two. Recent structure hints at a potential trend reversal — or at least a modest attempt to climb out of the basement. Support levels are holding like a stubborn dial-up connection, and the candles are starting to lean north.
Is this the beginning of a full-blown comeback or just a dead-cat bounce in a trench coat? Hard to say. But I’m watching with interest — and maybe a little nostalgic hope that this once-glorious phone company still has some long-distance strength left in it.
No guarantees, no predictions — just one person watching a chart and thinking: "This thing might still be ringing."
A lighthearted market musing, not financial advice!

ondo bullish🔹 Harmonic Pattern (Possibly a Gartley or Bat)
The chart shows a clear ABCD pattern, suggesting a potential reversal zone around point D.
• A → B → C → D structure is visible.
• Based on Fibonacci ratios:
• AB ≈ 0.75 retracement (close to Bat or Gartley pattern)
• BC ≈ 1.32 extension, which also fits harmonic rules
📌 Point D is around 1.1077, which is likely a resistance/reversal area.
⸻
🔹 RSI (Relative Strength Index)
• RSI is around 50, indicating neutral momentum (not overbought or oversold).
• It’s starting to curve upward, which could signal a build-up in buying strength.
⸻
🔹 MACD
• A bullish crossover is visible (MACD line crossing above the signal line).
• Histogram turning positive = early bullish signal.
⸻
🔹 Summary & Trade Scenarios
✅ Bullish Scenario:
• If price breaks above 1.1077 with strong volume, it may target 1.15 or higher.
• Confirmation needed: candle close above D zone (1.1077) with volume support.
❌ Bearish Scenario:
• If price retests 1.1077 and fails, it might reverse toward support around 1.00 or even 0.95.
• Watch for bearish divergence or rejection candles near D.
⸻
🎯 Suggested Strategy:
• Long setup: If price breaks and holds above 1.108, target 1.15, stop-loss below 1.05
• Short setup (more conservative): If price rejects from 1.1077, consider short with target 1.00

Ethena · Millions Overnight? It Can Be DoneEthena is starting its 2025 bullish cycle with three full green candles. The current week has the highest volume since the first week of trading in April 2024. Normally the first week of trading tends to produce the highest volume. ENAUSDT is matching those days now and market conditions are so much better in 2025 compared to 2024.
The entire bullish period last year lasted less than two months. That's it. This wasn't an uptrend nor a bull market, it was more like a bullish jump. A momentary event. ENAUSDT right now is entering the 2025/26 bull market. Growth can be sustained for a period of 6 months or longer. Sometimes a bull market trend can last 8 months, 12 months, or even 16 months or longer. We have many examples across the market.
This week Ethena is trading above EMA55 weekly for the first time ever. The bullish bias is confirmed.
When I saw this pair it was already moving, not the bottom catch that I like and go for and yet, I still went ahead on it because it is still early when you consider the bigger picture; practice what you preach.
We missed the bottom but it is still early, there is plenty of room available for growth. Trading is easy when the market is approached with the right mentality, with a simple working plan. Buy and hold. Watch how the market will take care of the rest.
Just deposit and continue to invest, as much as you can. Continue to add to each position you like and grow; let it grow. Check back every 3 weeks, every 1-2 months; watch your money grow. It is truly that simple. Timing is very important for this strategy and the best timing is now. Right now we are on the verge of a major advance, no need to wait. You can buy today and start earning within days.
A few months back, we had to wait for months. A few weeks back, we had to wait for weeks. Entering the market now, the wait is short but patience is key.
It will go higher than what is shown on the chart. This publication is to alert you of a great timing, be ready to wait. Make sure to do your own planning. The risk is minimum when trading spot. The worst case scenario is a long wait. If things go right; enter green, stay green and profits-capital grow.
Success can be achieved but the hard part is being around now, when prices are low. It is easy to be around when there is hype and everything is 1,000% up. But can you beat the impulse to sell when the right choice is to buy? Can you take action now and go ahead?
If you are reading this now, you are in the right track but for many people it is not that easy, they are allergic to low prices and they won't be reading this until it is too late. 90% of the people will only become aware of these opportunities that I am showing you daily when it is too late.
That's ok. We use the experience to learn. When I first started I went through the same process. The euphoria got my attention and when I became aware of the market everything was already high up. We tend to join at the market top. But then we go through the entire cycle, the market is here to stay. We get to buy the bottom, we gain experience and in the end we can always win if we never give up. Persistence and consistency, be ready to hold.
If you can hold your altcoins when prices are low, you will reap the rewards at the time of the bull run. Millions to be made overnight. Years of preparation, but it can be done.
Namaste.

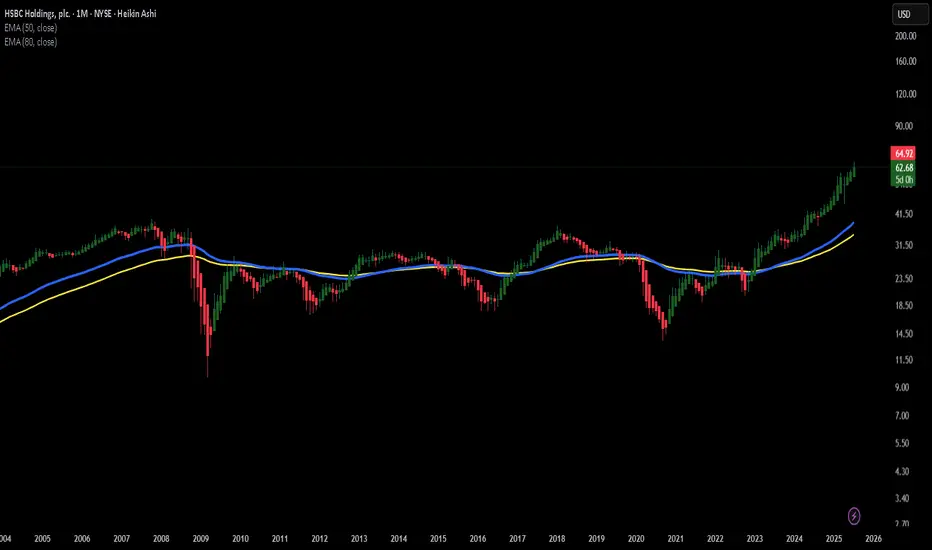
HSBC – Big Bank EnergyHSBC. The name alone sounds like it should be engraved in stone above a massive marble doorway somewhere in London, guarded by two lions in tuxedos. It’s one of those banks that’s been around forever – the kind of institution that probably has an emergency plan for a meteor strike… and a tea protocol for after.
And yet, when I look at the chart, I don’t just see a slow-moving financial giant. I see a potentially elegant bulldozer gently carving its way upward. Recent price action has been forming what looks like a series of higher lows, and we might just be watching a classic "big-bank-breakout" in slow motion.
From a chart perspective:
Price has been flirting with key resistance, perhaps like a banker flirts with risk – cautiously, from a safe distance, and only with proper documentation. But if momentum keeps building, it might finally stop sipping tea and actually make a move. Possibly upward. Possibly politely.
There’s no guarantee, of course. This isn’t a prediction – more like the market equivalent of a raised eyebrow and a curious “hmm.” I’ll be keeping an eye on HSBC to see if this old titan is ready to shake off the pinstripes and surprise us all.
A lighthearted market musing, not financial advice!
EURNZD ShortAfter a recent Market Structure Shift (MSS) signaling a bearish direction, I'm looking to short at 1.95692. The supply zone aligns perfectly with the 61.8% retracement level, and there's a potential liquidity/inducement level forming, adding confluence to the trade.

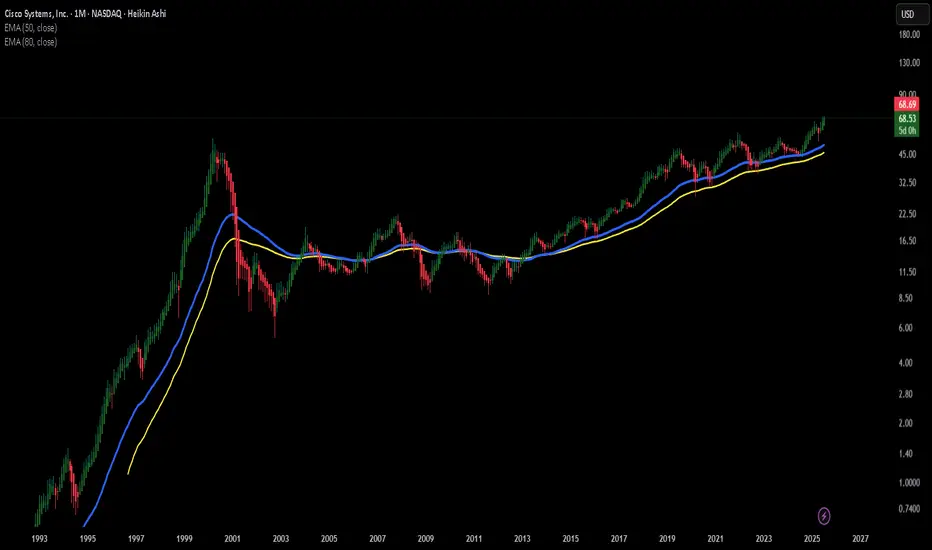
CSCO – Cisco’s Not Done Dancing Yet!
When I look at CSCO, I get the feeling that this old-school tech legend still has some rhythm left in its step. It’s like that uncle at the family wedding who’s been around the block but somehow still manages to pull off a surprisingly smooth move on the dance floor.
It may not be the flashiest stock on the NASDAQ, but there’s something about the way it moves – slow, steady, confident – that makes me think it might just be preparing for another swing to the upside.
From a chart perspective:
Recently, CSCO has been respecting a rising trendline and forming a sequence of higher lows – a classic sign of underlying strength. The price is now approaching a zone that has previously acted as resistance. If momentum builds, this level could turn into a launchpad. Of course, the market doesn’t always follow the script, but the setup looks promising from where I stand.
No predictions, no guarantees – just one trader’s interpretation of the chart. If Cisco keeps moving like this, I’ll be following the rhythm with curiosity (and maybe a fresh cup of coffee).
A lighthearted market musing, not financial advice!
USOIL BUY Smart Money + trend analysis expecting bullish Smart Money + Elliott Wave analysis expecting bullish move after corrective wave (C) completes at demand zone with Order Block, FVG, and liquidity sweep confluence

NZDCAD Long Now!📌 Instrument & Timeframe
NZD/CAD – 4H timeframe
Overall trend across multiple timeframes is noted as bullish (W, D, 12H, 6H, 4H all bullish).
📈 Market Structure
Price previously moved within a descending channel (drawn by two black trendlines) but has broken out to the upside.
After the breakout, price retraced back near a key area (just above the 200 EMA / red line) and is forming a smaller bull flag or descending wedge, indicating a potential continuation.
🔥 Area of Interest
Weekly AOI (Area of Interest) marked around 0.8180 – 0.8200 zone has acted as strong support.
Price reacted bullishly from that AOI, confirming buyers stepped in.
✅ Trade Bias
All higher timeframes (W, D, 12H, 6H, 4H) are bullish, so the bias is long.

EUR/JPY is Approaching a Key Supply Zone, Possible ShortWe initially anticipated a reversal around the 173.000 supply zone. It’s important to note that the Bank of Japan is currently facing a serious issue in the bond market — there have been several sessions with no bids for Japanese government debt. This is a troubling development and likely means the central bank will step in to purchase bonds soon.
That said, price closed above the 173.000 level on Friday, signaling further bullish momentum. The next key area of interest is the 175.000 level — a significant supply zone we are monitoring closely. If price reacts and pulls back from this level, we’ll be analyzing the yen across other major pairs, as well as keeping a close eye on the euro.

GBP/USD Holds Trendline Support as USD Shows StrengthThe US dollar showed some strength against the British pound during Thursday and Friday session, reflecting overall USD resilience.
Despite the prevailing uptrend, it's possible that GBP/USD may begin to consolidate, given how extended the pound's bullish run has been.
Currently, price is holding above a rising trendline, with additional support near the 1.3350 level. That trendline could play a key role if price pulls back further.
This pair often acts as a gauge for broader USD strength, considering the pound's relative strength. A decisive break above the 1.3600 level could open the door for a move toward 1.3750 in the sessions ahead.

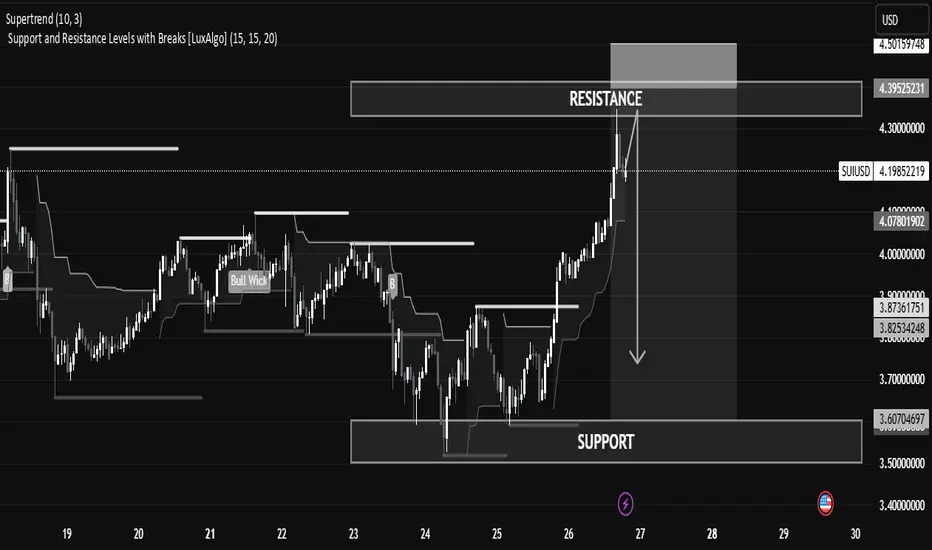
SUI/USD Technical Analysis – Potential Reversal Zone IdentifiedSUI/USD Technical Analysis – Potential Reversal Zone Identified
The current SUI/USD price action shows a strong bullish impulse reaching into a well-defined resistance zone, suggesting a potential pullback or reversal in the short term.
🔍 Key Levels
Resistance Zone: Between 4.30 – 4.39 USD, currently being tested after a strong bullish run. This is a historical supply area where price previously reversed.
Support Zone: Found between 3.60 – 3.70 USD, where price consolidated and accumulated before initiating the current rally.
Current Price: 4.2044 USD, slightly below the resistance zone, showing early signs of rejection.
📊 Technical Indicators & Structure
Supertrend (10,3): Bullish signal still active, suggesting trend strength, though traders should be cautious near resistance.
Break of Structure (BoS): Clean upward breaks suggest buyer dominance, but profit booking or sell-side liquidity may emerge near resistance.
Volume & Momentum: Impulse candles show strength, but volume tapering near resistance could indicate exhaustion.
📘 Educational Perspective
This setup highlights the importance of trading within key zones:
Buying at support, where demand is strong.
Monitoring resistance for signs of exhaustion or reversal patterns like wicks, doji, or bearish engulfing.
Risk Management Tip: In such cases, aggressive traders might short from resistance with tight stops, while conservative traders wait for confirmation (e.g., break and retest of the support or resistance).