GBP/USD Holds Trendline Support as USD Shows StrengthThe US dollar showed some strength against the British pound during Thursday and Friday session, reflecting overall USD resilience.
Despite the prevailing uptrend, it's possible that GBP/USD may begin to consolidate, given how extended the pound's bullish run has been.
Currently, price is holding above a rising trendline, with additional support near the 1.3350 level. That trendline could play a key role if price pulls back further.
This pair often acts as a gauge for broader USD strength, considering the pound's relative strength. A decisive break above the 1.3600 level could open the door for a move toward 1.3750 in the sessions ahead.
Trend Analysis

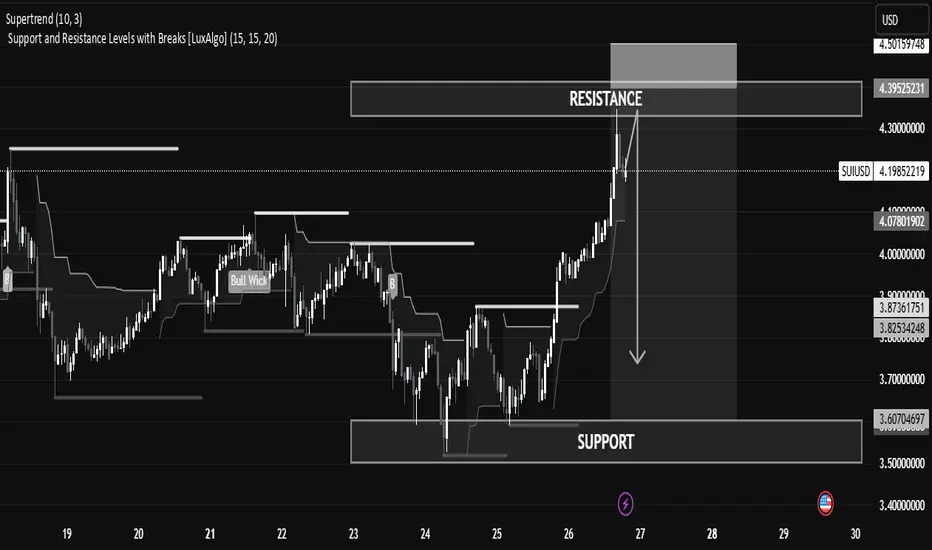
SUI/USD Technical Analysis – Potential Reversal Zone IdentifiedSUI/USD Technical Analysis – Potential Reversal Zone Identified
The current SUI/USD price action shows a strong bullish impulse reaching into a well-defined resistance zone, suggesting a potential pullback or reversal in the short term.
🔍 Key Levels
Resistance Zone: Between 4.30 – 4.39 USD, currently being tested after a strong bullish run. This is a historical supply area where price previously reversed.
Support Zone: Found between 3.60 – 3.70 USD, where price consolidated and accumulated before initiating the current rally.
Current Price: 4.2044 USD, slightly below the resistance zone, showing early signs of rejection.
📊 Technical Indicators & Structure
Supertrend (10,3): Bullish signal still active, suggesting trend strength, though traders should be cautious near resistance.
Break of Structure (BoS): Clean upward breaks suggest buyer dominance, but profit booking or sell-side liquidity may emerge near resistance.
Volume & Momentum: Impulse candles show strength, but volume tapering near resistance could indicate exhaustion.
📘 Educational Perspective
This setup highlights the importance of trading within key zones:
Buying at support, where demand is strong.
Monitoring resistance for signs of exhaustion or reversal patterns like wicks, doji, or bearish engulfing.
Risk Management Tip: In such cases, aggressive traders might short from resistance with tight stops, while conservative traders wait for confirmation (e.g., break and retest of the support or resistance).
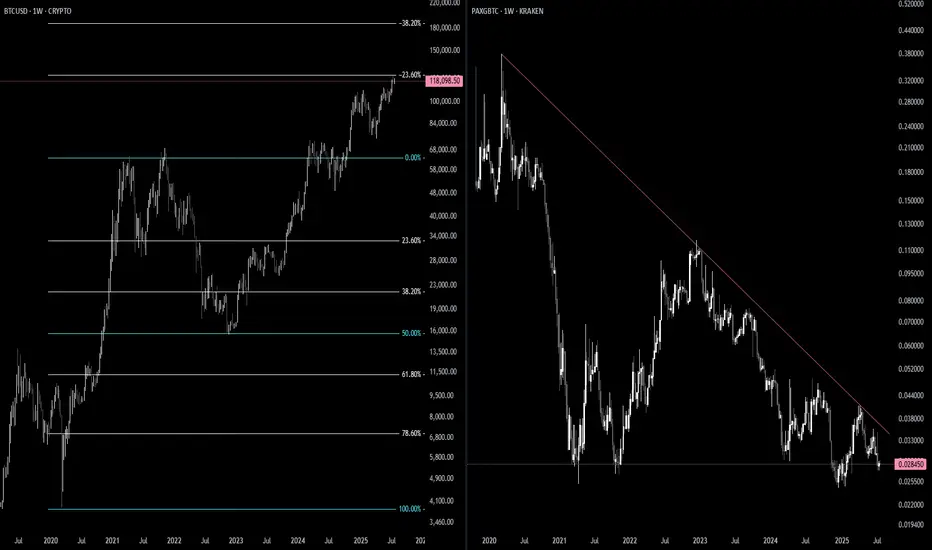
BTC / GOLD 2.0Here is another more zoomed out view of the inverse relationship of BTC to the PAXGold / BTC ratio. This is beautiful and perfect. One can see how they are practically mirrored opposite images of each other. Higher. SOON.

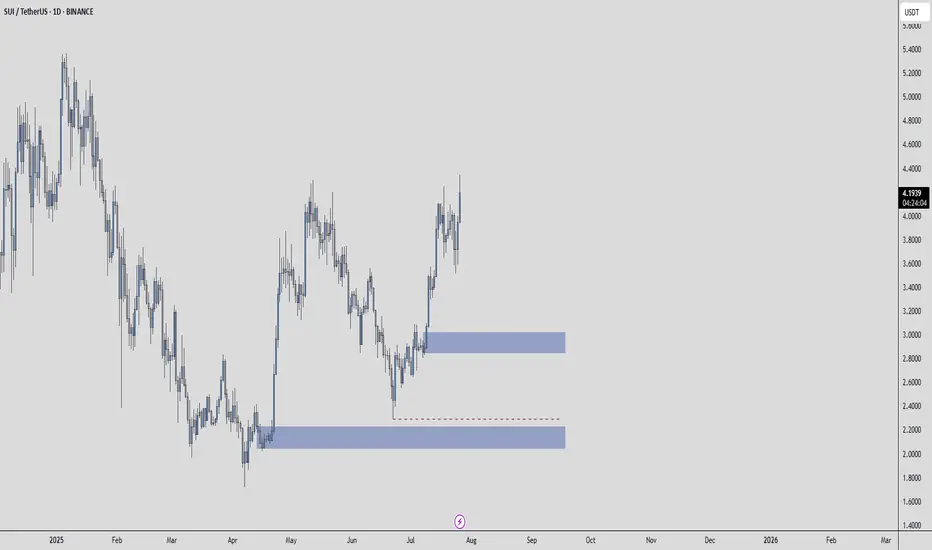
SUIUSDT – A Setup Worth WatchingThe blue box isn't just a zone, it’s a place where value and timing intersect.
🟦 Context
If price enters this area with control:
It aligns with past volume cluster support
A clean 1H break and confirmation may unlock high R:R potential
Structure + patience = confidence
📌 Execution Plan
🧭 No need to predict.
Just observe:
✅ Does the blue box hold with absorption or slowdown?
✅ Does CDV remain constructive?
✅ Does the 1H chart break and confirm direction?
If yes, there’s asymmetry on your side.
And that’s when smart trades happen.
"It’s not about being early. It’s about being right when it matters."
— And that starts with a prepared eye and a defined plan.
📌I keep my charts clean and simple because I believe clarity leads to better decisions.
📌My approach is built on years of experience and a solid track record. I don’t claim to know it all but I’m confident in my ability to spot high-probability setups.
📌If you would like to learn how to use the heatmap, cumulative volume delta and volume footprint techniques that I use below to determine very accurate demand regions, you can send me a private message. I help anyone who wants it completely free of charge.
🔑I have a long list of my proven technique below:
🎯 ZENUSDT.P: Patience & Profitability | %230 Reaction from the Sniper Entry
🐶 DOGEUSDT.P: Next Move
🎨 RENDERUSDT.P: Opportunity of the Month
💎 ETHUSDT.P: Where to Retrace
🟢 BNBUSDT.P: Potential Surge
📊 BTC Dominance: Reaction Zone
🌊 WAVESUSDT.P: Demand Zone Potential
🟣 UNIUSDT.P: Long-Term Trade
🔵 XRPUSDT.P: Entry Zones
🔗 LINKUSDT.P: Follow The River
📈 BTCUSDT.P: Two Key Demand Zones
🟩 POLUSDT: Bullish Momentum
🌟 PENDLEUSDT.P: Where Opportunity Meets Precision
🔥 BTCUSDT.P: Liquidation of Highly Leveraged Longs
🌊 SOLUSDT.P: SOL's Dip - Your Opportunity
🐸 1000PEPEUSDT.P: Prime Bounce Zone Unlocked
🚀 ETHUSDT.P: Set to Explode - Don't Miss This Game Changer
🤖 IQUSDT: Smart Plan
⚡️ PONDUSDT: A Trade Not Taken Is Better Than a Losing One
💼 STMXUSDT: 2 Buying Areas
🐢 TURBOUSDT: Buy Zones and Buyer Presence
🌍 ICPUSDT.P: Massive Upside Potential | Check the Trade Update For Seeing Results
🟠 IDEXUSDT: Spot Buy Area | %26 Profit if You Trade with MSB
📌 USUALUSDT: Buyers Are Active + %70 Profit in Total
🌟 FORTHUSDT: Sniper Entry +%26 Reaction
🐳 QKCUSDT: Sniper Entry +%57 Reaction
📊 BTC.D: Retest of Key Area Highly Likely
📊 XNOUSDT %80 Reaction with a Simple Blue Box!
📊 BELUSDT Amazing %120 Reaction!
📊 Simple Red Box, Extraordinary Results
📊 TIAUSDT | Still No Buyers—Maintaining a Bearish Outlook
📊 OGNUSDT | One of Today’s Highest Volume Gainers – +32.44%
📊 TRXUSDT - I Do My Thing Again
📊 FLOKIUSDT - +%100 From Blue Box!
📊 SFP/USDT - Perfect Entry %80 Profit!
📊 AAVEUSDT - WE DID IT AGAIN!
I stopped adding to the list because it's kinda tiring to add 5-10 charts in every move but you can check my profile and see that it goes on..
ETHUSD Long Setup: Targeting $4,000 After Bullish Reversal from ETH just swept the previous lows near $3,650–$3,700, clearing liquidity and flipping that zone into fresh support. This classic price action move often precedes expansion, and ETH looks primed for a continuation toward $4,000 in the coming sessions.
🧠 Technical Analysis
Previous Highs Swept: ETH took out the prior highs around $3,650–$3,700, trapping late shorts and grabbing liquidity.
Break of Structure: We've seen a clear bullish market structure form on the 4H and daily TFs, with higher highs and higher lows intact.
Support Zones:
$3,650–$3,700 (former resistance, now flipped support)
$3,550 (consolidation base before breakout)
Resistance Zones:
$3,950–$4,000 (psychological level + previous 2024 highs)
$4,100+ (weekly imbalance and potential extension zone)
Now that ETH has cleared short-term liquidity and confirmed demand on the retest, the path of least resistance appears to be up.
🔍 Fundamental Outlook
ETH ETF Narrative: Market anticipation for spot ETH ETF approval is heating up, boosting demand and institutional interest.
Reduced Sell Pressure: With the Shanghai upgrade long behind us, staking continues to increase, reducing circulating supply.
Macro Tailwinds: Risk-on sentiment in the broader market is aiding crypto momentum, especially for large-cap assets like ETH.
🎯 Target: $4,000
📉 Invalidated Below: $3,550 (if reclaimed by bears, invalidates bullish thesis)

ETH to $3700 Before a Major Bounce?Ethereum has been showing signs of exhaustion after its recent rally. I'm watching the $3700 level closely — it's a key support zone that has acted as both resistance and support in the past.
🟦 If ETH pulls back to this area, I expect it to find strong buying interest, potentially leading to a significant bounce and continuation of the bullish trend.
📌 Scenario I'm Watching:
🔻 Pullback to the $3700 support zone
📉 Shakeout or stop hunt below previous lows
💚 Followed by a strong bullish reversal — possible move toward $4000+
Why $3700?
Confluence of previous highs/lows
Psychological round number
Potential liquidity pocket
Not Financial Advice!
This is a scenario I'm tracking, not a guarantee. As always, wait for confirmation (e.g. bullish engulfing, RSI divergence, volume spike) before jumping in.
📉 If $3700 fails decisively, I'll reassess — next support likely around $3550–3600.

REDUSDT – Too Late, or One More Chance?It might sound optimistic to expect another clean entry…
But if you’ve followed this market long enough,
you know RED has surprised before — especially when few are watching.
🟦 Blue Box Logic
This zone isn’t fantasy.
It’s drawn based on:
Volume profile imbalances
Areas where CDV has previously shifted early
Past zones where the footprint showed aggressive sellers losing control
🎯 Execution Plan
If RED offers another test of the box:
✅ I’ll watch absorption on footprint
✅ Confirm with CDV stability or rise
✅ Step in only if structure supports the idea
No emotion. No chasing.
📌I keep my charts clean and simple because I believe clarity leads to better decisions.
📌My approach is built on years of experience and a solid track record. I don’t claim to know it all but I’m confident in my ability to spot high-probability setups.
📌If you would like to learn how to use the heatmap, cumulative volume delta and volume footprint techniques that I use below to determine very accurate demand regions, you can send me a private message. I help anyone who wants it completely free of charge.
🔑I have a long list of my proven technique below:
🎯 ZENUSDT.P: Patience & Profitability | %230 Reaction from the Sniper Entry
🐶 DOGEUSDT.P: Next Move
🎨 RENDERUSDT.P: Opportunity of the Month
💎 ETHUSDT.P: Where to Retrace
🟢 BNBUSDT.P: Potential Surge
📊 BTC Dominance: Reaction Zone
🌊 WAVESUSDT.P: Demand Zone Potential
🟣 UNIUSDT.P: Long-Term Trade
🔵 XRPUSDT.P: Entry Zones
🔗 LINKUSDT.P: Follow The River
📈 BTCUSDT.P: Two Key Demand Zones
🟩 POLUSDT: Bullish Momentum
🌟 PENDLEUSDT.P: Where Opportunity Meets Precision
🔥 BTCUSDT.P: Liquidation of Highly Leveraged Longs
🌊 SOLUSDT.P: SOL's Dip - Your Opportunity
🐸 1000PEPEUSDT.P: Prime Bounce Zone Unlocked
🚀 ETHUSDT.P: Set to Explode - Don't Miss This Game Changer
🤖 IQUSDT: Smart Plan
⚡️ PONDUSDT: A Trade Not Taken Is Better Than a Losing One
💼 STMXUSDT: 2 Buying Areas
🐢 TURBOUSDT: Buy Zones and Buyer Presence
🌍 ICPUSDT.P: Massive Upside Potential | Check the Trade Update For Seeing Results
🟠 IDEXUSDT: Spot Buy Area | %26 Profit if You Trade with MSB
📌 USUALUSDT: Buyers Are Active + %70 Profit in Total
🌟 FORTHUSDT: Sniper Entry +%26 Reaction
🐳 QKCUSDT: Sniper Entry +%57 Reaction
📊 BTC.D: Retest of Key Area Highly Likely
📊 XNOUSDT %80 Reaction with a Simple Blue Box!
📊 BELUSDT Amazing %120 Reaction!
📊 Simple Red Box, Extraordinary Results
📊 TIAUSDT | Still No Buyers—Maintaining a Bearish Outlook
📊 OGNUSDT | One of Today’s Highest Volume Gainers – +32.44%
📊 TRXUSDT - I Do My Thing Again
📊 FLOKIUSDT - +%100 From Blue Box!
📊 SFP/USDT - Perfect Entry %80 Profit!
📊 AAVEUSDT - WE DID IT AGAIN!
I stopped adding to the list because it's kinda tiring to add 5-10 charts in every move but you can check my profile and see that it goes on..

BIFIUSDT – Gone Train or Smart Setup?Some may think the train has left.
But when you know how to read volume profile, CDV, and footprint,
you start to see what others overlook.
🔵 The Blue Box
This zone isn’t just a chart shape,
It’s where value meets probability.
Volume profile shows a clean low-volume pocket, a common magnet for re-tests.
Footprint reveals early signs of absorption, sellers active, but not in control.
CDV isn’t breaking down, it’s coiling, not collapsing.
🎯 The Plan
If price returns to the blue box:
✅ I’ll look for fresh passive buy pressure
✅ CDV support or divergence
✅ A clean structure reclaim to confirm strength
When those align, I act, not because it’s emotional, but because it’s structured.
📌I keep my charts clean and simple because I believe clarity leads to better decisions.
📌My approach is built on years of experience and a solid track record. I don’t claim to know it all but I’m confident in my ability to spot high-probability setups.
📌If you would like to learn how to use the heatmap, cumulative volume delta and volume footprint techniques that I use below to determine very accurate demand regions, you can send me a private message. I help anyone who wants it completely free of charge.
🔑I have a long list of my proven technique below:
🎯 ZENUSDT.P: Patience & Profitability | %230 Reaction from the Sniper Entry
🐶 DOGEUSDT.P: Next Move
🎨 RENDERUSDT.P: Opportunity of the Month
💎 ETHUSDT.P: Where to Retrace
🟢 BNBUSDT.P: Potential Surge
📊 BTC Dominance: Reaction Zone
🌊 WAVESUSDT.P: Demand Zone Potential
🟣 UNIUSDT.P: Long-Term Trade
🔵 XRPUSDT.P: Entry Zones
🔗 LINKUSDT.P: Follow The River
📈 BTCUSDT.P: Two Key Demand Zones
🟩 POLUSDT: Bullish Momentum
🌟 PENDLEUSDT.P: Where Opportunity Meets Precision
🔥 BTCUSDT.P: Liquidation of Highly Leveraged Longs
🌊 SOLUSDT.P: SOL's Dip - Your Opportunity
🐸 1000PEPEUSDT.P: Prime Bounce Zone Unlocked
🚀 ETHUSDT.P: Set to Explode - Don't Miss This Game Changer
🤖 IQUSDT: Smart Plan
⚡️ PONDUSDT: A Trade Not Taken Is Better Than a Losing One
💼 STMXUSDT: 2 Buying Areas
🐢 TURBOUSDT: Buy Zones and Buyer Presence
🌍 ICPUSDT.P: Massive Upside Potential | Check the Trade Update For Seeing Results
🟠 IDEXUSDT: Spot Buy Area | %26 Profit if You Trade with MSB
📌 USUALUSDT: Buyers Are Active + %70 Profit in Total
🌟 FORTHUSDT: Sniper Entry +%26 Reaction
🐳 QKCUSDT: Sniper Entry +%57 Reaction
📊 BTC.D: Retest of Key Area Highly Likely
📊 XNOUSDT %80 Reaction with a Simple Blue Box!
📊 BELUSDT Amazing %120 Reaction!
📊 Simple Red Box, Extraordinary Results
📊 TIAUSDT | Still No Buyers—Maintaining a Bearish Outlook
📊 OGNUSDT | One of Today’s Highest Volume Gainers – +32.44%
📊 TRXUSDT - I Do My Thing Again
📊 FLOKIUSDT - +%100 From Blue Box!
📊 SFP/USDT - Perfect Entry %80 Profit!
📊 AAVEUSDT - WE DID IT AGAIN!
I stopped adding to the list because it's kinda tiring to add 5-10 charts in every move but you can check my profile and see that it goes on..

AAVE Long The daily is currently making HH / HL testing the daily 50 ema and ascending trend line
The 1h was a perfect entry, ascending triangle break out and re/test of the 1h 50 ema, fib levels and making a higher low

Long term Bitcoin view: the path to $100kI think Bitcoin will make a correction in the short run. The next target price can be $42k.
However I predict further gains in price in the mid run. The target of $100k may be achieved then. Though it is a far stretched number, I still expect a price move to that level.
If fail, we can expect a complex correction for the next 2-3 years. Final long term target will be above $100k.
#BTCUSDTP

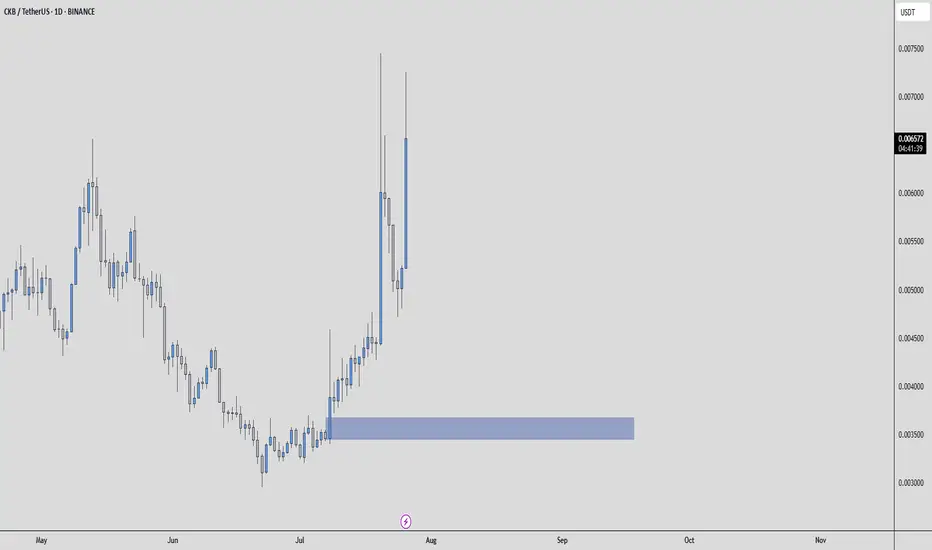
CKBUSDT – Still Time to Catch the Move?Some say the move is over.
But when you know what to look for, you see what others miss.
🧠 Smart Entry Zone
The blue box sits right below value on the volume profile, where weak hands panic and smart money prepares.
On the footprint, we’re seeing signs of absorption, aggressive sellers hitting into passive buyers.
CDV is stable, showing strength beneath the surface.
These are not guesses, they're signals built on experience and data.
🎯 What I’m Doing
If price returns to the blue box:
✅ I’ll wait for renewed absorption
✅ CDV must support the move
✅ Structure reclaim confirms the intent
When these align, I don't hesitate.
Because when you have a plan, you're not reacting, you’re executing.
📌I keep my charts clean and simple because I believe clarity leads to better decisions.
📌My approach is built on years of experience and a solid track record. I don’t claim to know it all but I’m confident in my ability to spot high-probability setups.
📌If you would like to learn how to use the heatmap, cumulative volume delta and volume footprint techniques that I use below to determine very accurate demand regions, you can send me a private message. I help anyone who wants it completely free of charge.
🔑I have a long list of my proven technique below:
🎯 ZENUSDT.P: Patience & Profitability | %230 Reaction from the Sniper Entry
🐶 DOGEUSDT.P: Next Move
🎨 RENDERUSDT.P: Opportunity of the Month
💎 ETHUSDT.P: Where to Retrace
🟢 BNBUSDT.P: Potential Surge
📊 BTC Dominance: Reaction Zone
🌊 WAVESUSDT.P: Demand Zone Potential
🟣 UNIUSDT.P: Long-Term Trade
🔵 XRPUSDT.P: Entry Zones
🔗 LINKUSDT.P: Follow The River
📈 BTCUSDT.P: Two Key Demand Zones
🟩 POLUSDT: Bullish Momentum
🌟 PENDLEUSDT.P: Where Opportunity Meets Precision
🔥 BTCUSDT.P: Liquidation of Highly Leveraged Longs
🌊 SOLUSDT.P: SOL's Dip - Your Opportunity
🐸 1000PEPEUSDT.P: Prime Bounce Zone Unlocked
🚀 ETHUSDT.P: Set to Explode - Don't Miss This Game Changer
🤖 IQUSDT: Smart Plan
⚡️ PONDUSDT: A Trade Not Taken Is Better Than a Losing One
💼 STMXUSDT: 2 Buying Areas
🐢 TURBOUSDT: Buy Zones and Buyer Presence
🌍 ICPUSDT.P: Massive Upside Potential | Check the Trade Update For Seeing Results
🟠 IDEXUSDT: Spot Buy Area | %26 Profit if You Trade with MSB
📌 USUALUSDT: Buyers Are Active + %70 Profit in Total
🌟 FORTHUSDT: Sniper Entry +%26 Reaction
🐳 QKCUSDT: Sniper Entry +%57 Reaction
📊 BTC.D: Retest of Key Area Highly Likely
📊 XNOUSDT %80 Reaction with a Simple Blue Box!
📊 BELUSDT Amazing %120 Reaction!
📊 Simple Red Box, Extraordinary Results
📊 TIAUSDT | Still No Buyers—Maintaining a Bearish Outlook
📊 OGNUSDT | One of Today’s Highest Volume Gainers – +32.44%
📊 TRXUSDT - I Do My Thing Again
📊 FLOKIUSDT - +%100 From Blue Box!
📊 SFP/USDT - Perfect Entry %80 Profit!
📊 AAVEUSDT - WE DID IT AGAIN!
I stopped adding to the list because it's kinda tiring to add 5-10 charts in every move but you can check my profile and see that it goes on..
MDT (Measurable Data Token) 25 million lowcapMDT (Measurable Data Token)
trading at $0.036
mcap 25 million
all time high $0.8
27x profit to ath
rsi = avg bullish
macd = avg
project info
Measurable Data Token (MDT) is a decentralized data exchange ecosystem connecting users, data providers, and data buyers and denominates the value of data.

The biggest cup&handle of all times: silver targets $50The data suggests a cup&handle:
Cup was between 1980-2011
Handle is still in progress and probably may finish by 2025 or earlier.
For the short run: a re-test of low re-accumulation range of $23 can be seen.
The next mid-term target will be $25.
Final target will be $50.

ETH - 4444 - 5000 + Hello Traders,
Using Fibs, Elliot Waves, Trend Regression Channels, and an Inverse H&S Patterns I show some possible ETH price targets and dates. Lets see how this plays out

CHILLGUY Rebound Zone, Targets in Sight!#chillguy
Price is still holding above the key trendline and support zone. Buyers have stepped in again from this level, and the chart shows a potential bounce setup.
If this area holds, CHILLGUY could continue upward.
Entry Zone: Around $0.066–$0.068
Stop Loss: Below $0.062
Targets:
Target 1: $0.072
Target 2: $0.075
Target 3: $0.080
Target 4: $0.086
DYOR, NFA
#Altseason2025


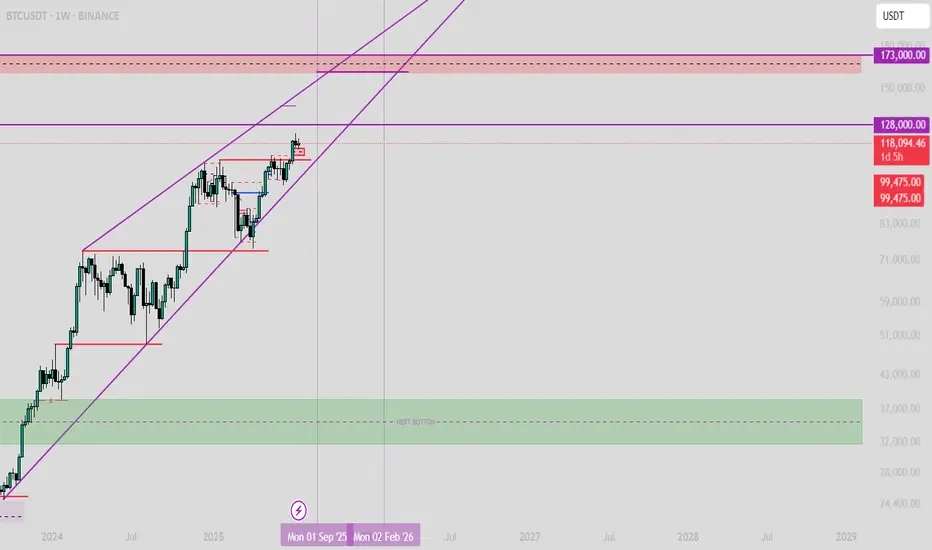
BTC - Prediction for the Final TOP AND the next BOTTOMAfter several analyses that I published on Trading View, I want to share my opinion on the Final Top and the next Bottom for Bitcoin!
The final Top will be between 160,000 and 174,000.
The next Bottom will be between 31,000 and 40,000. (Simply under 40,000).
This is not guaranteed, and it's just an analysis; it can happen or not, so be careful.
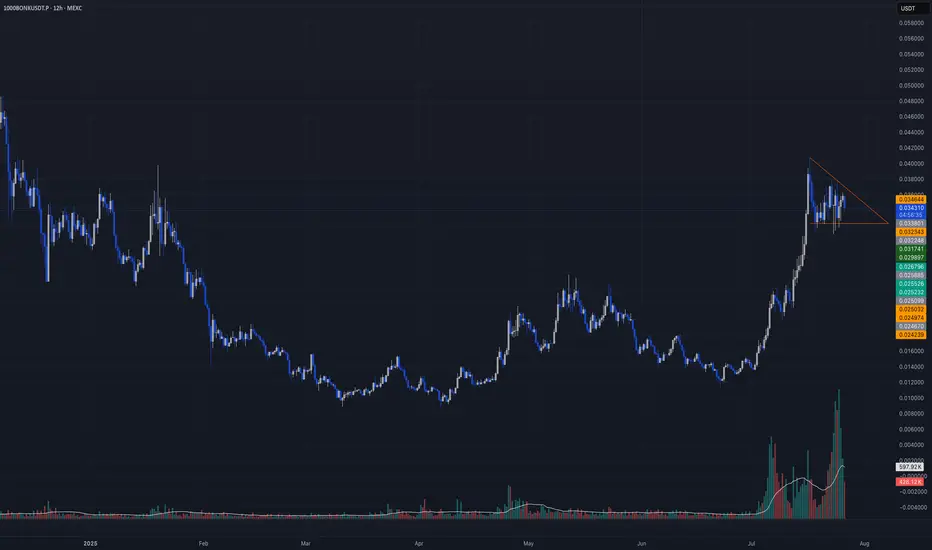
LONG Setup | Breakout or Retest Entry AheadTeam, I’m eyeing a solid continuation setup on 1000BONKUSDT.P. After a strong move up, price is currently consolidating in a textbook bullish pennant on the 12H timeframe. This is typically a continuation pattern, and all signs point to a potential breakout or a deeper retest before the next leg higher.
Momentum has cooled off a bit (as expected), and RSI is resetting — which is exactly what we want before a clean move.
🎯 My Plan (Two Entry Options):
1. Breakout Entry
• 🔹 Entry: 0.03780 – 0.03820 (wait for breakout candle close or strong impulse)
• 🎯 Targets:
• TP1: 0.04250
• TP2: 0.04900
• TP3: 0.06000
• 🛡️ Stop-loss: 0.03550 (just below the structure)
2. Retest Entry (More Conservative)
• 🔹 Entry: 0.03280 – 0.03340 (support zone from previous consolidation)
• 🎯 Same targets
• 🛡️ Stop-loss: 0.03150
🔍 Why I’m Taking This Trade:
• Clean bullish structure on all higher timeframes.
• Volume confirms accumulation; no signs of panic selling.
• RSI has room to climb again after a healthy reset.
• Market is holding strong above key support zones.
🧠 As always, manage your risk. I’ll be scaling in based on confirmation and watching BTC for correlation. This setup has potential for continuation — don’t rush, let the market come to you.
Stay sharp.
— Candle Craft
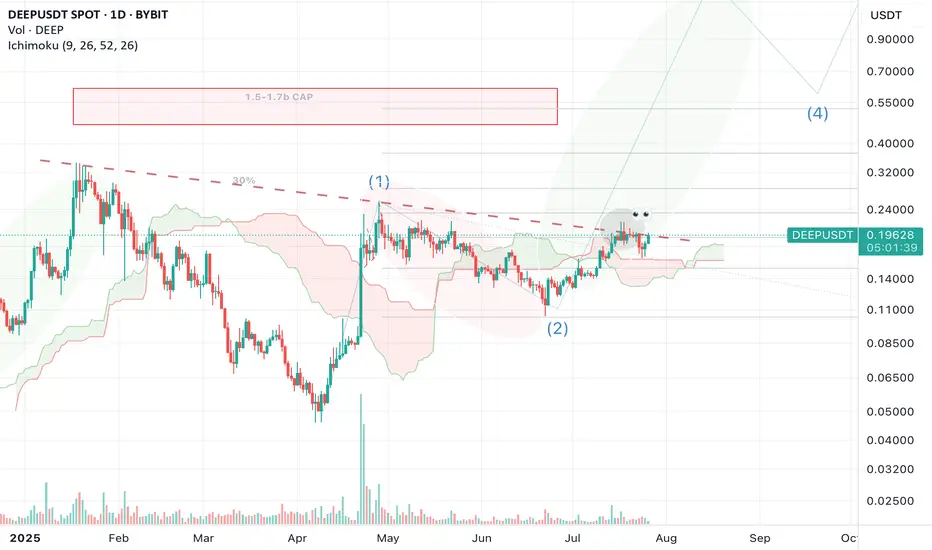
$DEEPIt's time to update the chart. It corrected for a few days, hit the Ichimoku Cloud support on the daily timeframe, and bounced back for an uptrend. If the market plays out well, I expect a nice pump. Let's see what happens!
Always DIOR ⚠
SoFi's Surge: Unveiling 2023 and What Lies Ahead in 2024Technical Analysis Overview
Current Price : $10.34, a 3.77% increase.
Weekly Trend : Showing a positive trend with a 5.35% increase over the last five days.
1-Month Trend : A significant increase of 51.96%, indicating strong bullish sentiment.
6-Month and Yearly Trends : A 17.04% increase over the last six months and a 124.51% increase year to date, highlighting a robust bullish trend.
Advanced Technical Indicators
Relative Strength Index (RSI) : 70.41 - Indicating that SOFI is nearing overbought territory, which could lead to a potential reversal or consolidation in the short term.
Moving Average Convergence Divergence (MACD) : 0.63 - Suggesting bullish momentum, indicating a strong buying trend.
Other Indicators : STOCH (83.28), STOCHRSI (84.02), ADX (37.09), Williams %R (-8.57), CCI (104.63), ATR (0.46), Ultimate Oscillator (54.76), and ROC (24.66) all contribute to a picture of current bullish momentum but with potential for short-term volatility or pullback.
Market Sentiment and External Factors
Market Capitalization : $9.904B USD.
Trading Volume Analysis : A high trading volume of 35,199,288, suggesting active market participation and interest in the stock.
Recent News Coverage Impacting SOFI
Bullish Outlook for 2024 : Analysts predict SOFI stock could continue its rally in the new year, benefiting from expected interest-rate cuts. A notable analyst has set a high price target of $14 for SOFI stock, implying significant upside potential ( InvestorPlace ).
Focus on Non-Lending Businesses : Analysts appreciate SoFi's shift towards non-lending businesses, improving earnings quality despite a higher-for-longer interest-rate policy.
Central Bank Policy Changes : Potential interest rate cuts in 2024 could benefit SoFi's lending business, as lower rates tend to spur borrowing and lending activity.
Conclusion
SOFI's stock shows strong bullish signs in the medium to long term, but the current overbought condition warrants caution for short-term traders.
The recent news and analyst predictions provide a positive outlook for 2024, making SOFI an interesting stock for both traders and long-term investors.

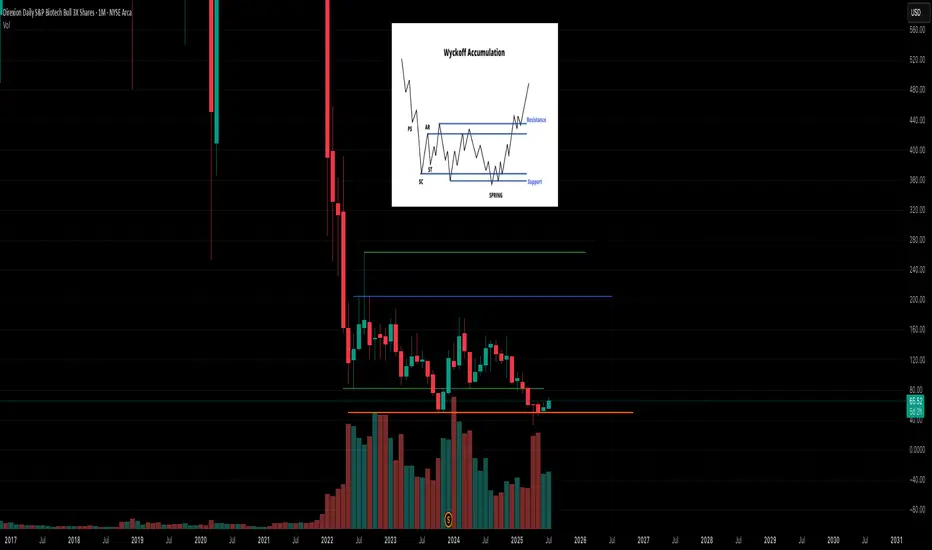
If you can hold for 2 years could be a nice entry around here haLooks to be in a very SLOW accumulation process. We will have a BIO-tech revolution it's inevitable; just make take years before it actually manifests in the sector. I have psoriasis and the should be a FKIN cure by now rofl. BS. AI will make it happen. MONTHLY CHARY
BTCUSD +$500 in the next few candles/sessionsBitcoin (BTCUSD) is showing strong bullish momentum, and current price action indicates a potential move upward by the next $500 in the short term.
