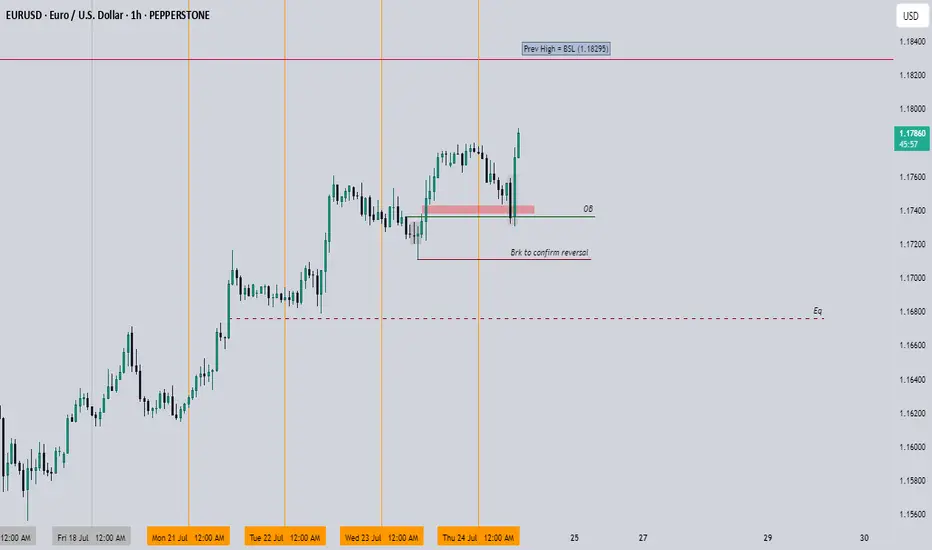
EURUSD Looking bullish in all areasI think now it is safe to say we know where EURUSD is heading to, I am looking for a sweep above the 1.18295 level
Trade Cautiously
Trend Analysis
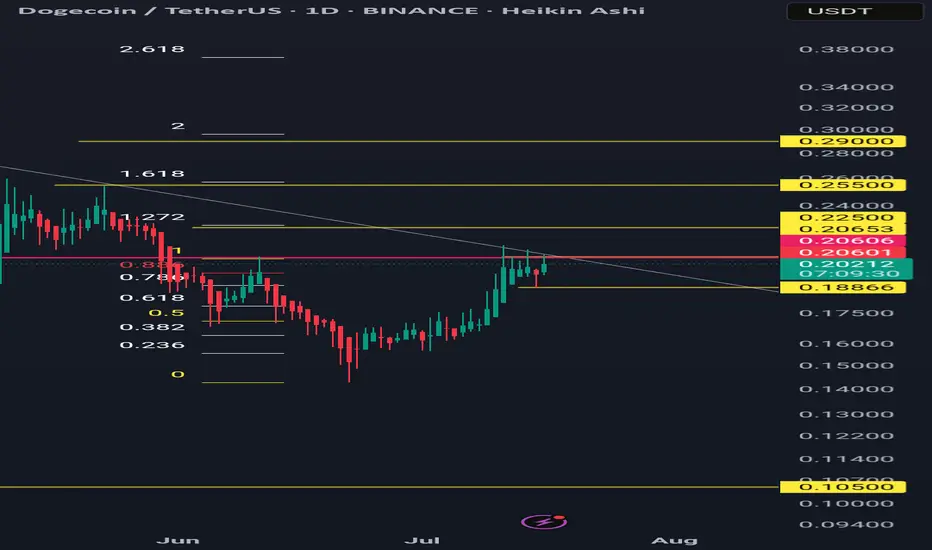
Dogeusdt bullish iH&S/cup&handle pattern in daily tfForming a bullish pattern and a close above 0.206 in daily time frame may activate the pattern.
Targets are 0.225, 0.255 and 0.29
Invalidation below 0.1886
ETH Dominance – Golden Cross, New Era?This is ETH Dominance on the Daily chart.
A golden cross just printed, and the last time we saw this, at similar levels, was February 2020. Back then, dominance climbed steadily, bouncing off the 200MA repeatedly.
Today, price is approaching the 0.236 Fib level, which could act as short-term resistance and send us back to retest the 200MA as support.
But unlike 2020, everything has changed:
– ETH is getting institutional support via ETF flows
– The SEC confirmed ETH is not a security
– The RWA narrative is gaining serious traction
That’s why this golden cross could mean more than just a signal, it may be the start of a much stronger structural uptrend.
My humble guess?
ETH Dominance continues climbing with the 200MA as support.
It won’t be a smooth ride, but the direction might be set.
Always take profits and manage risk.
Interaction is welcome.

EURUSD 60/15 Pullback LongOverall strong up trend. Now under consolidate phase, then pullback, looking for long.
Possible buy zones are marked, monitor when reaching buy zones.

EURUSD: Next Move Is Down! Short!
My dear friends,
Today we will analyse EURUSD together☺️
The price is near a wide key level
and the pair is approaching a significant decision level of 1.17658 Therefore, a strong bearish reaction here could determine the next move down.We will watch for a confirmation candle, and then target the next key level of 1.17506..Recommend Stop-loss is beyond the current level.
❤️Sending you lots of Love and Hugs❤️

Gold’s Wild Ride: A Trader’s Take on What’s NextHey Fellow Traders! 👋
Gold’s been an absolute beast this week, smashing through both buyers and sellers like it’s playing a high-stakes game of market whack-a-mole! 😅 After Wednesday’s wild moves and today’s follow-up, Gold’s keeping us all guessing.
Right now, I’m not locking in a long-term bias—Gold’s too unpredictable for that. But here’s the exciting part: I’m eyeing a short-term long opportunity. Why? The price just dipped into a 4H Fair Value Gap (FVG) and tagged a Breaker, setting up a potential bounce. 📈
My plan? I’m expecting Gold to sweep up the highlighted liquidity and charge toward the 4H Inversion Fair Value Gap (IFVG). Once it hits that zone, I’ll be glued to the charts, watching for its reaction to decide the next move. 🧐
As always, trade smart! Set your stops, size your positions wisely, and don’t let Gold’s volatility catch you off guard. Protect your capital first—always! 💡
What’s your take on Gold right now? Are you jumping on this setup or waiting for more confirmation? Drop your thoughts in the comments below, give this post a like, and follow for more updates! 👇 Let’s keep the trading convo going! 🔥
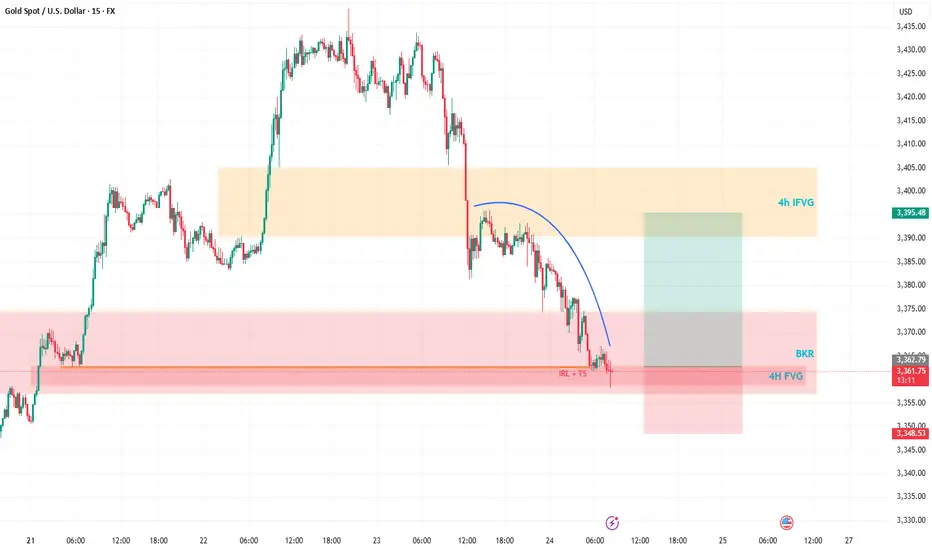
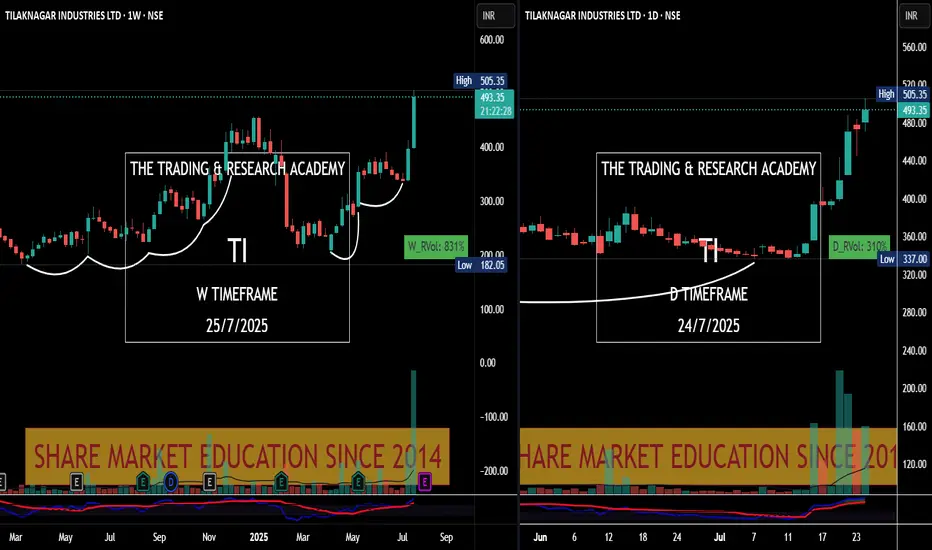
Chart Speaks- Tilak Nagar Ind
#Price leads the #News! Tilak Nagar Ind #tilaknagar see the chart v/s News.
News came yesterday, have a look at chart. Someone was accumulating it since long.
Chart Speaks
xauusdupdate on gold ,right now on the daily we are still looking forward on a break so waiting carefully for that monster push above the 3440 areas

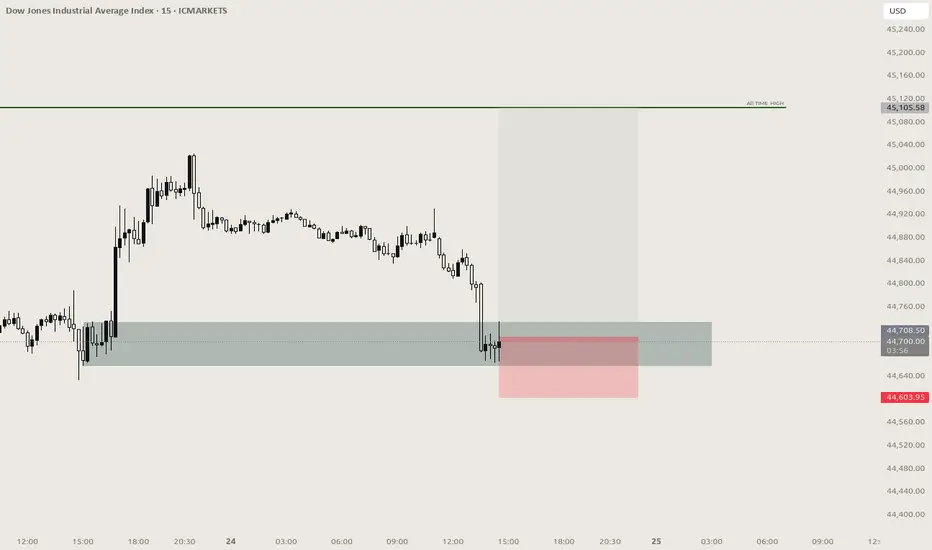
US30 ATH coming?Update to my last port wondering if I should add, what would you do in this situation?
GOLD: Target Is Down! Short!
My dear friends,
Today we will analyse GOLD together☺️
The recent price action suggests a shift in mid-term momentum. A break below the current local range around 3,359.59 will confirm the new direction downwards with the target being the next key level of 3,350.22.and a reconvened placement of a stop-loss beyond the range.
❤️Sending you lots of Love and Hugs❤️

What’s Next? 🚨 $FARTCOIN Cup & Handle Pattern Forming – What’s Next? 📈
$FARTCOIN has formed a bullish Cup & Handle pattern — but is it over?
❌ Not yet. $FARTCOIN hasn’t shown any strong bearish signals for now.
🔍 We’re watching two key green line levels below.
📉 If the price drops toward these zones, we may see buyers step back in — creating a potential entry, but only with confirmation.
✅ Stay patient — no rush to jump in without a setup. Let the chart guide us.

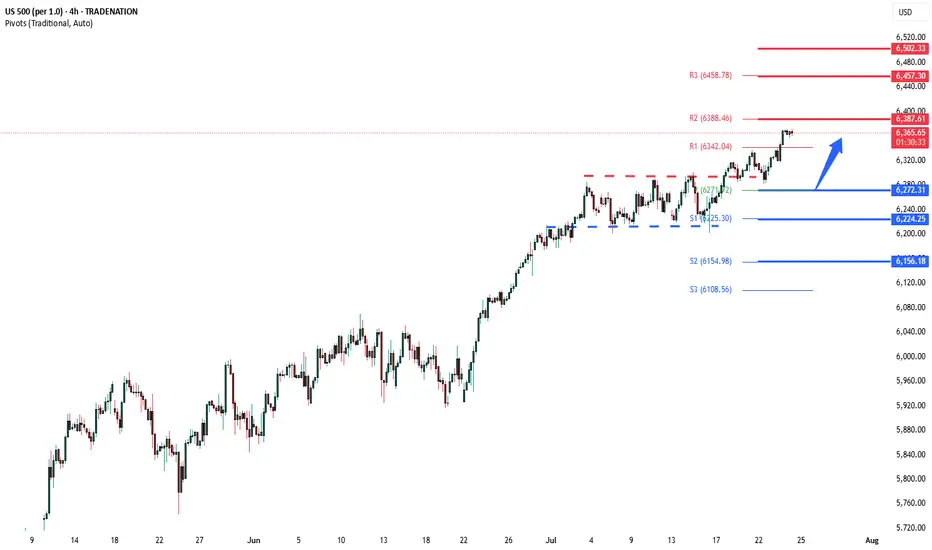
S&P500 push to new ATH? Key Developments:
AI Drives Earnings Momentum
Alphabet reported strong results, but flagged surging AI infrastructure costs, signaling increased capex ahead.
SK Hynix posted record earnings and committed to expanding AI-related investments, reinforcing the sector’s critical growth role.
Investor sentiment remains AI-positive, with capital rotation favoring tech and semiconductors despite margin compression risks.
Banking Sector Boosted by Tariff-Driven Volatility
Deutsche Bank’s FIC (Fixed Income & Currencies) trading revenue jumped 11% to €2.28B, its best Q2 since 2007, aided by global trade uncertainty.
BNP Paribas also beat earnings estimates, continuing the strong showing from European banks amid market volatility.
Trade & Tariff Watch
The EU and US are nearing a deal on a 15% standard tariff rate, potentially stabilizing trade flows and market pricing.
Trump’s broader reciprocal tariff push remains in focus, especially after the US-Japan deal. Investors are watching for signs of escalation or resolution with other partners like the EU and Canada.
Fed in the Political Spotlight
Trump visited the Fed’s construction site, criticizing costs and maintaining pressure on Chair Jerome Powell.
Speculation about Fed leadership changes and political interference is unsettling, though markets have largely shrugged this off for now.
Meanwhile, House Republicans are drafting a follow-up tax-and-spending plan, which could shape future fiscal policy and market expectations.
Conclusion: S&P 500 Trading Outlook
The S&P 500 remains buoyed by strong earnings, particularly from AI-linked sectors and financials, while geopolitical risks and tariff volatility are being absorbed as catalysts for trading profits rather than panic.
Bullish factors: Strong corporate earnings (Alphabet, SK Hynix, Deutsche Bank), potential trade de-escalation (EU-US tariff deal), and AI momentum.
Risks to monitor: Rising AI capex (impact on margins), political tension around the Fed, and tariff uncertainty.
Key Support and Resistance Levels
Resistance Level 1: 6387
Resistance Level 2: 6457
Resistance Level 3: 6502
Support Level 1: 6272
Support Level 2: 6224
Support Level 3: 6156
This communication is for informational purposes only and should not be viewed as any form of recommendation as to a particular course of action or as investment advice. It is not intended as an offer or solicitation for the purchase or sale of any financial instrument or as an official confirmation of any transaction. Opinions, estimates and assumptions expressed herein are made as of the date of this communication and are subject to change without notice. This communication has been prepared based upon information, including market prices, data and other information, believed to be reliable; however, Trade Nation does not warrant its completeness or accuracy. All market prices and market data contained in or attached to this communication are indicative and subject to change without notice.
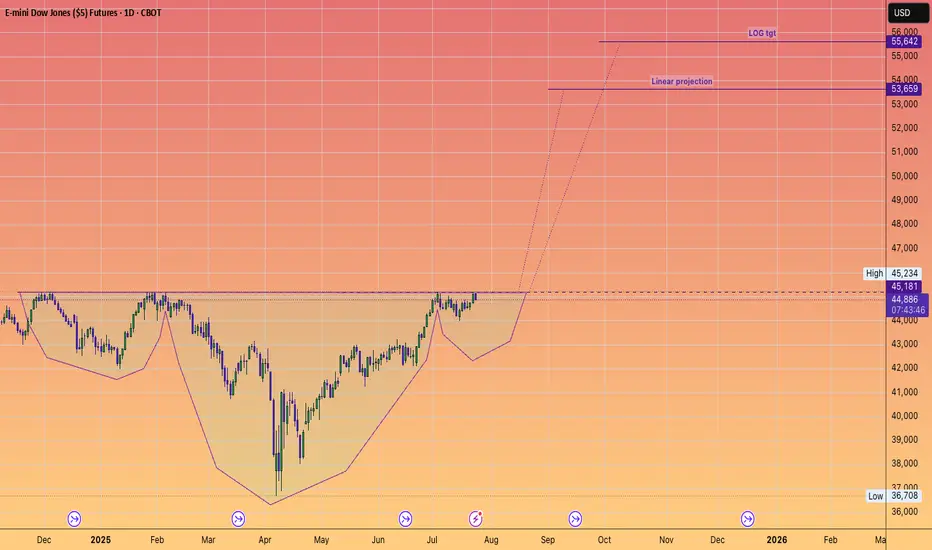
DOW JONES to 55,642#InverseHead&Shoulders
Projects record new highs.
Another stepping stone to our long held forecast of 64,000
Why?
Because AI will significantly contribute to an EXPANDING #GDP
Gold Analysis and Trading Strategy | July 24✅ Fundamental Analysis
🔹The European Union and the United States are reportedly close to reaching an agreement to standardize tariffs on goods exported to the U.S. at 15%, aiming to avoid a potential increase to 30% starting August 1. Modeled after the U.S.–Japan trade framework, this deal eases global trade tensions significantly, boosts risk sentiment in financial markets, and leads to a notable decline in safe-haven demand for gold.
✅ Technical Analysis
🔸On Wednesday, gold formed a bearish engulfing pattern, signaling a potential trend reversal. The price also broke below the 5-day moving average, suggesting weakening short-term momentum.
🔸4-Hour Chart: Wednesday’s decline broke below the middle Bollinger Band, confirming the start of a corrective structure. The current price action suggests a bearish consolidation, with a continued search for support likely.
🔸If the 3365–3360 support zone is broken, the downtrend may extend toward 3350.
🔴Resistance Zone : 3400–3405–3410
🟢Support Zone : 3365–3360–3350
✅ Trading Strategy Reference:
Today's gold short-term strategy remains selling on rebounds as the primary approach, and buying on dips as a secondary strategy, depending on whether the market continues the corrective trend seen since Wednesday.
🔻 Short Position Strategy:
🔰Consider entering short positions in batches if gold rebounds to the 3405–3408 area. Target: 3390–3380;If support breaks, the move may extend to 3370.
🔺 Long Position Strategy:
🔰Consider entering long positions in batches if gold pulls back to the 3365–3370 area. Target: 3380–3390;If resistance breaks, the move may extend to 3400.
🔥Trading Reminder: Trading strategies are time-sensitive, and market conditions can change rapidly. Please adjust your trading plan based on real-time market conditions. If you have any questions or need one-on-one guidance, feel free to contact me🤝

$TWT/USDT Breakout Confirmed.SEED_DONKEYDAN_MARKET_CAP:TWT just broke a major downtrend and retested the breakout zone around $0.7555–$0.7898, holding above the 100 SMA.
If this support holds, we could see a 25% move toward $0.9528. Bullish structure, momentum building.
DYOR, NFA

Today's US market focus is 3350
Gold prices continued their decline from the previous session on Thursday, July 24, slipping further below the 3,400 mark as trade tensions eased and risk sentiment rose. Gold's decline today means a second consecutive day of decline as investors turned their attention to more positive trade progress since yesterday. However, gold still received buying support earlier this week, breaking through $3,400 at one point. This round of gains tested key resistance levels on the gold daily chart, but in the end the bears held their ground.
Risk data interpretation!
Investors are currently waiting for U.S. Purchasing Managers Index (PMI) data for new trading instructions. If any PMI index falls below 50.0, indicating a contraction in economic activity in related industries, the dollar may face pressure and help gold prices rise.
The market will also pay close attention to developments surrounding the ongoing discord between U.S. President Trump and Federal Reserve Chairman Powell. The White House announced Trump's schedule, and Trump will visit the Federal Reserve at 4 p.m. Eastern Time on Thursday.
Views on the trend of gold!
The trend of gold is directly reversed from that of Monday and Tuesday this week. At the beginning of this week, gold rose slowly and continuously without giving a chance to retrace, while today it retreated continuously and did not give a rebound. Does it look familiar? The trend is bearish and I want to short but I can't do it. In fact, we are still bullish in the morning today, and the watershed is actually at the 3375 line. After the frequent breakouts in the European session, it means that the current bulls are suppressed again.
And the K-line on the hourly line is more obvious. There is no positive line in the continuous negative retracement, so the weakness will continue. After all, the Asian session is weak today, and the European session is also continuously weak. The current market has reached the 3363 line, which is actually not far from our second support of 3350. So the US session needs to focus on this position. If the US session can hold, there is still hope for a rebound. Otherwise, it will fall continuously today!
Gold: Long around 3350, defend 3340, and target the 3385-93 line
