XAUUSD Weekly July 2025 28 July - 1 Aug🧭 MARKET STRUCTURE OVERVIEW – H4
1. Major Trend: Bullish
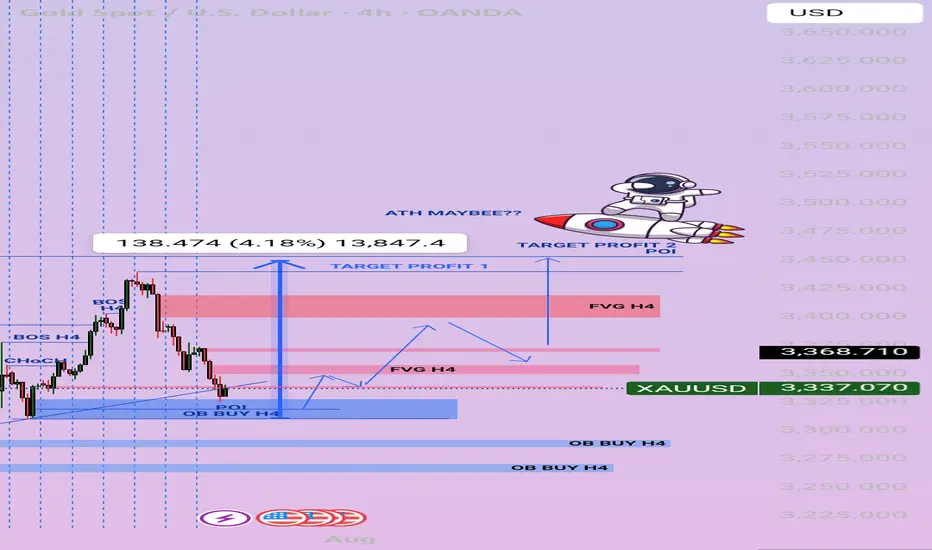
The overall trend remains bullish, with multiple Bullish Breaks of Structure (BOS) recorded during the upward move since early July.
A strong CHoCH followed by a solid Bullish BOS on H4 after the early July breakout confirms strong buyer intent.
---
2. Bearish BOS?
You're absolutely right — there are no significant Bearish BOS on H4 after the recent rally.
The current downward movement appears to be a retracement, not a structural break. No confirmation of bearish market structure yet.
---
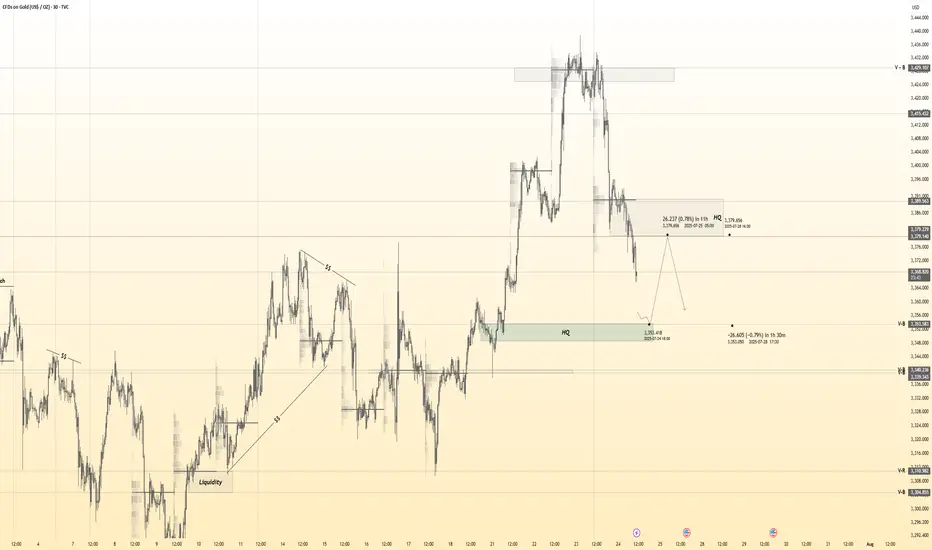
🔵 CURRENT ZONE: H4 OB BUY (Active POI)
Price is currently rejecting from the H4 OB BUY zone, which aligns with the ascending trendline confluence.
If the H4 candle closes with a strong rejection (e.g. bullish engulfing or pinbar), this would confirm a potential buy entry for the next bullish leg.
This OB BUY is the main POI for next week and represents a:
✅ Buy from Discount
✅ Entry in Uptrend Structure
✅ Confluence of OB + POI + Momentum
---
🟥 FVG & TP Structure
1. TP1 / Scaling Zone:
H4 Fair Value Gap (FVG) around 3368–3380 can serve as the first target.
2. Final TP / ATH Zone:
Upper FVG (3420+) near a previous POI could act as the final target or a potential ATH test zone if buyers push higher.
---
🚀 TRADING PLAN – NEXT WEEK (Still Valid)
✅ Structure is still bullish
✅ Current drop is a retracement to OB BUY
✅ No valid Bearish BOS detected
✅ Current POI + OB BUY zone = prime entry level
---
📌 ENTRY STRATEGY
Entry: Buy within the OB BUY H4 zone (around 3320–3340)
Confirmation: Wait for a strong H4 rejection candle
Stop Loss: Below OB H4 (~3310, or adjust to lower OB zone)
TP1: 3368–3380 (FVG zone)
TP2: 3420+ (Upper FVG / POI / ATH zone)
---
⚠️ Additional Notes
If price breaks below OB BUY H4 with a strong bearish candle, this setup becomes invalid.
Then, we shift focus to lower OB zones (3280 / 3250).
Be cautious of high-impact news (FOMC/NFP?) – price may spike before confirming direction.
---
🔥 FINAL VERDICT:
✅ Plan is highly valid
❌ No strong bearish structure in place
🔒 Current POI is a key sniper entry zone
Trend Analysis
HTF EURUSD PA REVIEWFeel free to provide any feedback.
It is important to note the dynamics between bearish and bullish range-initiation-mitigation-continuation.
Where one phase might be the initiation leg out of a bearish range, it can also be the point of mitigation of a previous bullish range.

IBM Rebound Trade - Buying the Pullback at Key ConfluenceSetup:
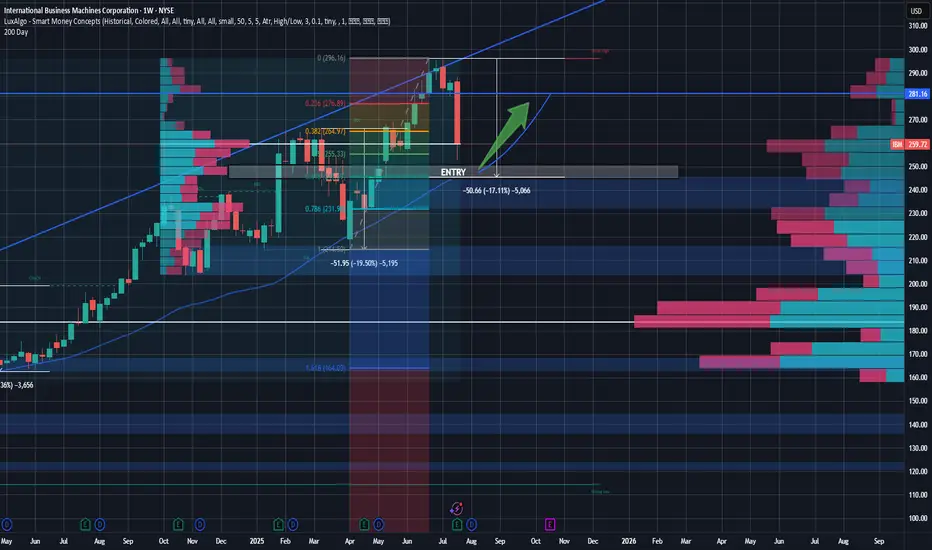
IBM is setting up for a potential high-conviction long entry around the $245 level, a price zone marked by multiple layers of technical confluence and volume-based support. Over the last 18 months, IBM has seen two notable pullbacks—both in the 17–20% range, often around earnings events. The current drawdown is consistent with this historical behavior and may represent an opportunity rather than a breakdown.
Technicals & Indicators
Volume Profile Support:
Using a volume profile anchored from January 2024, a clear volume shelf exists between $245 and $265.
A second profile anchored 10 months ago confirms heavy volume at $260 and $245, indicating high institutional activity and potential support zones.
200-Day Moving Average:
IBM has consistently respected its 200-day MA over the past two years. The MA is now converging at $245, adding dynamic trendline support.
Fibonacci Retracement:
Applying retracements from the April 2025 lows to the recent ~ $300 highs, the $245 level aligns with the 61.8% Fibonacci level, a key zone for potential reversals.
GAP Fill:
Looking for the recent earnings gap to close within the next 2 months, as we see new opportunities for tech companies and rising demand. This overreaction created a gap that should be filled as investors digest the macro strength and re-enter long positions in IBM. Gap close ~ $280 level.
Candles & Buying Pressure:
Recent daily volume after earnings suggests strong buying pressure with a hammer/doji candle forming on the day after earnings. Investors are already buying back into this name.
Fundamentals & Business Operations:
Despite the post-earnings dip, IBM continues to display strong business fundamentals:
Free Cash Flow (TTM): ~$12.3B, supporting dividends and future investment.
FCF Margin: 19.1%
Gross Margin: ~58% | Operating Margin: ~ 17%
Forward P/E: ~22.45x | EV/EBITDA: ~19.85x
Dividend Yield: 2.6%
These metrics reflect operational efficiency, cash generation, and relative undervaluation compared to peers—especially given IBM’s AI and hybrid cloud positioning that remains strong. With margins that continue to be at the top of the industry, IBM also has the resources to execute on the tremendous opportunities arising in the tech world.
Macro & Industry Context:
We’re in the early stages of a long-term AI and data center growth cycle, and IBM, while not the most popular AI name, is deeply embedded in enterprise infrastructure, consulting, and mainframe compute. Their recent earnings beat didn’t change that narrative. Investor sentiment overreacted, giving patient traders a potential entry on weakness. Analysts still hold a buy on this name with price targets well above $270. This isn't a one-day trade, but in a few weeks, let's see where the market is at.
Price Targets & Risk/Reward:
Entry Zone: $245 (watch for confirmation & strength)
Target 1: $280 (resistance level with high volume in the range)
Optional Long-Term Hold: If the broader AI trend continues, IBM could break all-time highs and trend above $300 over time.
Strategy & Patience:
This is not a chase setup. I will wait for $245 to be reached and confirmed—a level backed by technical support, volume profile, and long-term valuation logic. If IBM holds and reverses with strength, this could be a strong swing trade or even a long-term position for investors who want value with AI exposure. I will be looking for a confirmation(maybe a candle pattern) before entering the trade, but if it gets there, I see good potential for a bounce.
Solana Approaching Key Resistance: watch for $219Hello guys!
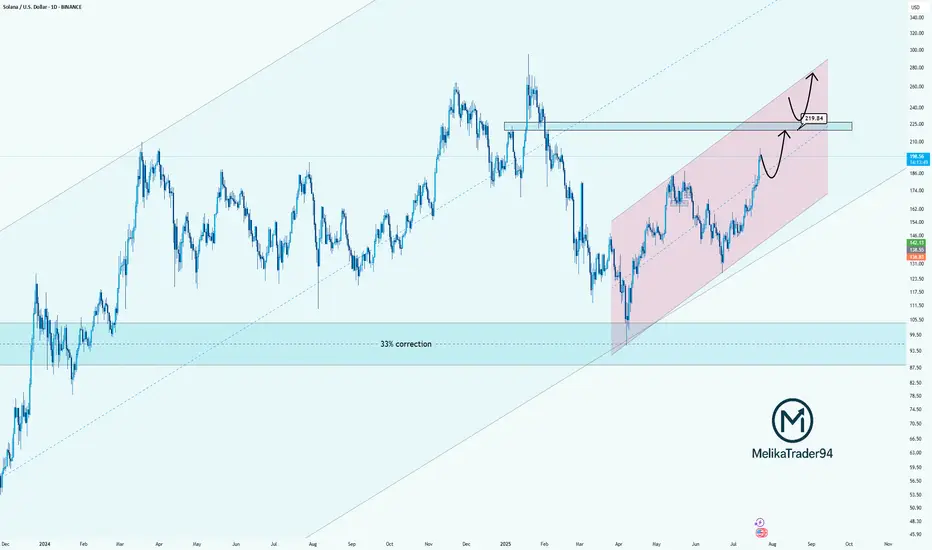
Solana has been trending strongly inside a rising parallel channel, recovering steadily after a significant 33% correction. The bullish momentum is clear, and the price is now approaching a key resistance zone near $219.84, which previously acted as a major turning point.
Here’s what I’m watching:
Strong uptrend within the pink channel shows controlled and healthy growth.
$219.84 is a critical decision zone. Price could:
React with a pullback before pushing higher,
Or break through it and flip the level into support for the next bullish leg.
The reaction in this zone will determine the next structure.
Whether we see a temporary correction or continuation to new highs.
NZDUSD Potential UpsidesHey Traders, in today's trading session we are monitoring NZDUSD for a buying opportunity around 0.59800 zone, NZDUSD is trading in an uptrend and currently is in a correction phase in which it is approaching the trend at 0.59800 support and resistance area.
Trade safe, Joe.

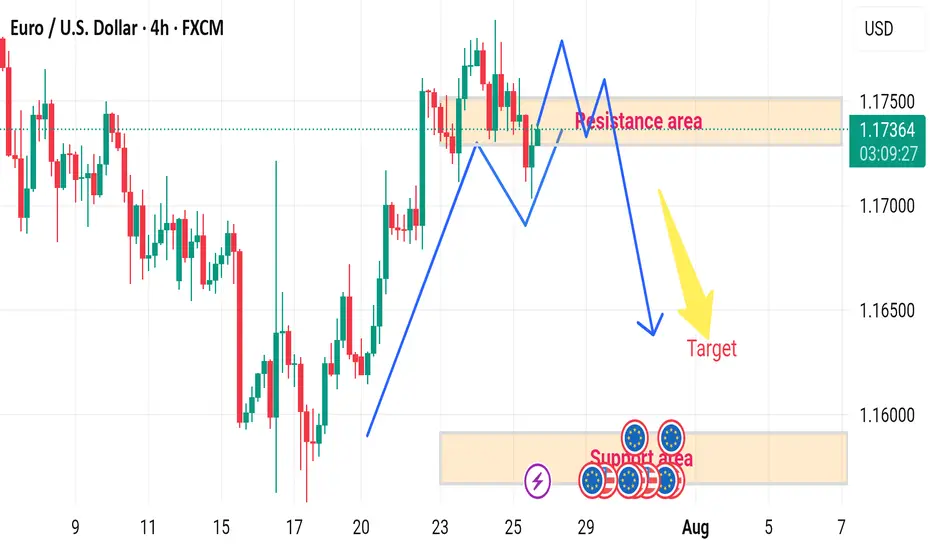
EUR/USD H4 DOWNWARD 🔄 Disrupted EUR/USD 4H Analysis
🟢 Current Context:
Price is currently at 1.17375, slightly below the resistance area (1.17400–1.17500).
Market shows a recent bullish impulse, followed by consolidation within the marked resistance zone.
Projection in the image suggests a double-top pattern forming at resistance, followed by a bearish reversal toward the target demand area (~1.15800–1.16000).
---
⚠️ Disruption Points:
1️⃣ Failed Double Top Scenario
Disruption Hypothesis: Instead of forming a clean double top and reversing, price may break above the resistance zone at 1.17500.
Reasoning: Strong bullish momentum and recent higher highs indicate potential for bullish continuation, invalidating the bearish target.
Disrupted Path: Price could break out → retest the resistance as new support → continue toward 1.18000–1.18300 zone.
2️⃣ Mid-Range Liquidity Trap
The current range may act as a liquidity trap:
Smart money could push the price slightly below support (fake breakdown), attract sellers, then reverse sharply upwards.
This would trap retail sellers targeting the 1.15800 zone.
5 Lessons from My First 100 TradesAfter executing and reviewing over 100 real trades in crypto, forex, and gold — I found patterns. Bad patterns. Repeating mistakes. And lessons I wish someone had told me earlier.
So I broke them down into 5 key insights that changed how I trade — and might just save you thousands.
📘 Here’s what’s inside:
1️⃣ Smart Profit-Taking:
How I turned 10 R/R into 32 R/R using a dynamic exit plan.
📘Further resource:
Cycle Mastery (HWC/MWC/LWC)
---
Multi-Timeframe Mastery
2️⃣ The Sleep Edge:
70% of my losing trades happened after bad sleep. Here’s why that matters more than emotions.
3️⃣ No More Blind Stop Orders:
Why I stopped using buy/sell stops without real candle confirmation — and what I do instead.
📘 Further reading:
Breakout Trading Mastery
---
Indecision Candle Strategy
4️⃣ Multi-Layered Setups Win:
How structure, S/R, patterns, and timing stack into high-probability entries.
5️⃣ News Trading? Just Don’t.
The data behind why most of my SLs were hit near news time — and how I avoid the trap.
💡 These aren’t theories. These are real lessons from real trades.
If this video helped you or sparked an “aha” moment, give it a boost, commenting your takeaway, and sharing it with a fellow trader.
lets grow together :)

GALA price analysis🪙 Please tell us, is the #GALA project still "alive"?
It's old, has gone through many cycles on the crypto market, and hasn't died yet.
Maybe now (being related to the CRYPTOCAP:ETH Ecosystem) is the best time to “come back to life”?
For this to happen, the price of OKX:GALAUSDT must finally:
1️⃣ confidently hold above $0.01390-0.01460
2️⃣ continue to grow confidently to $0.044
3️⃣ And finally, rapidly grow to $0.10-0.11 by the end of the year.
Is this a realistic scenario? Write your thoughts in the comments.

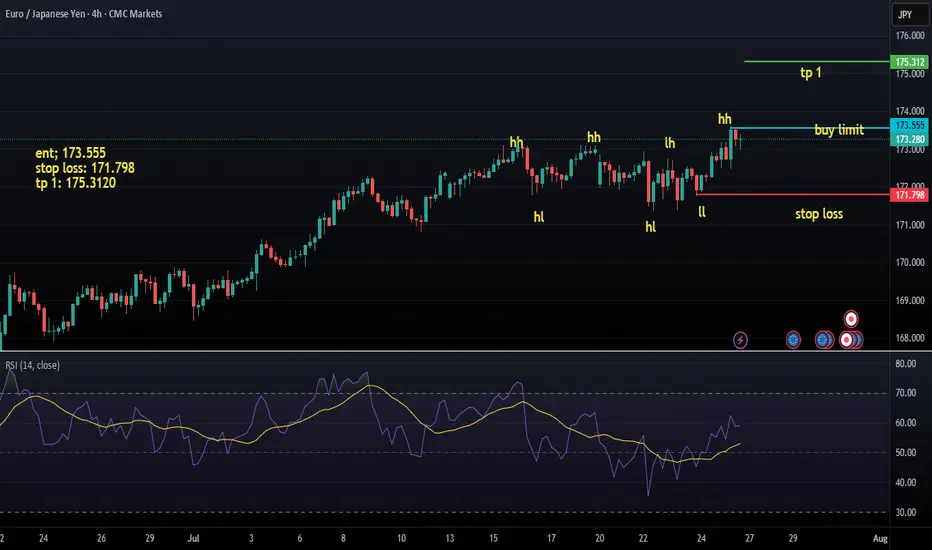
NZD/USD – 1H | Bearish Setup at Breakout of LL| AB=CD HarmonicsWe’re currently eyeing a bearish continuation on NZD/USD based on clear market structure and harmonic confirmation.
📉 Trend: Bearish
🔍 Divergence: Bearish
📐 Harmonics: AB=CD pattern
📊 Bias: Bearish
🧠 Technical Breakdown
✅ Price has broken the previous Higher Low , confirming a structural shift.
✅ A Lower High is about to form — Now we’re waiting for the breakout of the previous Lower Low to confirm trend continuation.
✅ We’ve placed a Sell Stop below that Lower L ow, targeting bearish continuation.
✅ The AB=CD harmonic pattern shows potential for extended downside — reversal zone still far.
📌 Trade Setup
🔹 Entry: Sell Stop @ 0.59965 (breakout of Lower Low)
🔹 Stop Loss: 0.60614
🔹 Take Profit: 0.59316
🔹 Risk/Reward: 1:1
🔹 Lot Size: 0.38
🔹 Risk: $200
🔹 Reward: $200
⚠️ Note: This is a pending setup. Trade only triggers on the breakout of the previous Lower Low, keeping the bearish structure intact.
#NZDUSD #ForexSetup #BearishBreakout #LowerLow #PriceAction #SmartMoney #ABCDPattern
#HarmonicTrading #ForexStrategy #SellSetup #TradingView #FXMarket #ForexSignals
#DayTrading #SwingTrading #ChartAnalysis #TradeSmart #ForexTrader #RiskManagement
#ForexEducation #BearishStructure #FibonacciTrading #MarketStructure #BreakoutTrade
#TradersOfInstagram #TradersOfTradingView #CryptoAndForex

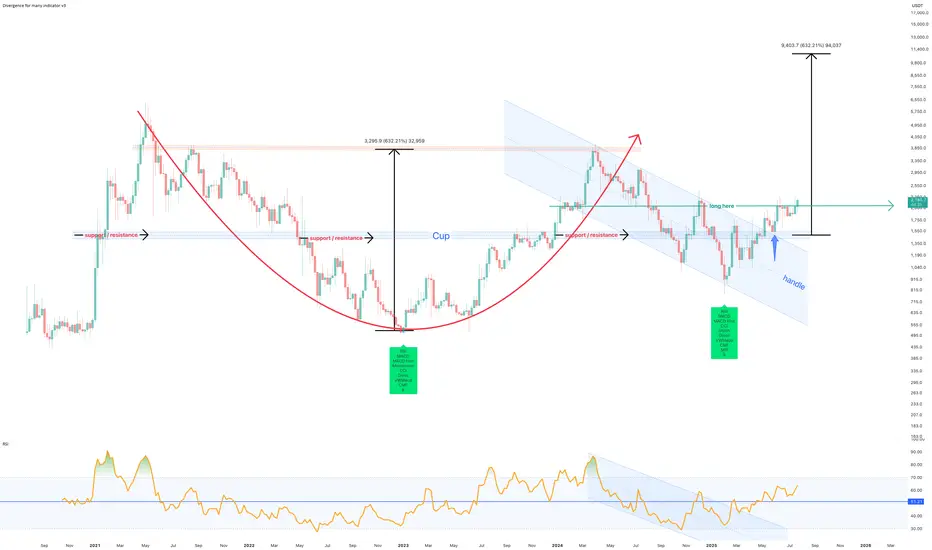
July 2025 - Marker DAO (MKR) to $10k before EthereumThe above forecast is predicted to strike before October 2025. Ethereum will never reach $10k in its lifetime, which a study for another post.
A 75% correction is shown on the above 6 day chart that began in March 2024. A number of compelling reasons now exist for a strong upward move.
Support and resistance
Look left, price action confirms support on past resistance, which follows a strong positive divergence. The resistance has held since May 2022. Incidentally on the topic of divergences, on the same time frame with the same settings, Ethereum prints a double negative divergence over the same period. (see below).
The trend
Both Price action and RSI resistances have broken out. RSI confirms a trend reversal on past resistance.
A Cup and Handle pattern confirmation
The forecast is derived from the Cup and Handle pattern topping out at around $10.5k, however it is not suggested to wait until this area before profits are taken.
Is it possible price action continues to print lower lows? Sure.
Is it probable? No.
Ww
Ethereum 6 day double negative divergencies
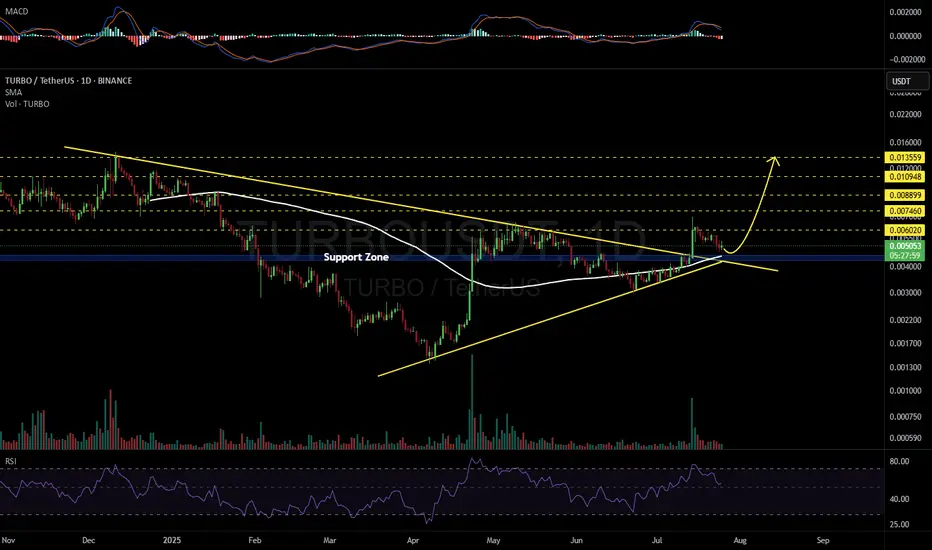
TURBOUSDT 1D#TURBO has broken above the symmetrical triangle and is now testing the support zone. This zone is further strengthened by multiple layers of support, including the Ichimoku Cloud and the SMA100 — making it a strong area for a potential bounce. We're expecting a price reversal from this zone. In case of a successful bounce, the targets are:
🎯 $0.006020
🎯 $0.007460
🎯 $0.008899
🎯 $0.010948
🎯 $0.013559
⚠️ As always, use a tight stop-loss and apply proper risk management.
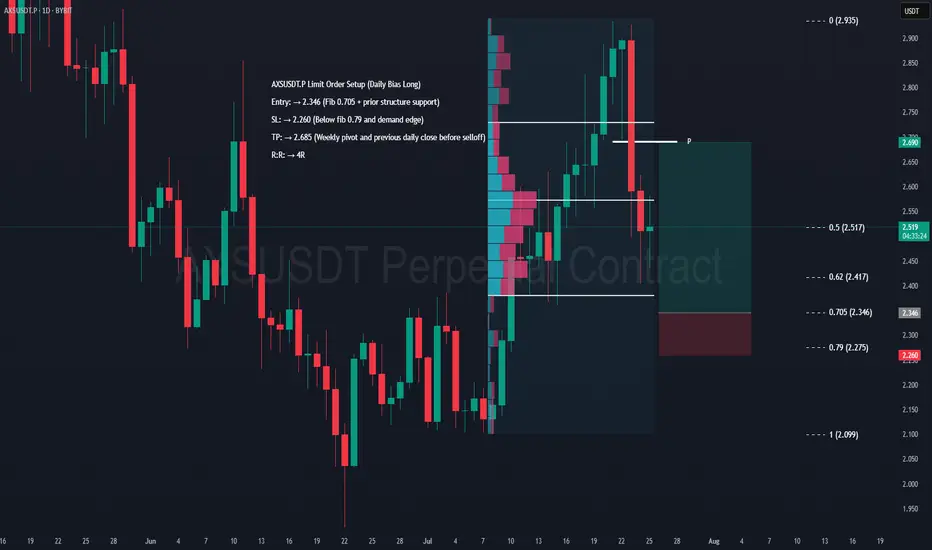
AXS Swing Long Setup – Daily Confluence TradeAXS Limit Order Setup (Daily Bias Long)
Entry: → 2.346 (Fib 0.705 + prior structure support)
SL: → 2.260 (Below fib 0.79 and demand edge)
TP: → 2.685 (Weekly pivot and previous daily low before selloff)
R:R: → 4R
DISCLAIMER: I am not providing trading signals or financial advice. The information shared here is solely for my own documentation and to demonstrate my trading journey. By openly sharing my process, I aim to put pressure on myself to stay focused and continually improve as a trader. If you choose to act on any of this information, you do so at your own risk, and I will not be held responsible for any outcomes. Please conduct your own research and make informed decisions.
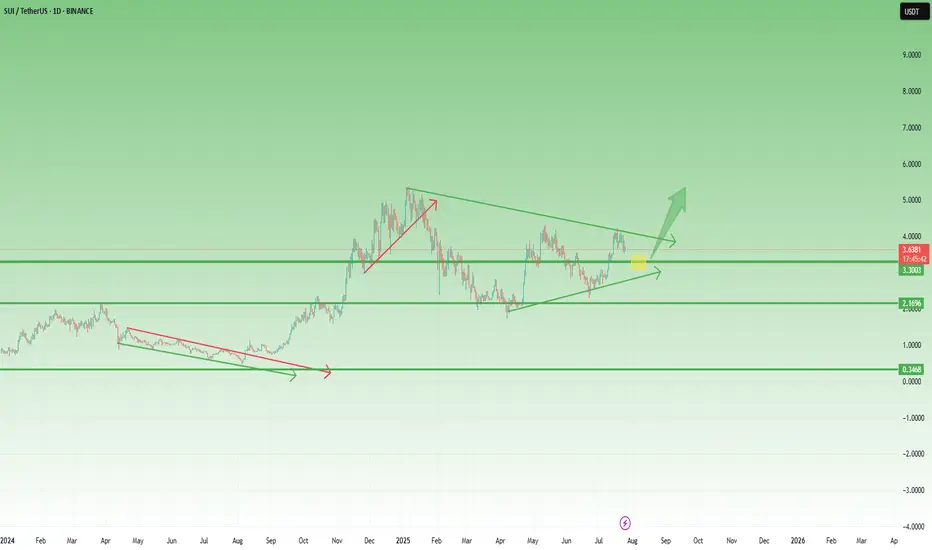
SUI – Preparing for a Breakout? Symmetrical Triangle in PlaySince the beginning of the year, SUI has been consolidating inside a classic symmetrical triangle — marked by higher lows and lower highs, a sign of tightening price action and growing pressure.
This kind of structure doesn’t last forever.
Usually, it ends with a strong breakout — especially if supported by volume.
🔍 What to watch:
- A break above the upper trendline could trigger a strong move, with potential targets in the $5 area and even a new ATH, if altcoins enter a real revival phase.
- On the flip side, $2.80 remains the key support level.
As long as it holds, bulls remain in control of the structure.
📍 My game plan:
I’m watching the $3.25 area as a potential buy zone —a great spot inside the pattern, offering tight risk and strong upside if the breakout comes.
Until then, it’s all about patience.
Pressure is building. The triangle is tightening.
And the market is waiting for a reason to move.
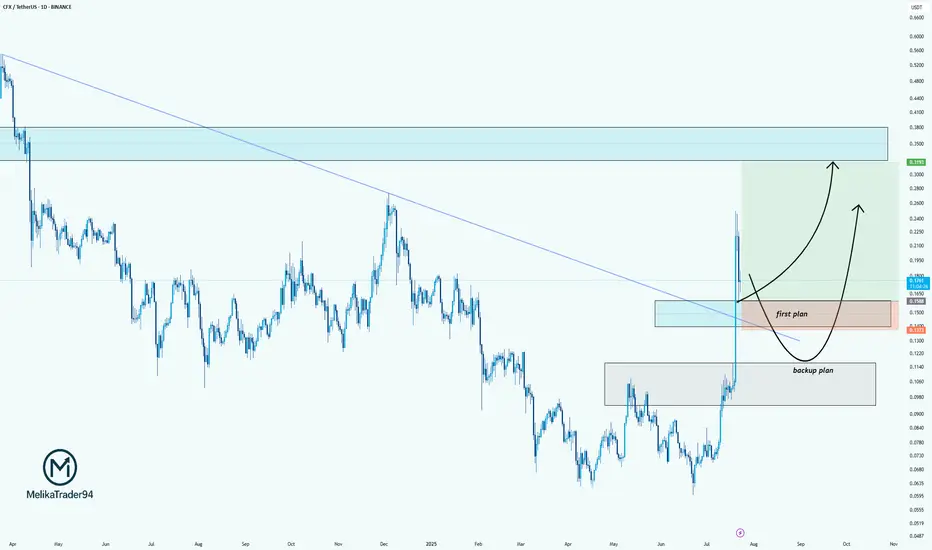
CFX/USDT: Two-Plan Strategy for the Next MoveHello guys.
CFX just broke out of a long-term downtrend line, showing strong bullish momentum. After this sharp impulse, we're now patiently watching for the pullback zone.
Here’s my plan:
✔ First plan: Looking for a reaction around the breakout retest zone (0.1500–0.1300). This is the ideal area for a bullish continuation if buyers step in early.
✔ Backup plan: If the price drops deeper, the second demand zone (around 0.1060–0.0950) is where we’d expect stronger buyer defense.
Potential upside target: 0.31+, where price previously showed strong selling pressure.
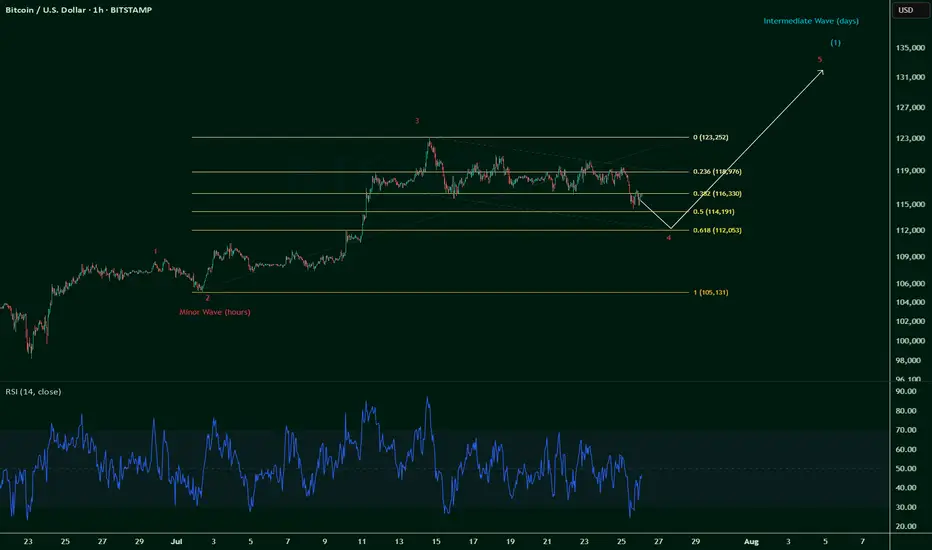
$BTC breaks $115k invalidates Wave 5 -- still Wave 4 correction.So it was a long squeeze after all, and one that was coming.
The initial thoughts were that we're on a Wave 5 up and counting:
But we're brought back down to earth as CRYPTOCAP:BTC breaks below $115k, invalidating a Wave 5 count.
So, it's official: we're still on a Wave 4 correction, which can go as low as 0.618 fib towards $112k.
Now painting a likely scenario given that Wave 2 correction only moved 0.236 fib ~ 0.328 fib (Wave 2 & Wave 4 often contrast):
This could play out till end July or even all the way into early August, which if comes to fruition, could signal for a bullish August.
And August has historically almost always been a bearish month (8 red historical months out of 12).
Pinch me.
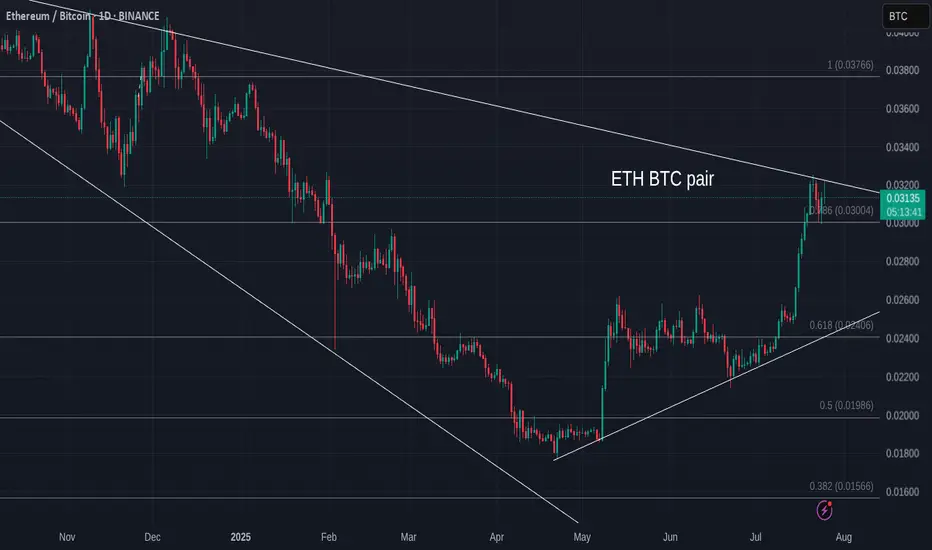
ETH Versus BTC - Daily Update - Bitcoin still winning
As mentioned yesterday, ETH has hit long term resistance and got rejected....and it is happening again
ETH seems unable to find the moemntum just yet.
The MACD Daily is still turning Bearish
The Daily RSI is also up high and likely to fall
The weekly RSI is also high though the Weekly MACD has still yet to rise above Neutral
All in All, for me, it is NOT the time....Though we can see that ALTS are running Hot though not a full ALT season as we have seen in the past.
It is fragile...please remain CAUTIOUS
demand and supply strategybuy opportunity setup on BTC
the buyers are taking control in the market and i believe its making a way for a buy opportunity
apply risk management and be safe

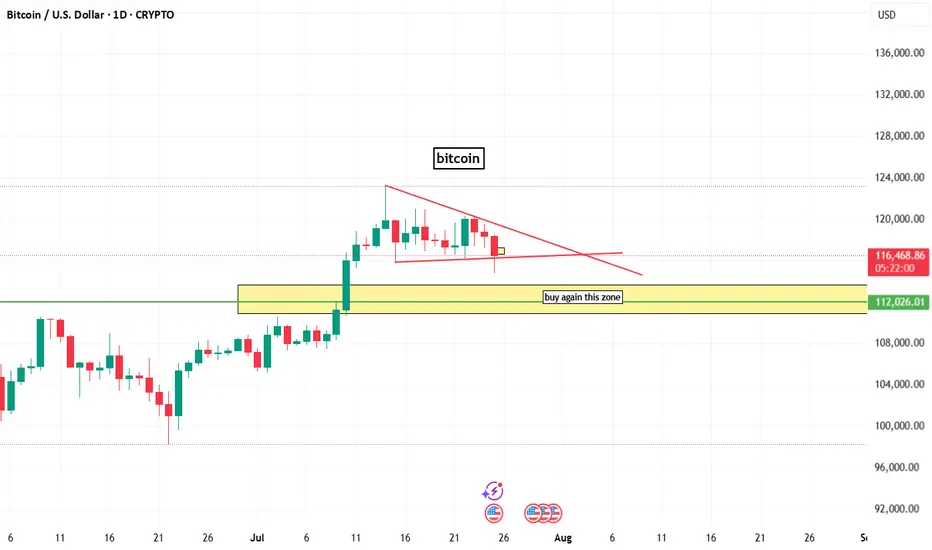
bitcoin chart analysisbitcoin chart analysis on daily time frame
here a buy zone that indicated by box and line.
and on chart bitcoin bullish but lower time frame btc is berrish.
Gold 30Min Engaged ( Bullish & bearish Reversal Entry Detected )————-
➕ Objective: Precision Volume Execution
Time Frame: 30-Minute Warfare
Entry Protocol: Only after volume-verified breakout
🩸 Bullish Reversal : 3354
🩸 Bearish Reversal : 3378
➗ Hanzo Protocol: Volume-Tiered Entry Authority
➕ Zone Activated: Dynamic market pressure detected.
The level isn’t just price — it’s a memory of where they moved size.
Volume is rising beneath the surface — not noise, but preparation.
🔥 Tactical Note:
We wait for the energy signature — when volume betrays intention.
The trap gets set. The weak follow. We execute.
BTC SHORT TP:113,500 25-07-2025We’re looking for a clean short from 116,200 to 116,600, aiming for targets between 113,200 and 113,600.
This move offers an average 3.5 RR on the 2-hour timeframe, and we expect it to play out within 24 hours.
Technical context: This looks like a simple bearish continuation after recent price action. Momentum has shifted and this setup offers a clean entry post-manipulation.
Manage your stop-loss according to your strategy and stay updated for the next move.
We don’t use indicators, we’re not out here drawing lines or cute little shapes — I just give you a clean trade.
If price doesn’t move within the expected time, the trade becomes invalid.

HBAR wave 1 out of 5 is doneCurrently HBAR and crypto in general is having a correction to .5-.618 (Wave 2 out of 5) - This will push HBAR to .18-.19 range in the upcoming days

BTC update - July 25 2025After hitting 123,000 zone, Bitcoin has started a downward correction. For the past ten days BTC was mainly showing sideways movement until it crossed below the important support zone of 115,000.
As shown on BTC's chart (on the left), we can expect BTC to continue dropping towards 113,000 zone where there's a midterm trendline and also a fib level. Whether weak or strong, an upward reaction is expected when BTC reaches down there.
BTC CME chart (on the right) also shows there is an unfilled gap located in the 114,380 - 115,635 zone which is most probably going to get filled soon. please note that at the moment BTC CME futures price is about 1,000 dollars more than that of BTC so it is probably safe to assume that 114,000 level on CME Futures chart is equivalent to 113,000 level on BTC's chart.