LINK Swing Trade – Watching for a PullbackLINK has rallied 58% since June 24th and is now consolidating after making a higher high. Price action is facing resistance and looks overheated, so a pullback toward support could offer a fresh long entry.
📌 Trade Plan:
• Entry Zone: $15.00 – $16.00 (on pullback)
• Take Profit Levels:
o 🥇 $20
o 🥈 $25
o 🥉 $30
• Stop Loss: Close below $13
Trend Analysis

Is $Hype worth the hype?Ascending Channel:
- The price has been moving inside a rising (bullish) channel since mid-April 2025.
- If this channel holds as support, the price may bounce upward again, continuing the uptrend.
- If it breaks below the channel, this could signal a trend reversal or deeper correction.
Tips
- Trend followers may look to buy on dips near the lower channel line.
- Breakout traders should watch for moves outside the lower channel line.

GOLD BULLISH IN 1HR TIME FRAME GOLD followed the same pattern from its previous data and will be going for the ATH

XRPUSD - Target reached. Reversal on the plateSo, that was a nice long trade.
Now price is stretched at the Upper Medianline Parallel (U-MLH).
As of the time of writing, I already see price pulling back into the Fork. A open and close within the Fork would indicate a potential push to the south.
Target would be the Centerline, as it is the level where natural Meanreversion is.
Observation Hat ON! §8-)

BTC | Long | Target: + 121500This technical analysis is for informational and educational purposes only. It does not constitute financial advice. Remember to always research and consult with a professional before making investment decisions. Good luck! 📈💼🚀

Is Smart Money Selling Gold? A VSA LookHey Traders,
Let's take a look at the Gold (XAU/USD) 1-hour chart using Volume Spread Analysis (VSA). The price made a strong run-up to a new high around $3,438, but the volume is telling us a story of potential weakness.
Here’s a simple breakdown of what I'm seeing.
The Trap at the Top (Signs of Weakness)
Think of the market as being moved by "smart money" (professionals) and "herd money" (the crowd).
Climax Volume: See that huge volume spike right at the peak on July 23rd? While it looks like strong buying, this is often a classic sign of a Buying Climax. This is where smart money starts selling their positions to the excited crowd who are buying at the top, fearing they'll miss out.
No Real Buyers Left: After the peak, notice how the price tried to push higher a few times but on much lower volume? This is a "No Demand" signal. It’s like a car trying to rev its engine, but it's out of gas. It shows there isn't enough buying power to push the price any higher.
Sellers Take Control: As the price started to fall from the top, look at the volume on the down bars. It got bigger. This tells us that supply (selling pressure) is now in control, and they are pushing the price down with force.
Where Are We Now?
The price has dropped and is now hovering around the $3,330 area. The volume has dried up for now, which means the market is taking a pause and deciding where to go next.
What to Watch For Next
Based on the VSA story, here are two possible scenarios:
Scenario 1 (Bearish 📉): The weakness continues. If we see the price try to rally from here but the volume is very low, it would be another major red flag. It would suggest sellers are still in control, and we could see a break below the recent low of $3,320 for another leg down.
Scenario 2 (Bullish 📈): This is a bear trap. For this to happen, we would need to see a strong sign of buying returning. For example, a sharp drop on massive volume that is quickly bought back up. This would signal that the sellers have been absorbed and smart money is starting to buy again.
Conclusion:
For now, the evidence points more towards weakness. The action at the top suggests that smart money was distributing (selling) their gold.
Key Takeaway: Be cautious of any weak-looking bounces. The sellers appear to have the upper hand until we see a clear sign of strength with high buying volume.
This is not financial advice. This is just my interpretation of the chart using VSA. Always do your own research and manage your risk. Good luck trading!

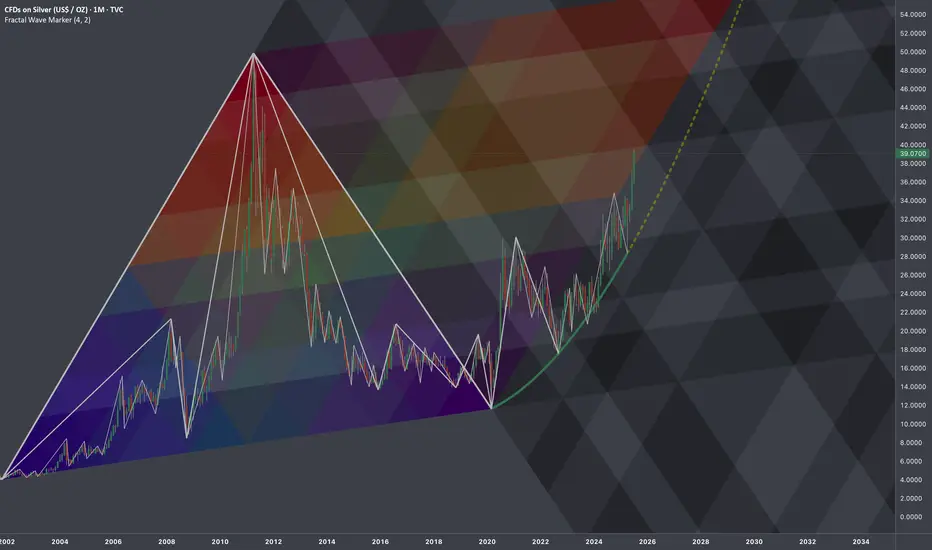
$SILVER: Fractal Geometry (Cycle 2001-2020)Research Notes
Working out probabilistic texture using multiple fibonacci channels on just 3 coordinates of fractal cycle (late 2001 - 2020) on linear scale (on log chart it would still be relevant, so you can switch to view with right click on price scale for selection).
To describe behavior of price and key levels on smaller scale starting from covid we'll use
L-H-L:
Using coordinates to express surface area of broken cycle with fibs mimicking rise, fall and side mapping cycle:
I'd look for patterns of bullish exhaustion only after price crosses the curve.
Hedera (HBAR): Waiting For Break of Structure (BOS) | BULLISHWe are bullish as soon as we hit that BOS near the local EMAs, which will confirm our buy-side trading setup.
Now there is one thing that concerns us, that being the huge CME gap below our local lows on current timeframes, so it is very important here to wait for that BOS before entering into long here, so let's wait.
Swallow Academy

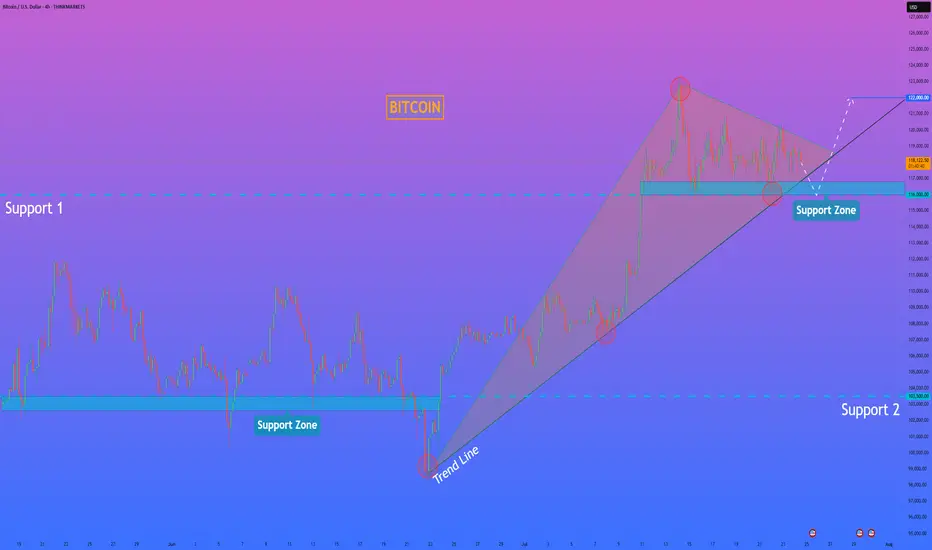
HelenP. I Bitcoin can fall to support zone and then start riseHi folks today I'm prepared for you Bitcoin analytics. If we look at the Bitcoin chart, the most prominent feature is the formation of a large bullish pennant following a strong upward impulse. This type of consolidation pattern typically suggests that the market is pausing to gather strength before continuing in the direction of the primary trend. The price is currently consolidating within the boundaries of this pennant, which are defined by an upper resistance line and a strong ascending trend line acting as the lower support. It is crucial to note the confluence of this ascending trend line with the horizontal support zone between 116000 and 116800, creating a powerful area of potential support. My analysis is based on the expectation that the price will make a final test of this key support confluence. I believe that a dip towards the 116000 - 116800 zone will be met with strong buying interest. A clear rejection from this area, confirming that buyers are defending both the horizontal and dynamic support, would be the critical condition validating a long position. A successful bounce should provide the catalyst for a bullish breakout from the top of the pennant, signaling the resumption of the uptrend. Therefore, I have set the primary goal for this subsequent upward move at the 122000 level, a logical target that would confirm the continuation of the bullish market structure. If you like my analytics you may support me with your like/comment ❤️
Disclaimer: As part of ThinkMarkets’ Influencer Program, I am sponsored to share and publish their charts in my analysis.
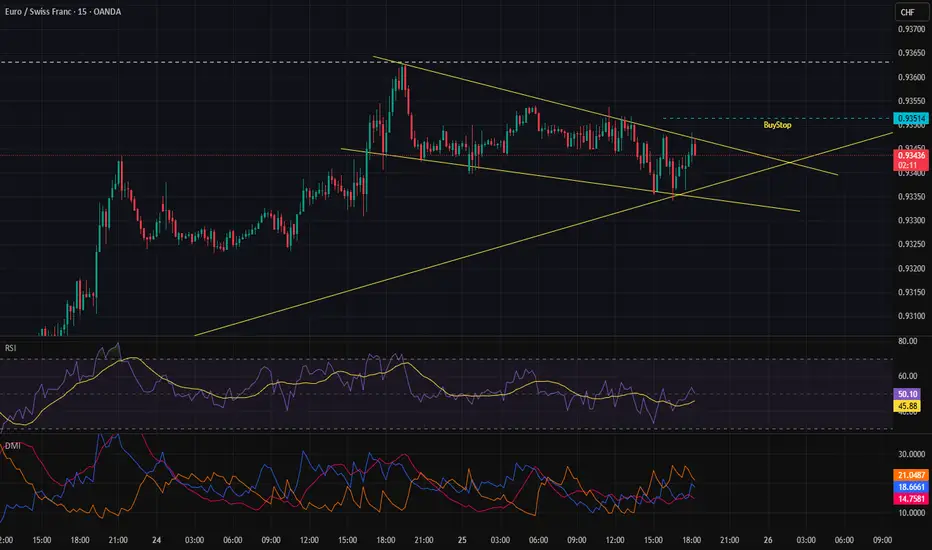
Placing a buy stop here could be reasonable.Because of the consolidation and the trend behind it, it seems reasonable to place a buy stop so we don’t miss out in case of a sharp move.
Short-term BITCOIN analysisShor-term
In my opinion, Bitcoin could make a move towards $113,000-115,000 and then start moving upwards. In any case, according to previous analysis and apart from short-term fluctuations, it could touch the target of $140,000-150,000.
Good luck
NEoWave Chart

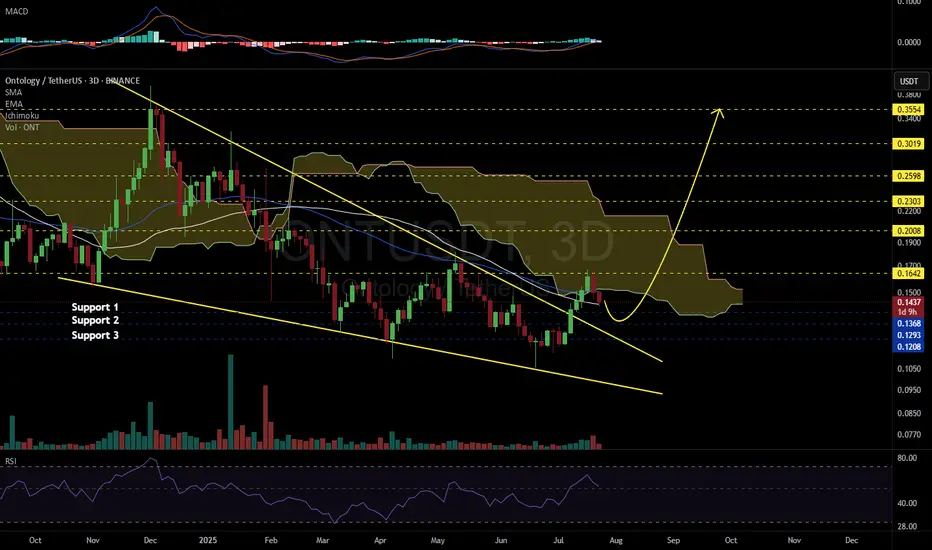
ONTUSDT 3D#ONT has broken above the large falling wedge pattern on the 3-day chart. It was recently rejected from both the Ichimoku Cloud and the 3-day EMA50, but is still holding above the SMA50 — a positive sign.
📌 Consider laddered entries at the current price and key support levels:
🔹 $0.1368
🔹 $0.1293
🔹 $0.1208
In case of a successful bounce, the upside targets are:
🎯 $0.1642
🎯 $0.2008
🎯 $0.2303
🎯 $0.2598
🎯 $0.3019
🎯 $0.3554
⚠️ As always, use a tight stop-loss and apply proper risk management.
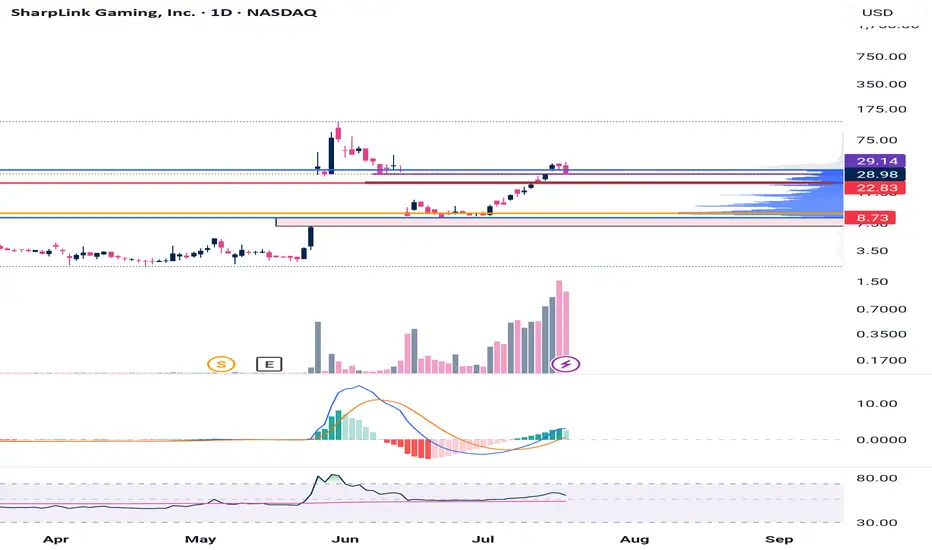
$SBET - look out down below. CRYPTOCAP:ETH is the asset
NASDAQ:SBET is the stock
Some gaps to fill below. Will keep loading.
Could be life changing!
SHORT TERM BEARISH TARGETS ON THE H4 TIMEFRAME on THE BTCUSD, here are the downside target levels (short-term bearish targets) for BTC/USDT:
🎯 Target Levels:
1. Target Point 1:
112,000 USDT
This is a minor support zone where a temporary bounce or consolidation could occur.
It aligns with previous price action support and is near the lower Ichimoku edge.
2. Target Point 2:
106,000 USDT
This is a major support level near the lower boundary of the ascending channel.
If price breaks below Target 1 decisively, this becomes the high-probability target.

Jasmyusdt Buy opportunityJASMYUSDT is displaying a strong cup and handle formation, presenting a good accumulation opportunity within the highlighted zone. The provided targets on the chart align with the coin’s potential, making it a worthwhile hold.
Previous analysis, which identified an Adam and Eve pattern, played out successfully.
The current strategy is to hold for at least 4 months, observing how the market develops.

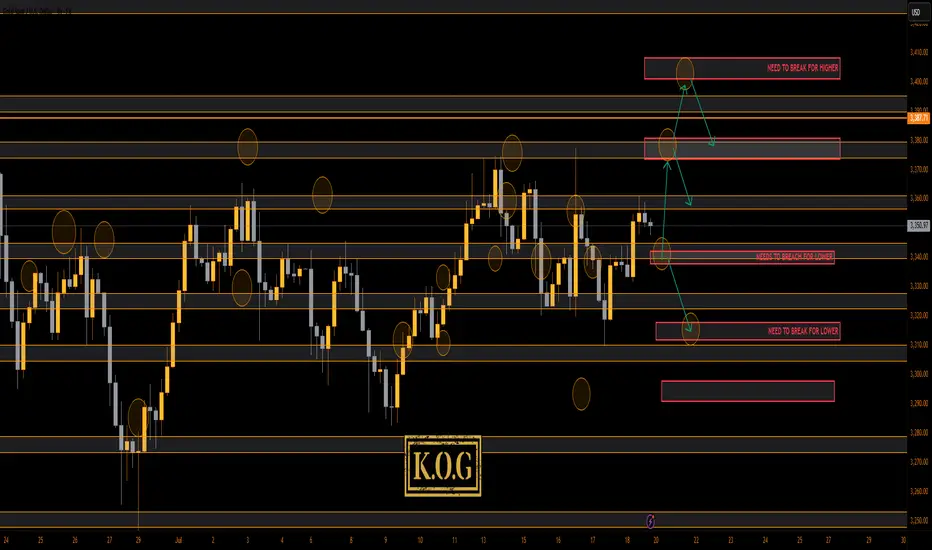
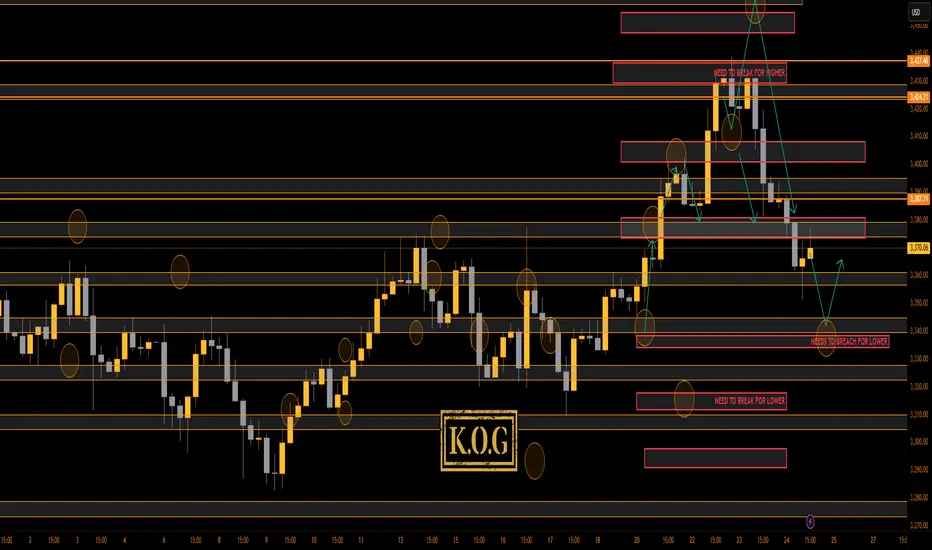
THE KOG REPORT THE KOG REPORT:
In last week’s KOG Report we said we would be looking for a price to attempt the higher level red box sitting around the 3370-75 region and if not breached, we felt an opportunity to short would be available from that region. We said if that failed and the move commenced, we would be looking at a complete correction of the move back down into the 3330-35 region, where we would then monitor price again in anticipation of a long from there or the extension level of 3310 which was also a red box short target (move complete). As you can see from the above, not only did we get that higher red box, we rejected, completed the move downside and then our traders managed to get that long trade all the way back up into the Excalibur target, red box targets and the hotspots shared in Camelot.
A decent week again, not only on Gold but also the numerous other pairs we trade, share targets on and analyse.
So, what can we expect in the week ahead?
For this week we can expect more ranging price action, but due to the previous range from last week being so tight, it looks like we’ll see a breakout coming in the latter part of the week unless there is news to bring us unexpected volume.
We have the key level below 3335-40 support and above that resistance and a red box sitting at 3375-80. This is the region that needs to watched for the break, and if broken we should hit the range high again at 3400-10. However, if rejected, we could again see this dip to attack that lower order region 3310-6 before attempting to recover.
Last week we wanted to see that curveball and although we did see some aggressive price action, I think we will see something extreme for this week. It’s that lower level 3310-6 that is a key region for bulls, if broken we can see a complete flush in gold taking us down into the 3250’s before we start the summer run. That for us would be the ideal scenario going into the month end, but, we’ll play it how we see and as usual, we go level to level and update any changes as we go along.
KOG’s Bias for the week:
Bullish above 3340 with targets above 3355, 3361, 3368, 3372 and above that 3385
Bearish below 3340 with targets below 3335, 3330, 3322, 3316, 3310 and below that 3304
RED BOX TARGETS:
Break above 3350 for 3355, 3361, 3367, 3375 and 3390 in extension of the move
Break below 3340 for 3335, 3330, 3320, 3310 and 3306 in extension of the move
Please do support us by hitting the like button, leaving a comment, and giving us a follow. We’ve been doing this for a long time now providing traders with in-depth free analysis on Gold, so your likes and comments are very much appreciated.
As always, trade safe.
KOG
From Hype to Hesitation: What’s Next for Pump Fun ($PUMP)?Today, I want to break down the recent developments and fundamentals of Pump fun ( BYBIT:PUMPUSDT ) and its token PUMP — a project that initially launched with strong hype but is now facing serious investor concerns .
What is Pump fun?
Pump fun is a memecoin launchpad that allows users to launch and trade memecoins in a gamified, simplified environment. The idea was to create a frictionless way for anyone to generate and speculate on meme tokens, leveraging viral growth and community culture.
Its native token, PUMP , was introduced via an ICO priced at $0.004, with 12.5% of the total 1 trillion supply offered during the sale.
Latest Updates – Past 24 Hours Recap
PUMP Crashes Over 50% After ICO :
The token initially spiked to $0.0068 on launch day (July 16) , but has now dropped over 50%.
This is roughly 14% below its ICO price , creating concerns for short-term investors.
Founder Confirms No Airdrop Anytime Soon:
In a livestream with ThreadGuy , project founder Alon Cohen confirmed:
“ The airdrop is not going to be taking place in the immediate future. ”
While the team still plans to deliver an airdrop, Alon emphasized it must be well-executed and meaningful, not rushed for hype.
The current focus is on long-term growth and ecosystem sustainability, not short-term incentives.
Mixed Investor Sentiment:
High-profile trader Machi Big Brother ( Jeffrey Huang ) reportedly increased his long position in PUMP — even though he’s down over $5.8M on his position.
Meanwhile, two wallets linked to private sale investors dumped over 1.2B PUMP at $0.003 , taking a combined loss of $1.19M.
Declining Volume and Market Cap:
Trading volume has dropped significantly.
PUMP has lost over 40% of its value in the past 7 days.
Short-term holders appear uncertain, while the project team asks for patience and long-term vision.
Fundamental Outlook:
Pump fun’s future now heavily depends on:
The real utility of the platform as a meme coin incubator.
The team’s ability to regain trust after delaying the airdrop.
Whether new features or hype can revive volume and user engagement.
-------------------------------
Now, let's examine the PUMP token from a technical analysis perspective
From the outset, I must say that due to the small number of candlesticks that create the PUMP token, technical analysis may be a bit difficult , but we will use technical analysis tools to analyze this token.
The PUMP token seems to be moving in a descending channel since the beginning of its correction (over -50%) until now, we need a second price bottom to confirm the descending channel.
I expect the PUMP token to rise from the Potential Reversal Zone(PRZ) and near the Support lines to $0.0029(+15%) . PUMP Token increase can also be from the bottom of the ascending channel .
Second target: the upper line of the ascending channel.
Cumulative Long Liquidation Leverage: $0.002810-$0.002530
Cumulative Short Liquidation Leverage: $0.003498-$0.00327
Note: Stop Loss(SL): $0.002391
Please respect each other's ideas and express them politely if you agree or disagree.
Pump fun Analyze (PUMPUSDT), 1-hour time frame.
Be sure to follow the updated ideas.
Do not forget to put a Stop loss for your positions (For every position you want to open).
Please follow your strategy and updates; this is just my Idea, and I will gladly see your ideas in this post.
Please do not forget the ✅' like '✅ button 🙏😊 & Share it with your friends; thanks, and Trade safe.

EURNZD Continuation setup following recent bearish momentumThe market has recently pushed down with momentum.
Price attempted a timid "echo bounce" back into the broken support but was rejected, confirming this area now serves as area for bearish re-entries.
From what I can tell, we're entering the next leg of what I call the “Gravity Spiral Phase”, where sellers take over after taking a clear zone. Each wave down is not just a move, but a continuation of momentum migration into new bearish move.
Target: 1.93500
This level marks the next gravity anchor, a zone where price memory may attempt to stabilize, but only temporarily.

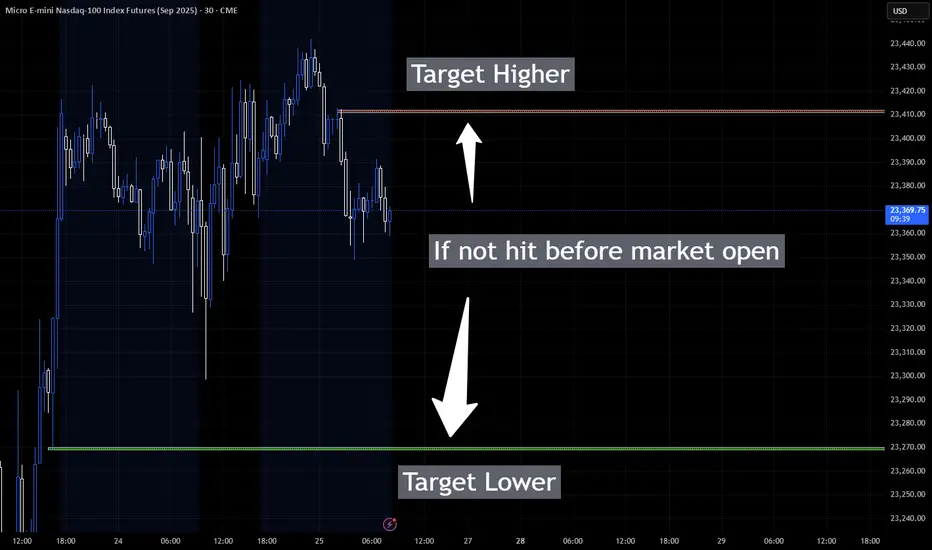
US Market open Targets for NQTarget areas for NQ at US Market open. I will use lower timeframe signals to watch for move up to higher target area or Down to lower target.

THE KOG REPORT - UpdateEnd of day update from us here at KOG:
Not bad play at all with the red boxes working well, KOG's bias of the day and the red box targets working well and of course the indicators and our trusted algo Excalibur guiding the way completing the move that we wanted downside. We then got a fantastic long from the bias level and red box activation up into where we are now.
So, what now?
We have resistance and a red box above which is broken suggesting we may see some more movement downside in the coming sessions. This would also align with the hunt and undercut low that can take place at this key level. We're a bit too low to short, so we'll either look for the break above 3375 to go higher, or, we'll wait lower for a potential long trade from the red box region.
Immediate support here is 3360-5 and resistance 3375.
Price: 3364
KOG’s Bias of the day:
Bullish above 3350 with targets above 3358✅, 3365✅ and above that 3379✅
Bearish on break of 3350 with target below 3337 and below that 3330
RED BOXES:
Break above 3365 for 3372✅, 3375✅, 3388 and 3406 in extension of the move
Break below 3350 for 3335, 3330, 3326 and 3307 in extension of the move
As always, trade safe.
KOG
SHORT EURNZDUpdate on eurnzd setup as i predicted it would sell. after breaking out of rising wedge, an opportunity presents itself to short targetting 1.00 fib level as tp 1. all the best

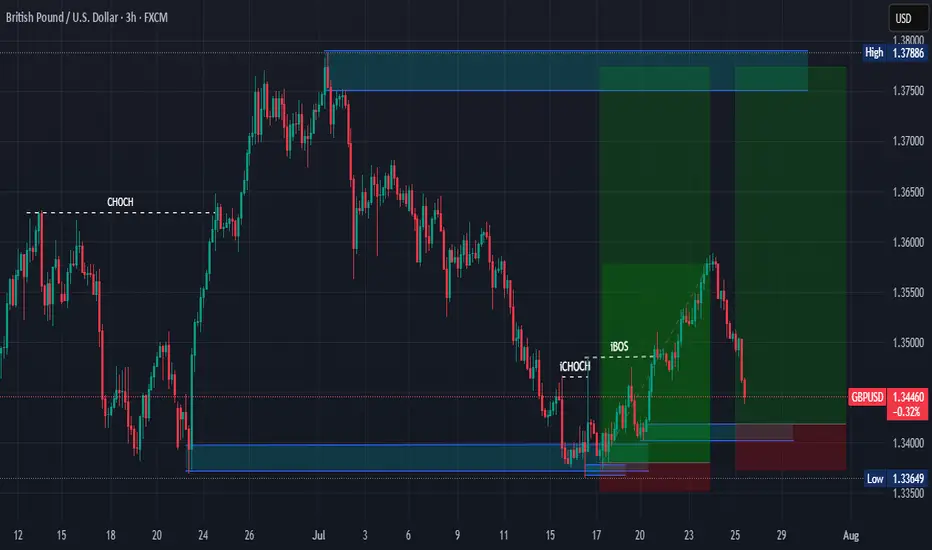
GBPUSD BUY IDEAWe will be looking into taking the buys as per the chart. I hope this is an idea that resonates with you. Happy trading days