A slight pullback to around 112,000 is expected before a bullishThere is a double top on the daily timeframe. It could pull back to the previous support level that I mentioned in the chart. Moreover, there is a healthy trendline support that can help BTC price bounce.
Trend Analysis

EUR/USD - Bullish parallel channel formation!The EUR/USD currency pair is currently exhibiting a bullish market structure on the 4-hour timeframe, moving steadily within a well-defined ascending parallel channel. Price action has consistently bounced between the lower and upper boundaries of the channel, with each dip finding support at the lower trendline and each rally meeting resistance near the upper trendline. This ongoing pattern suggests a strong and orderly bullish trend as the pair continues to make higher highs and higher lows within the channel.
The Market’s Upward Momentum
One notable feature of this trend is the recurring formation of 4-hour Fair Value Gaps (FVGs) during each upward leg. These FVGs act as temporary inefficiencies in the price movement, which the market consistently returns to fill before resuming its bullish momentum. As shown in the chart, the EUR/USD has filled multiple FVGs over the past week. Today, the pair once again retraced to fill a newly formed 4H FVG and has since continued its move higher. This repeated behavior reinforces the strength of the uptrend, as the market efficiently corrects itself and then propels further in the direction of the overall trend.
Bullish Outlook
From a bullish perspective, the key level to watch is the horizontal resistance zone around 1.1766. A confirmed break and hold above this level would signal a strong continuation of the current uptrend. Should the price sustain itself above this level, it could initiate a renewed push toward the upper boundary of the ascending channel, potentially targeting levels near 1.1820 and beyond. This scenario would confirm market confidence and open the door for further gains.
Bearish Risk
On the flip side, the bearish case would involve a false breakout above the 1.1766 resistance level, followed by a sharp rejection and a break below the rising lower trendline of the channel. Such a move would invalidate the current structure and shift the bias to the downside. In that case, the 4-hour FVG located between approximately 1.1710 and 1.1740 will act as a critical support zone. If this area fails to hold, it could trigger a deeper retracement and potentially lead to a more prolonged bearish correction.
Final thoughts
In summary, the EUR/USD is currently respecting a bullish parallel channel on the 4-hour timeframe, with upward moves consistently leaving and then filling 4H FVGs before continuing higher. The 1.1766 level is pivotal, a sustained break above it favors continued bullish momentum, while a rejection and breakdown from the channel could signal a bearish reversal. Traders should closely monitor price behavior around this key level and the integrity of the ascending channel to anticipate the next significant move.
-------------------------
Disclosure: I am part of Trade Nation's Influencer program and receive a monthly fee for using their TradingView charts in my analysis.
Thanks for your support. If you enjoyed this analysis, make sure to follow me so you don't miss the next one. And if you found it helpful, feel free to drop a like 👍 and leave a comment 💬, I’d love to hear your thoughts!

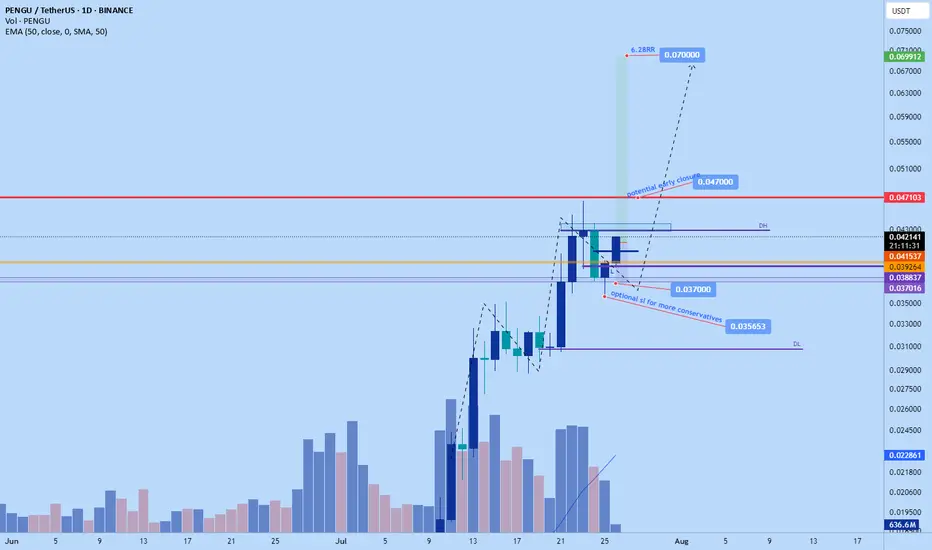
Pengu weekend swing longJust now opened a swing long position on pengu. Targeting $0.07
However if market starts rejecting $0.047 might have to exit earlier.
Time sensitive I don't think this one will pullback much we have some ground to cover
SL: $0.037
GBPJPY Potential UpsidesHey Traders, in the coming week we are monitoring GBPJPY for a buying opportunity around 197.900 zone, GBPJPY is trading in an uptrend and currently is in a correction phase in which it is approaching the trend at 197.900 support and resistance area.
Trade safe, Joe.

USDJPY: Confirmed CHoCH & Bullish OutlookI spotted a confirmed Change of Character on 📈USDJPY on 4-hour timeframe.
The market, currently in a global bullish trend, has effectively broken through a minor bearish trend and surpassed a key horizontal resistance level.
It is likely to continue rising, with the next resistance at 149.00.

EURAUD is currently showing signs of a bearishEURAUD is currently showing signs of a bearish trend continuation. Despite short-term upward movement driven by optimism around the ECB, the overall structure remains vulnerable to downside pressure.
The European Central Bank (ECB) is expected to keep interest rates unchanged, potentially ending a seven-year streak of cuts. While this could bring temporary strength to the Euro, the technical setup still favours the bears.
Watch for a Break Below the Neckline
If price manages to break below the neckline of the current pattern, it could trigger a strong bearish move. First support: 1.77100 Second support: 1.76300
You May find more details in the chart.
Ps: Support with like and comments for more analysis.

EURJPY: Correction is Over?!It seems like 📈EURJPY has finished consolidating within a broad horizontal channel on the 4H chart.
The formation of a new higher high today suggests potential upward movement.
Since it's Friday, I recommend considering trend-following buys starting Monday.
We should wait for the market to close above the highlighted resistance to establish a Higher Close on the daily chart.
Look to buy after a pullback, targeting 174.00 as the initial goal.

Is the gold correction over?✏️Yesterday's D1 candle closed above the Breakout 3363 zone. This shows that the buyers in the US session are still strong. There is a possibility of a liquidity sweep in the Tokyo and London sessions, then in the New York session, Gold will recover and increase again. The uptrend is really broken when Gold confirms a close below 3345. In this case, we have to wait for 3320 to confirm the BUY point. The gold uptrend at this time also needs new momentum to be able to move towards ATH 3500.
📉 Key Levels
Support: 3345-3320
Resistance: 3373-3418
Buy zone: 3345 (bullish wave structure maintained); BUY DCA break 3373
Buy zone: 3320 (Strong support zone)
Target: 3417
Leave your comments on the idea. I am happy to read your views.

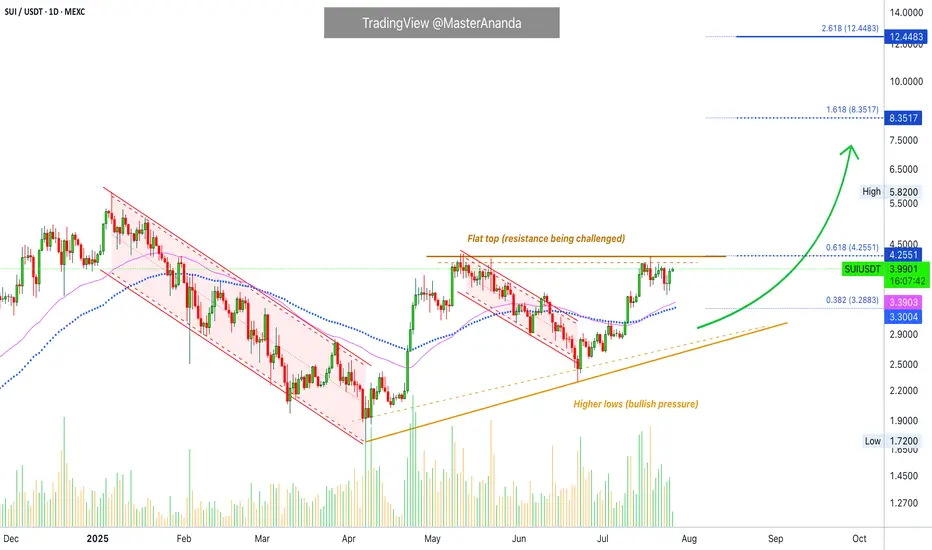
Sui Works To Break Resistance · Play To Win · No StressA flat bottom is bullish because support can be confirmed as found when sellers (bears) fail to move prices past a certain point. A flat bottom produces the double-bottom and triple-bottom reversal signals. When the bottom is flat, depending on the phase the market is going through, we can easily say bullish. A flat top is not bearish, it is a completely different story.
A flat top does not confirm resistance being found and thus a new bearish wave. We need context, it all depends on the phase of the market cycle. A flat top with a rising bottom is bullish. Resistance has been found and is being challenged. It is getting weaker because the action is converging towards the resistance point based on the rising bottom.
Here we have a flat top with a rising bottom (higher lows). The market is bullish. SUIUSDT has been bullish and growing since late 2024. This is the content we need. A bullish tendency, a rising market and resistance being challenged more than once starts to reveal a picture. Next this resistance won't have enough strength to hold. Next time SUI moves up it will continue rising to produce a new all-time high and this will unleash a price discovery phase.
SUIUSDT is trading above EMA55 and EMA89. The last challenge of resistance produced a rejection but this rejection did not lead to a test of the above mentioned support. Another signal of strength.
Sellers cannot push prices lower because buyers are active, or simply put, there are not enough sellers to start and thus the retraces become smaller and shorter. Price dynamics favoring the bulls.
The lows are getting higher, the top remains the same. When the low meets the top that is when resistance breaks. Sui is going up, it will continue to grow; the targets on the chart can be hit short-term.
There is no sense of urgency, but a major advance can be happening within days.
Are you ready to trade and hold? Prices going up aiming high trading requires no effort.
The effort is mental, the mind can be trained to succeed and avoid stress. Mental stress = lack of knowledge. If you know prices are going up and you feel certain about it, no effort is required to win because the mind doesn't have to struggle with questions relating to the strength of your position. The mind does not need to answer, should I buy or should I hold? Since you know prices are going up based on the chart, you can sit back and relax watching your profits grow. Reading relaxes the mind. Knowledge is food for the soul. The more you learn, the more you know the wiser you become. Wise means effortless. Trading can be effortless if you read the right stuff. Play to win. Plan before trading and you already won.
Answer the question before the situation shows up. That's it, you've just removed the complexity out of the game. When there is no complexity, there is no mental stress. Since you are sitting on a chair in front of a device, trading becomes effortless. To trade with peace in your mind you just need the right knowledge and that is what you are getting here. No stress.
Continue reading and watch your profits grow. Increase your peace, free up your time and enjoy better results.
Namaste.
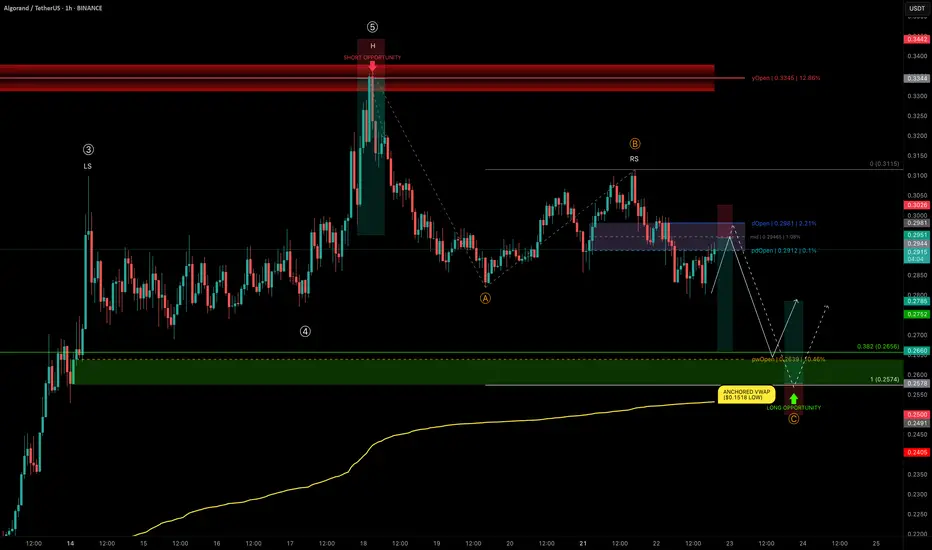
ALGO rejects at yOpen — Mapping High-Conviction Trade ZonesALGO has delivered an impressive +124% rally from $0.1518 to $0.336 in just 25 days, completing a 5-wave Elliott impulse right into the yearly open resistance.
We are now in a correction phase, and the current structure is showing a head and shoulders pattern, with the right shoulder currently forming.
Let’s break down the key levels and setups.
🧩 Technical Breakdown
➡️ ABC Corrective Structure:
Targeting wave C near the trend-based fib extension (TBFE) at $0.2574
➡️ Fib Retracement Confluence:
0.382 retracement of the entire 5-wave move → $0.2656
Previous weekly open (pwOpen) → $0.2639
Liquidity pocket likely to be swept
Anchored VWAP from the $0.1518 low (start of the bullish trend) → currently at $0.2532, acting as a major support layer
Conclusion: Long opportunity zone between $0.2656–$0.2574
Trade Setups
🔴 Short Setup:
Why? ALGO has lost dOpen and pdOpen — a bearish sign for downward continuation.
Entry Zone: Between dOpen and pdOpen
Stop-loss: Above dOpen
Target (TP): 0.382 fib retracement (~$0.2656)
R:R: ≈ 1:3.5
🟢 Long Setup:
Entry Zone: Laddered Entries between $0.2656–$0.2574
Stop-loss: Below anchored VWAP (~$0.2532)
Target (TP): ~$0.2785+
R:R: ≈ 1:2.65
🛠 Indicator Note
I’m using my own indicator called "DriftLine - Pivot Open Zones " for this analysis, which I recently published.
✅ Feel free to use it in your own analysis!
Just head over to my profile → “Scripts” tab → apply it directly to your charts.
💡 Educational Insight: Why Confluence Matters
High-probability trades aren’t based on just one tool or level — they come from confluence, where multiple signals align: fib levels, VWAP, liquidity pools, price structures , and key levels.
For example, in this ALGO setup, it’s not just the fib retracement or just the VWAP — it’s the stacking of all these elements together that creates a precise zone with a better statistical edge.
✍️ Lesson: Don’t chase trades off single signals; stack tools for confirmation.
Patience, confirmation, and confluence — as always, the keys to high-probability setups. 🚀
_________________________________
💬 If you found this helpful, drop a like and comment!
Want breakdowns of other charts? Leave your requests below.

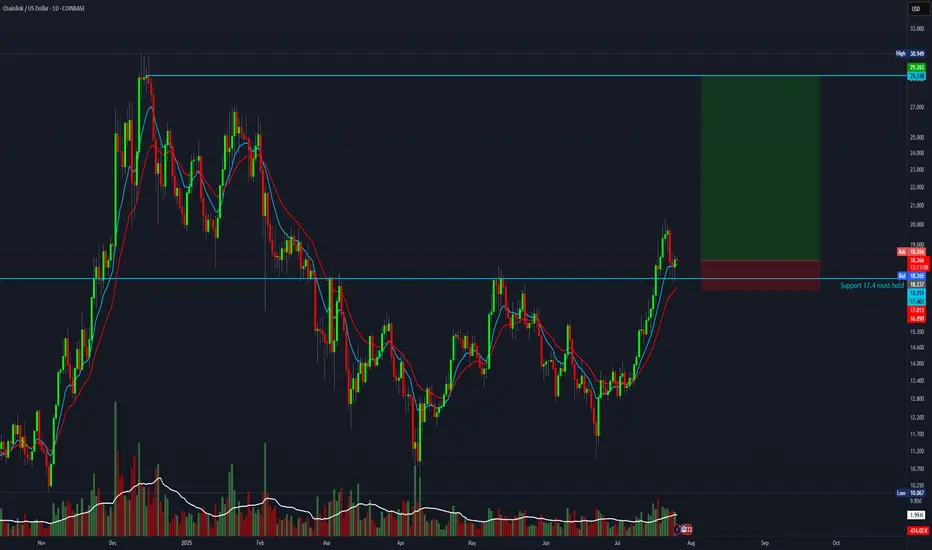
8 R setup for ChainlinkBTC is about to flip upwards. This is the chance to take a high-reward trade with an 8:1 risk-to-reward ratio.
Entry: 18.23
Stop-loss: 16.8
Target: 29
SOUN is about to enter the Wyckoff Markup phaseThis is a classic Wyckoff setup—accumulation, SOS, then a shallow pullback on dead volume.

Everyone's Bullish On Robinhood - But Its Time To SellRobinhood NASDAQ:HOOD has seen an incredible rally over the past year, rising more than 500% since August 2023. Much of this surge has been driven by renewed crypto enthusiasm—sparked by Circle’s IPO—and Robinhood’s aggressive push into new products across fintech and crypto.
But despite strong financial performance, we now believe the stock has run too far, too fast.
💰 Strong Fundamentals, But Slowing Growth
Robinhood’s recent financials are undeniably impressive:
Trailing 12-month revenue: $3.27B (up ~60% YoY)
Net income: $1.59B
Operating income: $1.2B
Revenue from commissions and interest income has outpaced expenses, resulting in high margins. But looking ahead, earnings-per-share (EPS) growth is expected to slow. Analysts forecast mid-teens EPS growth in 2026 and 2027, with a potential dip this year as one-time tax benefits roll off.
Robinhood Gold, the company’s premium service, is growing steadily (ARR projected to top $250M this year), but it’s still a small slice of total revenue.
🛠️ Product Expansion or Strategy Drift?
Robinhood is launching a wide array of new offerings—from robo-advisors and AI tools to crypto products in Europe and futures trading in the U.S.
The issue? These launches feel disjointed. U.S. users get a full-featured experience with stocks, options, crypto, and banking tools. UK users are limited to U.S. stock trading, with balances held in USD. In Europe, Robinhood leans heavily into crypto.
While the company claims it’s building a “global financial ecosystem,” the rollout has been inconsistent and confusing. This scattered approach may dilute brand clarity and user trust.
📊 Valuation: Sky-High and Hard to Justify
At current prices, HOOD trades at:
26x revenue
54x trailing earnings
74x forward earnings
At over 45x FY3 earnings, higher than fintech peers like SoFi (29x), Etoro (20x), and Interactive Brokers (27x)
The only comparable valuation is Coinbase (COIN), which has a more dominant position in crypto and stronger institutional traction. Given that most of HOOD’s revenue still comes from traditional brokerage services, this crypto-fueled valuation seems overblown.
🚨 Bottom Line
Robinhood remains a promising long-term company, but its stock looks overheated. Slowing earnings growth, a scattered international strategy, and a sky-high valuation point to limited upside from here.
Verdict: Sell
Investors sitting on big gains may want to take some profits while the euphoria lasts.

XAUUSD: Bearish Bias SetupI am watching for a possible reversal in XAUUSD, predicting a rejection with a downside target around 3.300.
This downside target is reasonable based on this setup, as it is based on a previous bullish move, from which price could find support and bounce, or break below, and the downside momentum could start to continue down.
I am just sharing my thoughts on the chart, this is not financial advice. Always confirm your setup and manage your risk accordingly.

VIRTUALUSDT – Is the Wedge Nearing Its End? A Breakout Could!⏳ Current Situation:
VIRTUALUSDT is approaching a crucial moment after months of sideways price action. Following a steep decline from its all-time high ($5.25), price action has formed a Falling Wedge pattern — a well-known bullish reversal formation.
Now, as price consolidates toward the wedge's apex, the potential for a breakout grows stronger with each passing day.
---
📌 Pattern Structure:
Pattern: Falling Wedge (Bullish Reversal)
Duration: Since May 2025 (multi-month)
Support line: Ascending slope, catching lower dips
Resistance line: Descending pressure trendline
Price action: Trapped inside the wedge, signaling accumulation and shrinking volatility
This structure suggests that a large move may be right around the corner.
---
🔼 Bullish Scenario (Breakout):
If VIRTUALUSDT successfully breaks above the upper wedge boundary (~$1.70), the following key resistance levels could become major bullish targets:
1. $2.08 – Initial breakout confirmation level
2. $2.45 – Key resistance zone; breakout could accelerate here
3. $3.76 – Strong historical supply area
4. $4.62 – Major previous resistance
5. $5.25 (ATH) – Long-term bullish target if strong momentum follows
💡 Tip: A volume spike on the breakout adds confirmation and reduces the risk of a false breakout.
---
🔽 Bearish Scenario (Breakdown):
If the price fails to break out and instead falls below the wedge support (~$1.40):
1. Look for support near $1.20 – $1.10
2. Further downside could lead to $0.70 – $0.50
3. The ultimate support lies around $0.41, the current all-time low
⚠️ Note: A breakdown without volume can be a fakeout. Always wait for confirmation.
---
🎯 Conclusion & Strategy:
> VIRTUALUSDT is coiling inside a falling wedge pattern — typically a prelude to an explosive move. Whether bullish or bearish, the breakout direction will offer a strong trading opportunity.
Suggested Strategy:
Watch for breakout + volume confirmation before entering
Place tight stop-loss below wedge support if buying the breakout
Set tiered take-profits based on horizontal resistance zones
#VIRTUALUSDT #AltcoinBreakout #FallingWedgePattern #CryptoSetup #BullishReversal #BreakoutWatch #AltcoinAnalysis #CryptoTechnical #VolumeBreakout

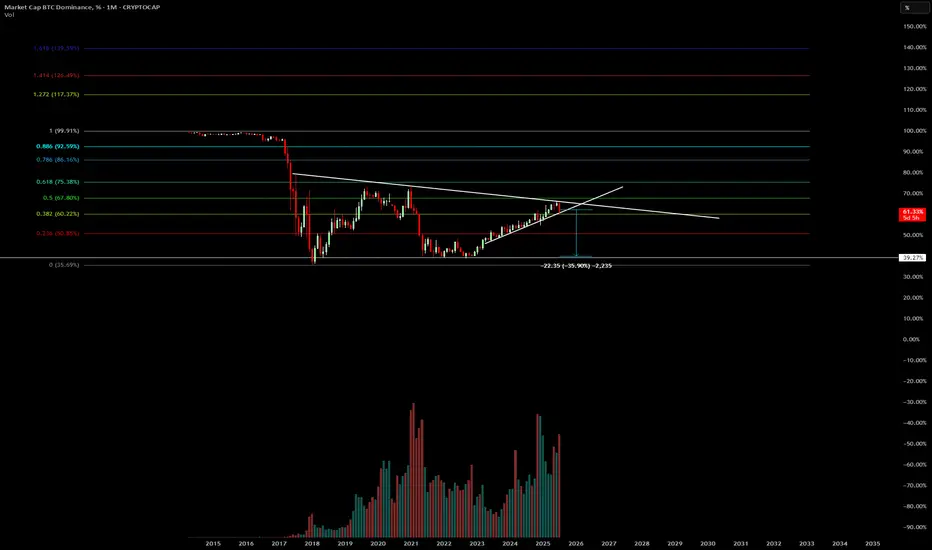
Bitcoin Dominance Topping Out? Bitcoin dominance ( CRYPTOCAP:BTC.D ) may be hitting a cycle top, signaling a potential major shift in capital rotation across the crypto markets.
Historically, when Bitcoin dominance peaks, we tend to see:
🔄 A rotation of capital into altcoins
🚀 Explosive rallies in ETH, SOL, and mid-cap alts
💰 Increased retail speculation and trading volume across DeFi and meme coins
Previous cycle tops in BTC dominance (e.g., 2017, 2021) preceded major altcoin seasons, with dominance falling sharply while total crypto market cap continued to grow.
⚠️ A rejection at key resistance (like the 200-week MA or golden fib levels) could confirm a reversal, hinting that altseason is around the corner.
💡 Keep an eye on:
ETH/BTC breakout potential
Total3 (crypto excluding BTC & ETH) trends
Risk-on sentiment and social metrics
Will history repeat? Or is this cycle different?
📈 Chart shows confluence of horizontal resistance, weakening RSI, and declining momentum on BTC.D.
Not financial advice. Always DYOR. Use proper risk management.
Losing over and over again? Losing over and over again? The problem isn’t your strategy – it’s your mind.
Let’s be honest:
Are you repeating the same old mistakes… even though you know they’re wrong?
You know you shouldn’t enter a trade without confirmation – but you still do.
You know you should stick to your stop-loss – but you move it.
You know your mindset is unstable today – but you still open the chart and… click.
So stop blaming the market.
You’re not losing because the market is cruel.
You’re losing because you can’t control yourself.
💣 The most dangerous psychological trap: Knowing it's wrong – but doing it anyway
It’s not because you lack knowledge.
It’s not because your system doesn’t work.
It’s because your emotions are running the show.
Ask yourself:
Have you ever traded just to escape boredom, helplessness, or emotional emptiness?
Have you ever used the chart to hide from real-life pressure?
Have you ever placed a trade just to relieve stress?
If your answer is yes... then the problem isn’t technical.
It’s psychological – and deeper still, it’s emotional.
👹 The 3 emotional demons controlling your trading – and you don’t even realise it
1. FOMO – You fear being left behind more than you desire to win
You see price running → you see others making money → you feel the pressure.
You think: “I can’t miss this move!”
→ You jump in impulsively, without analysis.
FOMO reflects a lack of trust in yourself.
You don’t believe more opportunities will come.
You’re not trading with clarity – you’re reacting from fear.
2. Revenge Trading – You can’t accept the feeling of being “wrong”
Every loss feels like humiliation.
You can’t handle being “mistaken.”
So you fight the market back – like someone who’s lost all reason.
But the market doesn’t care if you’re hurt.
You’re projecting your frustration onto a system that has no emotion.
→ In that moment, you’re no longer a trader – you’re a gambler trying to ease emotional pain.
3. Overtrading – You measure your worth by how many trades you win
You only feel valuable when you’re making money.
You hate “doing nothing” – it makes you feel useless.
So you keep trading – endlessly, irrationally.
Overtrading reflects a deep fear of stillness and lack of control.
You seek validation… from your trading account.
🔍 Painful truth: You’re not losing because of the market – you’re losing because of unrealistic expectations
You expect to always be right.
You expect to get rich quickly.
You expect to prove something – to others and to yourself.
You pressure yourself to perform – and when results don’t come, your psychology collapses.
You’re not trading to beat the market.
You’re trading to fix something inside yourself.
✅ The solution? It’s not more knowledge – it’s emotional honesty
Stop trading the moment you feel out of control – whether you're winning or losing.
Keep an emotional journal daily – even on days you don’t trade. Be raw. Be real. No excuses.
Ask the right questions:
Am I trading to make money – or to soothe an emotional void?
Am I entering because of a setup – or because I’m afraid of missing out?
Do inner work outside of trading: meditate, exercise, heal emotionally, take breaks, talk to someone who gets it.
💬 Final thought:
Losing isn’t scary – what’s scary is never facing the real reason behind your losses.
Stop searching for the next shiny indicator.
Stop chasing strategies with a “90% win rate.”
You just need a decent system – and a strong mind to execute it.
True success comes when you no longer use trading to prove yourself –
but treat it like a calm, patient profession.
#TradingPsychology #EmotionalDiscipline #FOMOTrading #RevengeTrading #Overtrading
#MindsetMatters #TraderGrowth #SelfAwareness #TradingUK #ForexEducation #InnerGameOfTrading #ConsistencyIsKey #MentalEdge

Nifty has broken Hoz support, Trendline & Rising Triangle.Nifty has broken Hoz support, Trendline & Rising Triangle. It may fall to liquidity support level of 24400, before resuming its upward trajectory.

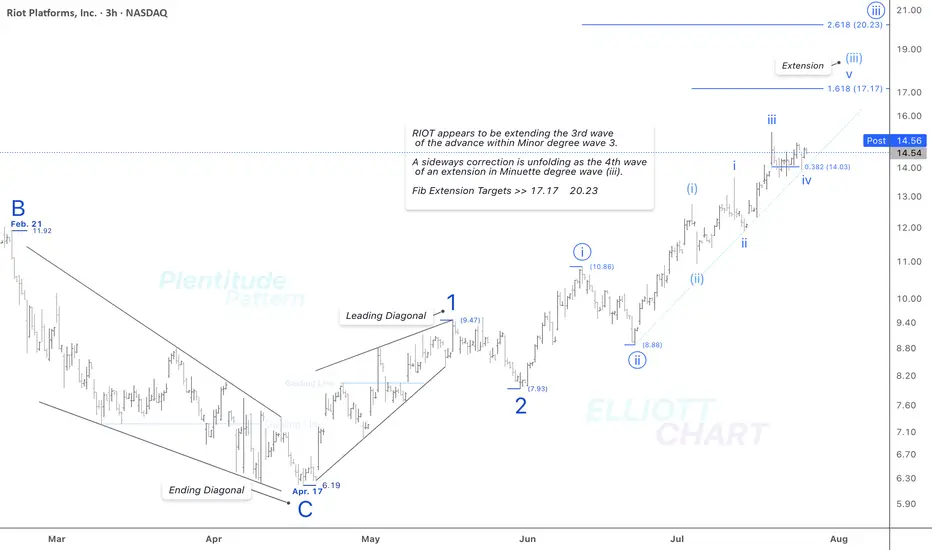
RIOT / 3hAs illustrated on the 3-hour chart above, NASDAQ:RIOT appears to be extending the third wave of an impulsive advance within Minor degree wave 3.
And as anticipated, a sideways correction is unfolding as the fourth wave of the ongoing extension in Minuette degree wave (iii).
Fib Extension Targets >> 17.17 & 20.23.
>>> In this timeframe, I'm analyzing the initial rising tide within the ongoing Intermediate degree wave (1), where a nested series of waves have quite well revealed: 1, 2 → i (circled), ii (circled) → (i), (ii) → i, ii. The extreme high of this impulsive sequence lies beyond the visible range of the current chart.
NASDAQ:RIOT CRYPTOCAP:BTC BITSTAMP:BTCUSD MARKETSCOM:BITCOIN
#CryptoStocks #RIOT #BTCMining #Bitcoin #BTC
pull back of HK50 1. bearish BOS
2. after the bearish breakout retest did not go back to the last breakout momentum.
3. tend to sell around 25417 and TP 25212

SBET – Holding the Key Zone for a Potential SqueezeSBET – Holding the Key Zone for a Potential Squeeze 🚀🔥
SBET is sitting at a critical support zone (21.0–21.3), right inside the 0.382 Fibonacci retracement. VolanX signals accumulation as volume cools down, setting up for a possible next leg higher.
Key Levels to Watch
Support: 21.0 – 21.3 (Fib 0.382 + structure base) 🛡️
Breakout Zone: 24.8 – 27.8 (Fib 0.5 – 0.618) ⚡
Targets: 33.0 – 36.0 🎯 | Long-term squeeze zone: 51.5 – 64.0 🏆
VolanX Signal
Bullish Bias: As long as 21 holds, liquidity favors upside.
Volume Clue: High spikes suggest prior distribution is cooling, potentially loading for a run.
Momentum Trigger: Close above 24.8 confirms buyers stepping in.
Risk Management
Stop-Loss: 20.4 (below structure) ⛔
Scale Strategy: Add on confirmation above 24.8 and 27.8 to ride the trend.
Profit Zones: 27.8 (TP1) → 33–36 (TP2) → 51+ (runner target).
Question: Are we seeing a base for another SBET explosion or just a pause before deeper discount?
#SBET #Fibonacci #VolanX #TradingView #BreakoutWatch #LiquidityFlow 🚀📊
SBET – VolanX Probabilistic Targets (1–3 week horizon)
For informational/educational purposes only. Not financial advice.
📈 Bullish Paths
P1: Bounce to 24.8–25.5 (Fib 0.5 / structure reclaim) → 58%
Trigger: 21.0–21.3 holds + momentum close above intraday VWAP.
P2: Extension to 27.8 (0.618) / first supply → 38%
Trigger: Clean acceptance >24.8 with rising volume & improving tape.
P3: Squeeze into 33–36 (0.786–0.886 + supply) → 24%
Trigger: Options/flow flip long (OTM calls clustering) + BOS over 27.8.
P4: Parabolic leg to 51.6–64.2 (1.382–1.786) → 10%
Trigger: Narrative + liquidity vacuum (low float + IV expansion).
(Probabilities are conditional—each higher target assumes confirmation of the one before it.)
📉 Bearish Paths
N1: Slip under 21 → 18.2–19.0 (0.309/discount shelf) → 27%
Trigger: Failure to defend 21 with increasing sell volume.
N2: Deeper flush to 16.6 (0.236) zone → 17%
Trigger: Persistent risk-off / liquidity drain, IV spike without demand.
N3: Capitulation toward 13.1 (0.146) / prior demand → 6%
Trigger: Macro shock or failed financing/newsflow, liquidity gap.
🧠 VolanX Read (today)
Bias slightly bullish as long as 21.0–21.3 holds. The engine scores Path P1 > P2 > N1. Expect chop → impulsive move once 24.8 is cleanly reclaimed or 20.4 is lost.
🛡️ Risk Management
Invalidation (swing): Daily close < 20.4.
Sizing: 0.5–1.0% account risk; micro-cap jump risk.
TP ladder: 24.8 ➜ 27.8 ➜ 33–36 ➜ leave runner for 51+.
Adjust: Move to BE after 24.8 reclaim; trail under last 4h HLs.

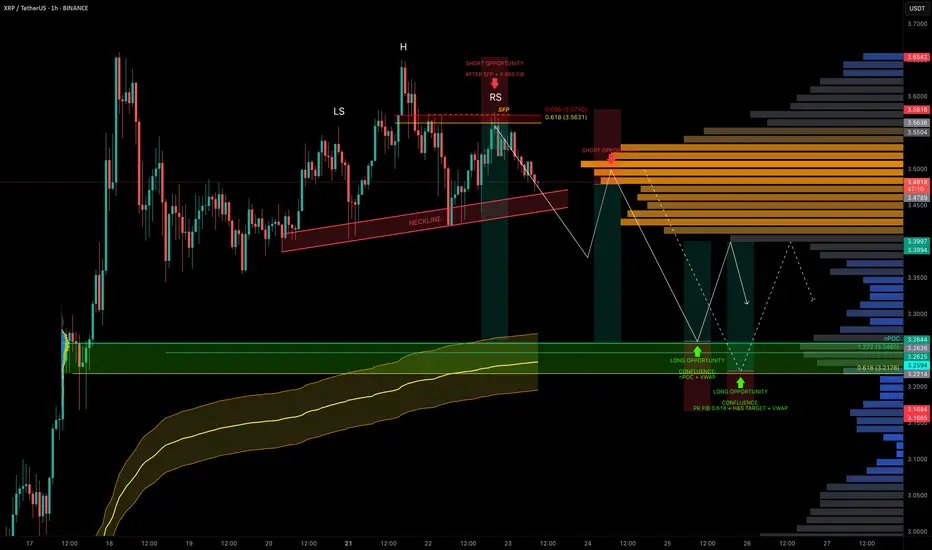
XRP Coiled in Range — Liquidity Below, Trade Setups AheadXRP has been stuck in a trading range around $3.50 for the past 5 days, offering multiple trade opportunities within the chop.
A notable short was triggered after a swing failure pattern (SFP) at the 0.666 fib retracement level near $3.563.
Now, with liquidity building to the downside, we’re watching closely for the next high-conviction setups.
🧩 Current Structure & Short Setup
🔴 Short Opportunity (Triggered):
SFP + 0.666 fib retracement at $3.563 led to rejection.
Market now shows a head & shoulders pattern forming.
Target: $3.2176 (0.618 fib retracement).
Trigger: Watch for a neckline break + retest for short confirmation.
Stop-loss: Above the right shoulder.
🟢 Long Setup:
Watching for a high-probability long around:
$3.26 → nPOC + 1.272 TBFE
$3.23 → anchored VWAP bands
This zone offers strong confluence and could act as the next launchpad.
Long Trade Plan:
Entry Zone: potential entries between $3.26–$3.22, price action needed for confirmation
Stop-loss: Below swing low at $3.1675
Target (TP): ~$3.40
✍️ Plan: Set alerts near the lows and react to price action at the zone — don’t front-run, let structure confirm.
💡 Pro Tip: Trade the Confluence, Not the Emotion
High-probability trades come from confluence, not guessing.
This setup combines nPOC, TBFE, VWAP, fib levels, and classical market structure (H&S) to map precise zones for both longs and shorts.
Let price come to you and wait for confirmation — especially in a rangebound environment where liquidity hunts are frequent.
Final Thoughts
We’re still rangebound, but liquidity is building below.
Keep an eye on the $3.26–$3.22 support zone for long entries and the H&S neckline for short breakdown confirmation.
_________________________________
💬 If you found this helpful, drop a like and comment!
Want breakdowns of other charts? Leave your requests below.