Long trade www.tradingview.com
🟢 Buyside Trade
Pair: LINKUSD
Date: Saturday, 5th July 2025
Time: 8:00 PM
Session: Tokyo Session PM
Time Frame: 4Hr TF Entry
🔢 Trade Metrics
Entry Price: 13.161
Take Profit (TP): 25.814 (+96.14%)
Stop Loss (SL): 12.984 (−1.34%)
Risk-Reward Ratio: 70.32: 1
📈 Chart Analysis
Structure: Price broke the previous consolidation zone and retested key support levels near the 13.16 area before launching upward.
Indicators:
200 WMA (Yellow) & 50 EMA (Blue) both support continuation.
Break of market structure confirmed prior resistance as new support.
Trend Analysis

SPX 6500 6666 7000Hello Traders,
Here is my latest Fib, Channel, Trendline, and Price Targets SPX Timeline. Lets see how this plays out.

BLDE – VolanX Smart Cycle Activation📈 BLDE – VolanX Smart Cycle Activation
Timeframe: Weekly
Posted by: WaverVanir International LLC | VolanX Protocol
Model: Accumulation → Manipulation → Expansion
After multiple Breaks of Structure (BOS) and prolonged markdown, BLDE has now confirmed a Smart Money Accumulation Cycle. A clear manipulation sweep below prior lows has triggered the upside phase. This chart follows the classic SMC model with:
🔹 Accumulation → Trap → Manipulation → Expansion
🔍 Key Observations:
Accumulation zone: $2.00–$4.00
Trap high: ~$5.00 (liquidity run & rejection)
Clean reclaim of $3.92 structure now acting as launchpad
Next zones of interest:
• $6.35
• $6.58
• $6.76
• Ultimate distribution zone: $9.90
📊 VolanX Thesis:
We are entering a Mark-Up Phase consistent with the VolanX Alpha Expansion Model. As liquidity rotates upward, expect a stair-step climb toward the equilibrium zone near $9.90.
🧠 Strategic Insight:
If price pulls back into the $3.92–$4.10 range, that would be considered a high-probability re-entry for bulls aligned with institutional footprints.
🛡️ Risk Lens:
Monitor for early distribution at $6.76. VolanX Guardian Protocol flags rising volume anomalies in that range.

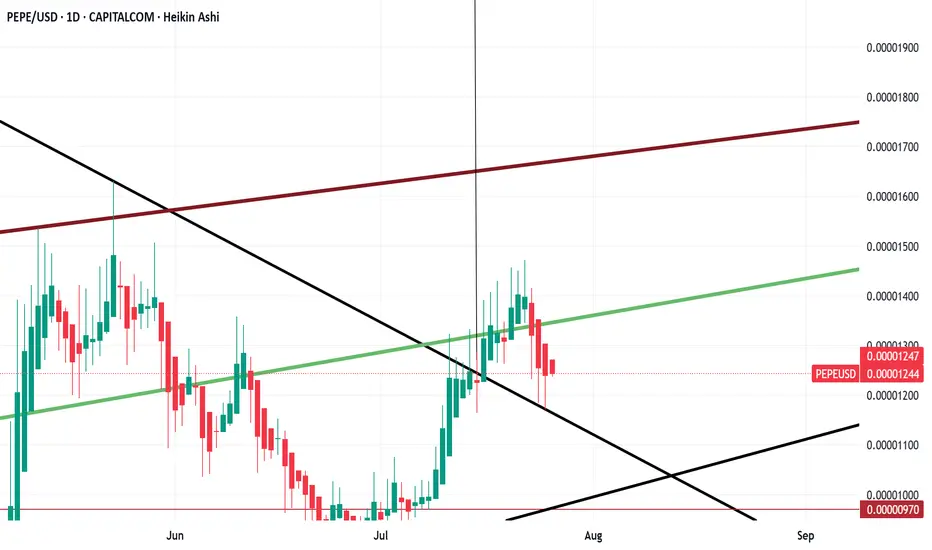
Is this a perfect retest?If this is a perfect retest... expect to see 0,0004$ in a few months. My guess is that we are watching history now and Pepe will make severals new ATH soon.
Gold in Demand Zone | Target $3,380🚨 GOLD/USD – BIG MOVE LOADING! 🚨
🔍 Price is currently reacting from a major demand zone ($3,340–$3,345) with signs of accumulation and a possible double bottom pattern forming.
📉 After a strong downtrend, this looks like a liquidity sweep and smart money trap — prepping for a reversal back to the $3,380 resistance zone where liquidity resides.
📈 Scenarios to Watch:
1️⃣ Price sweeps support again and reverses hard
2️⃣ Clean structure break above $3,365, followed by a retest
🎯 Target: $3,380–$3,385
🛡️ Invalidation: Strong close below $3,335
⚠️ Confirmation Required! Best entry would be after structural break + retest. Keep your risk tight, and let the market show its hand.
⸻
📌 Key Levels:
• Support Zone: $3,340–$3,345
• Target Zone: $3,380–$3,385
• Invalidation: Below $3,335
⸻
📣 If this setup helps you, like 👍, comment 💬, and follow 🔔 for more high-probability ideas every week!
#Gold #XAUUSD #SmartMoney #LiquidityGrab #ForexSetup #PriceAction #BreakoutTrade #DoubleBottom #TradingView #GoldAnalysis #ForYou #FXStrategy #SupplyAndDemand

Lingrid | GOLD Corrective Move: Potential Long Trade OpportunityThe price perfectly fulfilled my last idea . OANDA:XAUUSD is pulling back sharply after facing rejection from the key resistance level at 3431, following a two-leg impulse wave. The structure shows a correction within an active uptrend, nearing confluence support from the upward trendline and horizontal level. As long as price holds above 3342, a bounce and continuation toward 3400 remain the favored scenario. Broader bullish structure and momentum buildup point to a possible resumption after the current retracement.
📉 Key Levels
Buy trigger: Break above 3350
Buy zone: 3345 – 3340
Target: 3400
Invalidation: Break below 3320
💡 Risks
Failure to hold the upward trendline could shift momentum
Weak bounce may trap buyers before real breakout
Resistance at 3400 could remain firm without stronger volume support
If this idea resonates with you or you have your own opinion, traders, hit the comments. I’m excited to read your thoughts!

SILVER Analysis - Can buyers push toward 4,100$?TRADENATION:XAGUSD is trading within a clear ascending channel, with price action consistently respecting both the upper and lower boundaries. The recent bullish momentum indicates that buyers are in control, suggesting there's chances for potential continuation on the upside.
The price has recently broken above a key resistance zone and now came back for a retest. If this level holds as support, it would reinforce the bullish structure and increase the likelihood of a move toward the 4,100 target, which aligns with the channel’s upper boundary.
As long as the price remains above this support zone, the bullish outlook stays intact. However, a failure to hold above this level could invalidate the bullish scenario and increase the likelihood of a deeper pullback.
Remember, always confirm your setups and use proper risk management.
Disclosure: I am part of Trade Nation's Influencer program and receive a monthly fee for using their TradingView charts in my analysis.

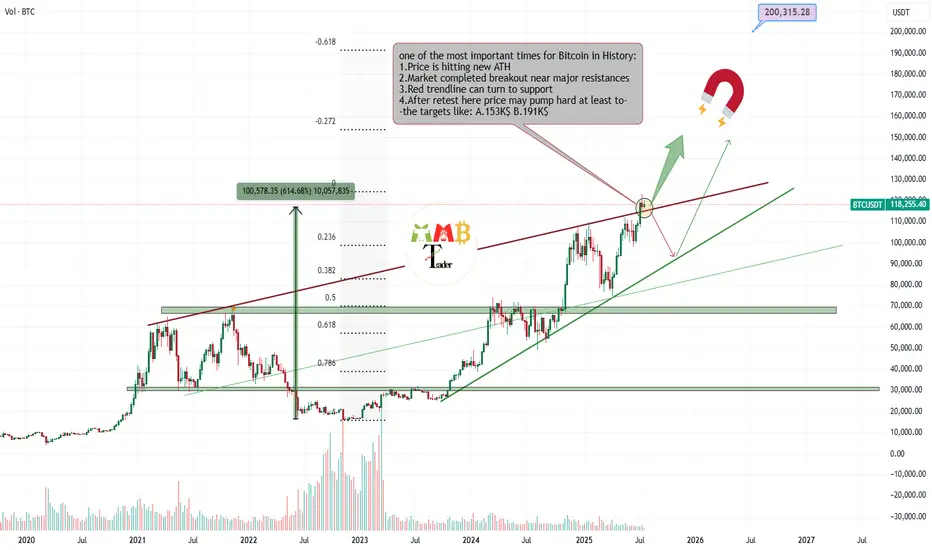
Bitcoin is retesting Critical zone for targeting almost 200K$Most traders around world now don't know what to do with their own trades or spot holdings, because some are in profit and how doubt of more pump and are still holding and some others miss this massive pump and think it can rest and fall now and it is not a good time to enter long.
And many other questions and thoughts At this time is simply check the chart and do these simple steps which are some mentioned and some not due to huge content.
Delete all of my previous drawings and start new Charting the price and see new trendlines or supports and resistances formed.
Then technically check the volume and breakouts and ... once again and here for Bitcoin i still find out chart looks extremely bullish to me and at this orange zone which is price is getting a little slow some important things may happen.
30% is expecting price fall below red trendline again and see short-term fall.
70% is expecting price complete retest of breakout here or pump more ASAP and then hitting targes like 150K$ and more for $BTCUSDT.
DISCLAIMER: ((trade based on your own decision))
<<press like👍 if you enjoy💚
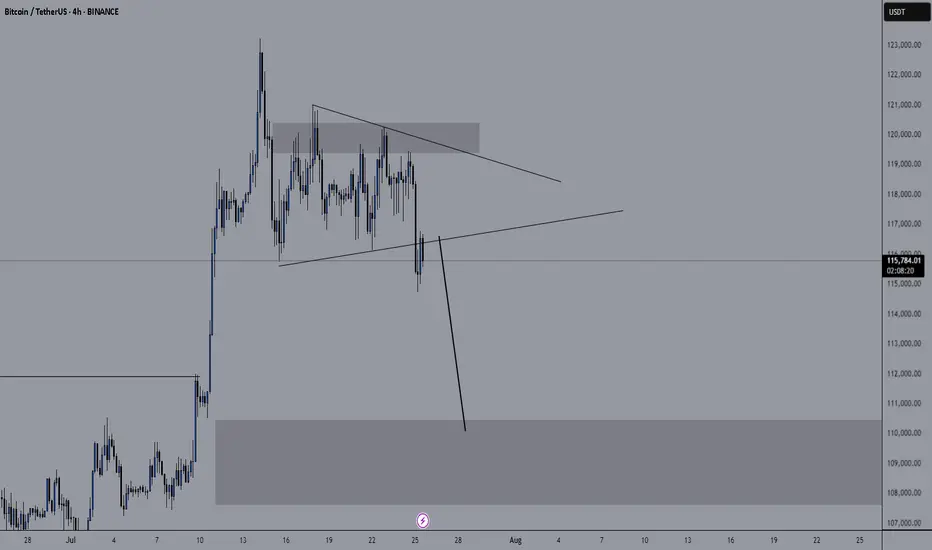
Consider a sales transaction.Hello friends
You can open a sell trade on the 4-hour time frame, but this is a risky trade.
You can open a trade with half a percent risk.
On the higher time frame, the trend is still up.
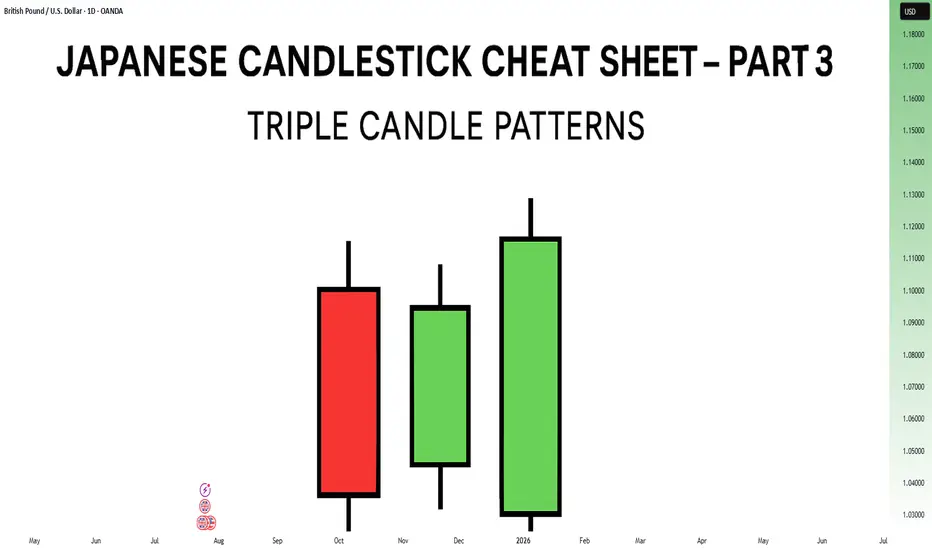
Japanese Candlestick Cheat Sheet – Part Three- 3 candle patternsSo far in this series, we've broken down single candle formations ( Part 1 ) and explored double candle signals ( Part 2 ) — the kind of patterns that give you quick, often powerful hints about the market’s mood.
But now it’s time to go a step further.
👉 In Part 3, we dive into triple candlestick formations — patterns that take more time to form, but often offer stronger confirmation and a more reliable narrative.
They’re like reading three full sentences from the market instead of just one or two words.
If you’re ready to spot momentum shifts (not noise), this lesson is for you.
Let’s decode the story behind formations like Morning Star, Three White Soldiers, and so on.
MORNING STAR
Bias: Bullish
What is the Morning Star pattern?
The Morning Star pattern consists of a bearish candle, a small-bodied middle candle, and a bullish candle, forming at the end of a downtrend to signal potential reversal. This pattern reflects a shift from seller dominance to buyer strength, as the middle candle marks a pause before a reversal. The Morning Star is a reliable signal that buyer interest is reemerging.
Understanding Morning Stars helps traders anticipate shifts in momentum, providing valuable entry points for new uptrends.
Meaning:
Found in downtrends; signals potential bullish reversal as buyers gain control, with strength confirmed by the third candle closing above the first.
BULLISH ABANDONED BABY
Bias: Bullish
What is the Bullish Abandoned Baby pattern?
The Bullish Abandoned Baby is a rare but powerful reversal pattern that consists of a bearish candle, a gapped doji, and a bullish candle. The middle doji reflects indecision, while the third bullish candle confirms the reversal. This pattern highlights a dramatic shift in sentiment, showing that buyers are prepared to take control.
Recognizing the Bullish Abandoned Baby can offer traders insights into pivotal market shifts.
Meaning:
Appears in downtrends; suggests a strong bullish reversal, as the middle doji shows indecision, with confirmation by a strong bullish move.
THREE WHITE SOLDIERS
What is the Three White Soldiers pattern?
The Three White Soldiers pattern consists of three consecutive bullish candles, each closing higher than the last, often appearing in downtrends to signal a potential bullish reversal. This pattern reflects sustained buying pressure, indicating that buyer sentiment is strong. Psychologically, it shows that buyers are steadily gaining confidence, pushing prices upward.
For traders, Three White Soldiers provide a clear signal of momentum, ideal for capturing emerging trends.
Meaning:
Found in downtrends; signals potential trend reversal, showing sustained buying strength, often signaling the start of a bullish trend.
MORNING DOJI STAR
What is the Morning Doji Star pattern?
The Morning Doji Star pattern is similar to the Morning Star, but with a doji as the middle candle, indicating greater indecision before a reversal. This pattern consists of a bearish candle, a doji, and a bullish candle, highlighting a transition from bearish to bullish sentiment. The doji reflects a moment when market sentiment is balanced, but the third candle confirms a bullish shift.
Interpreting Morning Doji Stars can help traders identify turning points in downtrends, providing valuable entry opportunities.
Meaning:
Appears in downtrends; signals potential bullish reversal, with indecision from the doji and confirmation by a strong bullish candle.
EVENING STAR
What is the Evening Star pattern?
The Evening Star is a three-candle pattern that appears at the top of an uptrend, signaling a potential bearish reversal. It consists of a bullish candle, a small-bodied middle candle, and a bearish candle, showing a transition from buyer control to seller strength. This pattern often appears at market peaks, where optimism is giving way to caution.
Understanding the Evening Star pattern helps traders anticipate downtrend formations, allowing them to time their exits.
Meaning:
Found in uptrends; signals potential bearish reversal as sellers gain control, confirmed if the third candle closes below the first.
BEARISH ABANDONED BABY
What is the Bearish Abandoned Baby pattern?
The Bearish Abandoned Baby is the bearish counterpart to the Bullish Abandoned Baby and consists of a bullish candle, a gapped doji, and a bearish candle. This pattern reveals a dramatic shift in sentiment from bullish to bearish, highlighting a sudden reversal at the top of an uptrend.
Recognizing the Bearish Abandoned Baby can offer traders insight into market tops and impending trend changes.
Meaning:
Appears in uptrends; indicates strong bearish reversal, as indecision in the doji is followed by selling strength.
THREE BLACK CROWS
What is the Three Black Crows pattern?
The Three Black Crows pattern consists of three consecutive bearish candles, each closing lower than the last, appearing in uptrends to signal potential reversal. This pattern reflects sustained selling pressure, indicating that sellers are gaining control. The Three Black Crows highlight a moment when buyer confidence wanes, marking the beginning of downward momentum.
For traders, this pattern provides a clear signal to avoid buying into weakening trends or even entering short trades.
Meaning:
Found in uptrends; signals potential bearish reversal, with sustained selling pressure often marking the start of a downtrend.
EVENING DOJI STAR
What is the Evening Doji Star pattern?
The Evening Doji Star is similar to the Evening Star, but with a doji as the middle candle, highlighting greater indecision. This pattern consists of a bullish candle, a doji, and a bearish candle, indicating a shift from bullish to bearish sentiment. The doji suggests that buyers are losing control, with sellers prepared to reverse the trend.
Understanding Evening Doji Stars allows traders to recognize market tops, helping them avoid overextended trends.
Meaning:
Appears in uptrends; signals potential bearish reversal, as the doji suggests indecision, confirmed by strong selling on the third candle.
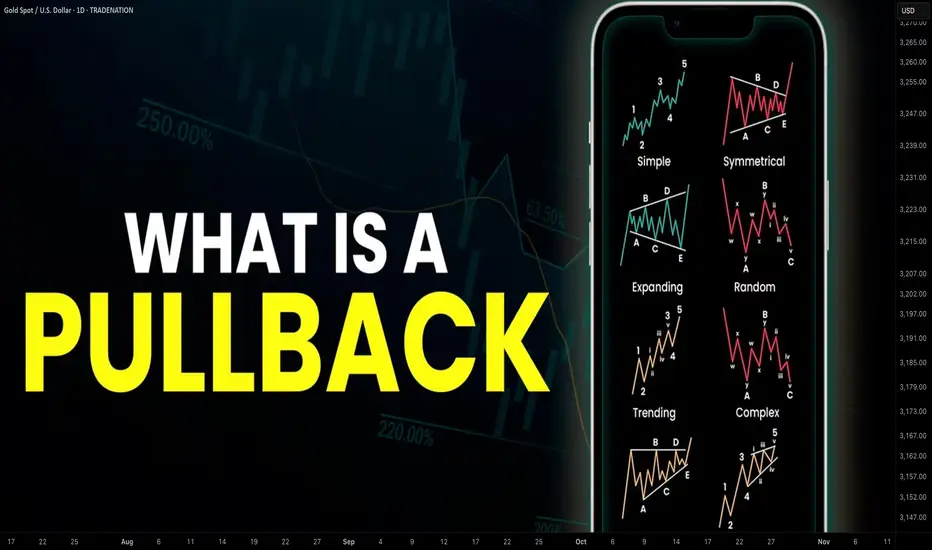
Learn What is PULLBACK and WHY It is Important For TRADING
In the today's post, we will discuss the essential element of price action trading - a pullback.
There are two types of a price action leg of a move: impulse leg and pullback.
Impulse leg is a strong bullish/bearish movement that determines the market sentiment and trend.
A pullback is the movement WITHIN the impulse.
The impulse leg has the level of its high and the level of its low.
If the impulse leg is bearish , a pullback initiates from its low and should complete strictly BELOW its high.
If the impulse leg is bullish , a pullback movement starts from its high and should end ABOVE its low.
Simply put, a pullback is a correctional movement within the impulse.
It occurs when the market becomes overbought/oversold after a strong movement in a bullish/bearish trend.
Here is the example of pullback on EURJPY pair.
The market is trading in a strong bullish trend. After a completion of each bullish impulse, the market retraces and completes the correctional movements strictly within the ranges of the impulses.
Here are 3 main reasons why pullbacks are important:
1. Trend confirmation
If the price keeps forming pullbacks after bullish impulses, it confirms that the market is in a bullish bearish trend.
While, a formation of pullbacks after bearish legs confirms that the market is trading in a downtrend.
Here is the example how bearish impulses and pullbacks confirm a healthy bearish trend on WTI Crude Oil.
2. Entry points
Pullbacks provide safe entry points for perfect trend-following opportunities.
Traders can look for pullbacks to key support/resistances, trend lines, moving averages or Fibonacci levels, etc. for shorting/buying the market.
Take a look how a simple rising trend line could be applied for trend-following trading on EURNZD.
3. Risk management
By waiting for a pullback, traders can get better reward to risk ratio for their trades as they can set tighter stop loss and bigger take profit.
Take a look at these 2 trades on Bitcoin. On the left, a trader took a trade immediately after a breakout, while on the right, one opened a trade on a pullback.
Patience gave a pullback trader much better reward to risk ratio with the same target and take profit level as a breakout trader.
Pullback is a temporary correction that often occurs after a significant movement. Remember that pullbacks do not guarantee the trend continuation and can easily turn into reversal moves. However, a combination of pullback and other technical tools and techniques can provide great trading opportunities.
❤️Please, support my work with like, thank you!❤️
I am part of Trade Nation's Influencer program and receive a monthly fee for using their TradingView charts in my analysis.
GBPCHFGBPCHF price is near the main support zone 1.07101-1.06714. If the price cannot break through the 1.06714 level, it is expected that the price will rebound. Consider buying the red zone.
🔥Trading futures, forex, CFDs and stocks carries a risk of loss.
Please consider carefully whether such trading is suitable for you.
>>GooD Luck 😊
❤️ Like and subscribe to never miss a new idea!

GOLD 1H CHART ROUTE MAP UPDATEHey Everyone,
Great finish to the week with our chart ideas playing out, as analysed.
We completed all our Bullish targets on this chart with ema5 cross and lock confirmation. We were also able to step away today after the final target with no further ema5 cross and lock, confirming the rejection that we are seeing now.
BULLISH TARGET
3356 - DONE
EMA5 CROSS AND LOCK ABOVE 3356 WILL OPEN THE FOLLOWING BULLISH TARGETS
3381 - DONE
EMA5 CROSS AND LOCK ABOVE 3381 WILL OPEN THE FOLLOWING BULLISH TARGET
3404 - DONE
EMA5 CROSS AND LOCK ABOVE 3404 WILL OPEN THE FOLLOWING BULLISH TARGET
3424 - DONE
EMA5 CROSS AND LOCK ABOVE 3424 WILL OPEN THE FOLLOWING BULLISH TARGET
3439 - DONE
We will now come back Sunday with a full multi timeframe analysis to prepare for next week’s setups, including updated views on the higher timeframes, EMA alignments, and structure expectations going forward.
Thanks again for all your likes, comments, and follows.
Wishing you all a fantastic weekend!!
Mr Gold
GoldViewFX

Lingrid | TONUSDT Potential Rebound from Support ZoneThe price perfectly fulfilled my last idea . OKX:TONUSDT is testing support after pulling back from the consolidation zone and forming a higher low above key structure. The chart shows a breakout from the downward trendline followed by a corrective retracement back toward confluence support. As long as price stays above 2.903, a bounce and renewed move toward 3.595 remains the base case. Structure favors bullish continuation after the retest of the breakout level.
📉 Key Levels
Buy trigger: Break and hold above 3.200
Buy zone: 2.903 – 3.050
Target: 3.595
Invalidation: Break below 2.903
💡 Risks
Failure to hold confluence of upward trendline and horizontal support
Weak follow-through above 3.2 could indicate distribution
Resistance at 3.595 may trigger renewed selling before breakout
If this idea resonates with you or you have your own opinion, traders, hit the comments. I’m excited to read your thoughts!

Are you ready for the BUY BTCUSD signal?✏️ The pennant pattern is forming. After BTCUSD reached a new peak, the past 1 week, BTC price has been accumulating to form a bullish pennant pattern. This is a bullish continuation pattern that signals when breaking the upper boundary of the flag pattern.
📉 Key Levels
BUY Trigger: Break and trade above 199000
Target 128000
Leave your comments on the idea. I am happy to read your views.

Shriram Finance on Radar ! Bullish Setup !This is the daily chart of SHRIRAMFIN.
SHRIRAMFIN having a good law of polarity near at 580-600.
if this level is sustain then we may see higher prices in SHRIRAMFIN.
Thank You !!

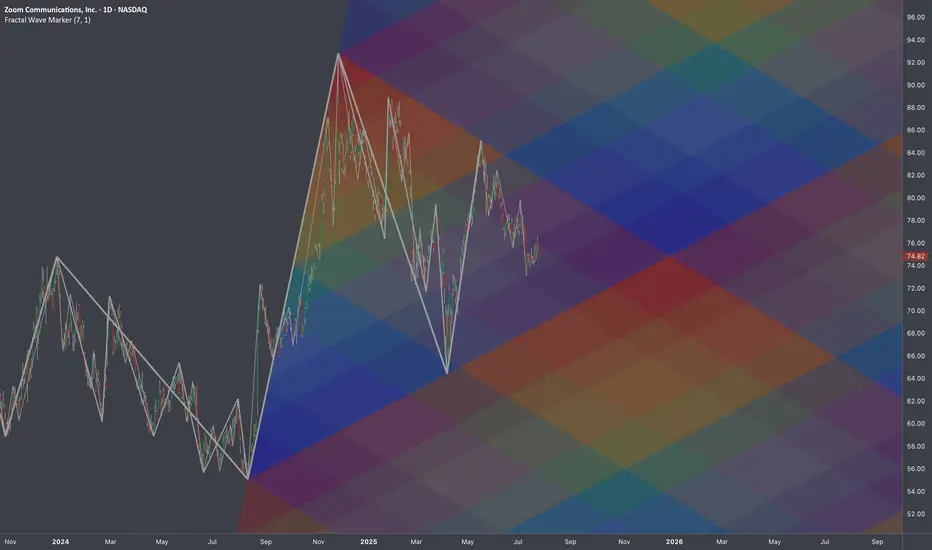
$ZM: Fibonacci Gradient 🏛️ Research Notes
Original Structure
Substitute for projection (TV's drawing tool)
I was thinking if using same 3 coordinates of cycle to cover future 2-polar expansions after breakout. That's why descending fibs would start with coldest (at breakout zone it would be relevant) and vise versa.
Same but with added counter-direction to produce gradient effect of decay.
Xvgusdt buy opportunityXVGUSDT is showing a strong move within a rising channel following a well-defined rounding bottom reversal. The focus is on the neckline of the rounding bottom, where wave 5 of the channel is expected to complete before a possible correction. This correction could evolve into either a cup and handle or an inverse head and shoulders (iH&S) pattern, time will reveal the structure. Watch the highlighted demand zone for potential accumulation opportunities.

CardanoAda usdt Daily analysis
Time frame daily
Risk rewards ratio >3 👈👌
Double bottom pattern has been created

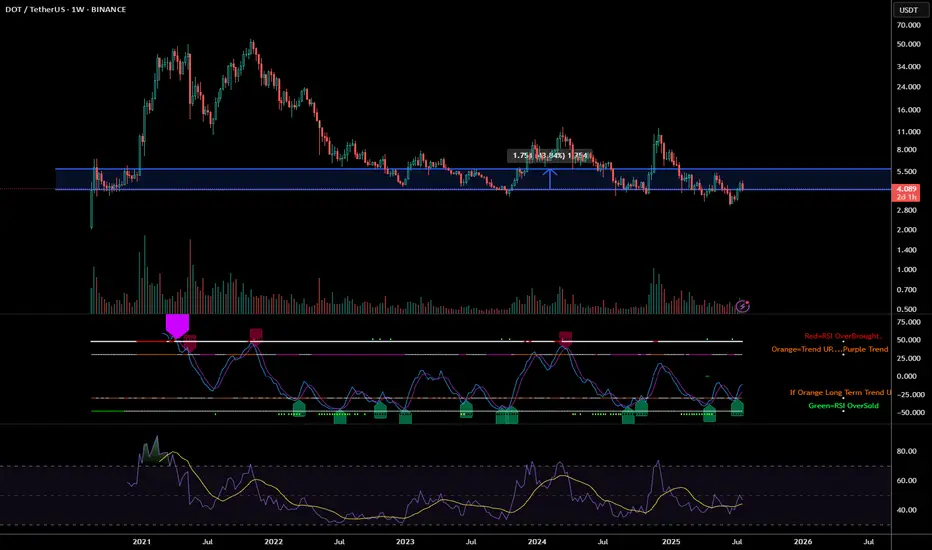
Polkadot (DOT) Technical Analysis: Navigating the Path Forward Polkadot (DOT) is currently trading at approximately $4.08 (as of July 25, 2025), having experienced significant volatility in recent months. After reaching a local high of $7.64 in mid-April 2025, DOT has undergone a substantial correction, losing approximately 46% of its value. This analysis examines DOT's technical position and potential trajectory for the remainder of 2025.
Price Structure Analysis
The daily chart reveals DOT has been in a defined downtrend since April 2025, characterized by a series of lower highs and lower lows. Most recently, price has established a trading range between $3.90-$4.30, suggesting potential stabilization after the steep decline. This consolidation zone represents a critical juncture for DOT's next directional move.
Key observations from the price structure:
Descending Channel Formation: DOT has been trading within a descending channel since April, with the upper boundary currently around $4.50 and lower boundary near $3.80.
Support Cluster: Multiple support tests in the $3.90-$4.00 region have held thus far, potentially forming a base for a recovery attempt.
Volume Profile: Trading volume has been notably higher during recent consolidation compared to previous months, suggesting increased interest at these price levels.
RSI Analysis: Signs of Potential Reversal
The Relative Strength Index (RSI) provides compelling evidence for a potential trend shift:
Bullish Divergence: While price made lower lows in late June and early July, the RSI formed higher lows, creating a bullish divergence pattern that often precedes reversals.
Oversold Recovery: The RSI reached oversold territory (below 30) in mid-June and has since recovered to the 40-45 range, indicating diminishing selling pressure.
RSI-based MA Crossover: The RSI has recently crossed above its moving average, a signal that has historically preceded price recoveries for DOT.
The 4-hour chart shows the RSI establishing a series of higher lows while price consolidates, suggesting building momentum beneath the surface despite sideways price action.
Support/Resistance Level Analysis
Critical price levels that will influence DOT's next directional move:
Support Zones:
Primary: $3.90-$4.00 (current consolidation floor)
Secondary: $3.60-$3.70 (previous support from May)
Tertiary: $3.30-$3.40 (major support from early 2025)
Resistance Zones:
Immediate: $4.30-$4.50 (upper boundary of current consolidation)
Major: $4.80-$5.00 (previous support turned resistance)
Structural: $5.70-$6.00 (descending trendline from April high)
Volume Analysis
Volume patterns provide additional context for DOT's current position:
Declining Sell Volume: Selling volume has progressively decreased during the recent consolidation phase, suggesting exhaustion of selling pressure.
Volume Spikes on Bounces: Recent upward price movements have been accompanied by above-average volume, indicating potential accumulation.
Volume Contraction: The overall contraction in trading volume during the recent range-bound price action typically precedes significant moves.
Market Structure Analysis
Examining DOT's market structure reveals several important patterns:
Potential Inverse Head & Shoulders: The recent price action is forming what could develop into an inverse head and shoulders pattern, with the neckline around $4.50. Completion of this pattern would project a move toward $5.20-$5.40.
Wyckoff Accumulation: The price action since mid-June displays characteristics consistent with Wyckoff accumulation, including:
Spring phase (drop to $3.59 in late June)
Test phase (retest of lows in early July)
Sign of strength (move toward $4.20 on increased volume)
Compression Pattern: Price volatility has been decreasing, forming a compression pattern that typically resolves in a strong directional move.
Moving Average Analysis
Moving averages confirm DOT's bearish positioning but show early signs of potential trend change:
Below Key MAs: DOT remains below all major moving averages (50, 100, and 200-day), confirming the bearish trend.
MA Compression: The gap between shorter and longer-term moving averages is narrowing, often a precursor to trend shifts.
RSI-based MA Crossover: While price MAs remain bearish, the RSI-based moving average has turned upward, often an early indicator of trend reversal.
Fibonacci Retracement Analysis
Using the move from the April high ($7.64) to the June low ($3.59):
23.6% Retracement: $4.54 (immediate target on breakout)
38.2% Retracement: $5.13 (medium-term target)
50% Retracement: $5.62 (significant resistance level)
61.8% Retracement: $6.10 (major resistance level)
The current price action suggests DOT is attempting to establish a base before potentially targeting these retracement levels.
Scenario Analysis
Bullish Scenario
If DOT can decisively break above the $4.50 resistance level with increased volume:
Initial Target: $4.80-$5.00 (previous support turned resistance)
Secondary Target: $5.50-$5.70 (50% retracement level)
Extended Target: $6.00-$6.30 (61.8% retracement and structural resistance)
Catalysts: Successful parachain upgrades, increased developer activity, or broader crypto market recovery could drive this scenario.
Bearish Scenario
If DOT breaks below the $3.90 support level:
Initial Target: $3.60-$3.70 (previous support)
Secondary Target: $3.30-$3.40 (major support level)
Extended Target: $3.00 (psychological support)
Catalysts: Continued weakness in the broader crypto market, technical issues with the Polkadot network, or regulatory concerns could trigger this scenario.
Most Probable Scenario
Based on the weight of technical evidence, the most probable scenario appears to be:
Continued consolidation between $3.90-$4.50 for the next 1-2 weeks
Eventual breakout above $4.50 targeting the $5.00 level
Establishment of a new trading range between $4.50-$5.50 through August-September
This scenario is supported by the bullish divergences, decreasing selling volume, and early signs of accumulation.
Trading Strategy Recommendations
For Long-Term Investors
Accumulation Strategy: Consider dollar-cost averaging in the current $3.90-$4.20 range
Position Sizing: Maintain appropriate position sizing given DOT's high volatility
Key Levels: Use the $3.60 level as a stop-loss for new positions
For Active Traders
Range-Bound Strategy: Trade the current range between $3.90-$4.30 until a breakout occurs
Breakout Strategy: Enter on confirmation of breakout above $4.50 with targets at $4.80, $5.20, and $5.70
Risk Management: Maintain tight stops below $4.30 on breakout trades to protect against false breakouts
For Risk-Averse Investors
Confirmation Approach: Wait for confirmation of trend reversal (price above $4.80 and 50-day MA)
Partial Position: Consider establishing partial positions at current levels with defined risk parameters
Technical Triggers: Look for RSI moves above 60 as confirmation of momentum shift
Conclusion: Cautious Optimism for DOT
The technical picture for Polkadot suggests we may be approaching an inflection point after the substantial correction from April highs. Multiple technical indicators point to diminishing selling pressure and early signs of accumulation, creating the conditions for a potential recovery.
While DOT remains in a technical downtrend, the convergence of bullish divergences, volume patterns, and market structure suggests the potential for a trend reversal in the coming weeks. The $4.50 level represents the key technical hurdle that must be overcome to confirm this shift.
For investors and traders, a balanced approach is warranted—acknowledging the current bearish trend while positioning for a potential reversal. The risk-reward profile appears increasingly favorable for cautious accumulation at current levels, with clearly defined risk parameters.
The most probable path forward appears to be continued consolidation followed by a gradual recovery toward the $5.00-$5.50 range by late Q3 2025, contingent upon broader market conditions and continued development progress within the Polkadot ecosystem.
25.07.25 Morning ForecastPairs on Watch -
FX:USDJPY
CAPITALCOM:DE40
FX:GBPUSD
FX:AUDUSD
A short overview of the instruments I am looking at for today, multi-timeframe analysis down to what I will be looking at for an entry. Enjoy!

GALA. USDTGala is one of the cryptocurrencies in the market with high growth potential.
This is not speculation. Rather, Gala growth has good prospects, given that it is an American cryptocurrency based on Ethereum, ( ERC-20).
The limited number of Gala tokens is another factor that can contribute to the growth of Gala, and Gala's dynamics have proven this many times.
Therefore,
The first target price of Gala is $0.04, that with strong growth, it will reach $0.08.
However,
Zero elimination is the first goal of Gala, and in the long term (maybe in a year or two), the price of Gala will reach $1.

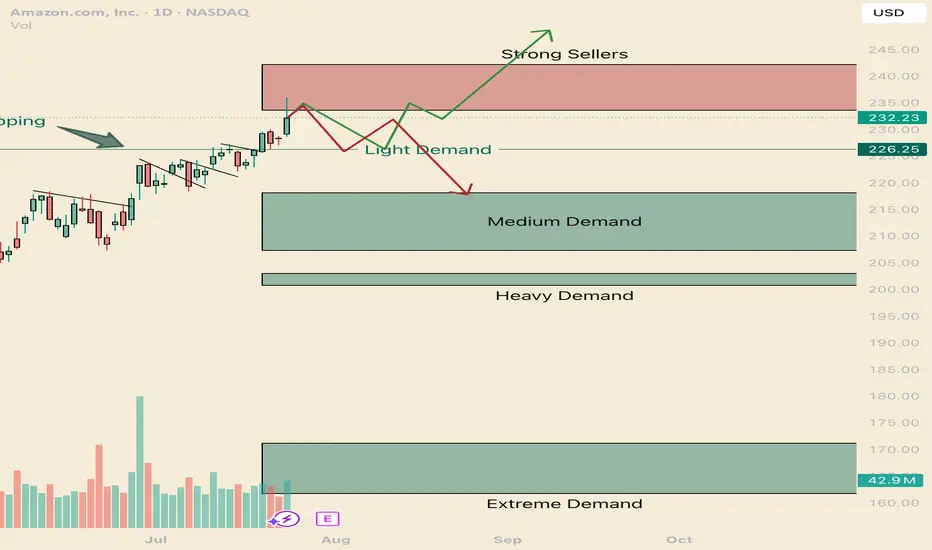
How to navigate the Amazonian Squeeze. AMZNHello I am the Cafe Trader.
This week has been a deep dive on the MAG 7 and today AMZN is up next.
We are going to look at long term and short term opportunities.
We are near the All Time Highs, with one final Seller to get through before making the break.
Today we tested to see if those sellers are there still (and indeed they are). Today was a key reaction, I'm going to give you the keys to profit.
Long Term
It's important to consider how aggressive you would like to be with pricing. This list of prices should align with your conviction with Amazon.
Aggressive: $226 is where the current aggressive players are sitting. They are going to look to buy again at this level, although they should be the weakest of the buyers.
Fair sentiment: 203-210 is where stronger buyers are sitting. I think this price is still realistic to get to.
Conservative: 161 - 171 Is a great price, buyers have shown to buy this with extreme demand. Amazon at this price is a fantastic purchase, if you are holding from here or lower, congradulations.
Short term
Testing the supply and rejecting tells us that sellers are still really active in this zone. We will see how tomorrow closes, if we do not close in the supply zone, there is a good chance that net week will have some bearish winds and a great chance of testing the light demand at 226. this brings us to the two trading ideas.
1 Green line
I think we will test those sellers by next week. and i think its very possible that we break trend and touch the light demand line. If its a slow drag down to the light demand, Shorts will have to cover as soon as any real demand shows up (Light Demand Line).
Entry 226.50
Stop 221.50
Partial TP 233, or you can hold for a test of the highs (242 would suffice)
2 Red Line
If we get a Hot reaction from the supply zone, or if we close below 233.50 tomorrow, Look for a retest and short entry off the supply zone. If the reaction starts to be slow (more than 5 days of red bars) it's likely this will turn into the green scenario.
Entry 233.5
Stop 237
Partial TP 226.5
Full TP 218
That's all for AMZN Follow for more!
Also comment if you would like me to chart a stock you are considering.
@thecafetrader