LIT Falling WedgeLithium Australia NL (ASX:LIT) Is a Perth WA based company that aims to supply ethically and sustainably sourced materials to the battery industry worldwide. LIT has developed disruptive extraction technologies – including its proprietary SiLeach® process – and secured positions in lithium provinces around the globe, including Western Australia and Europe.
2 Scenarios I am looking at.
Bullish:
- Falling Wedge Pattern (Bullish)
- MACD Bullish
- RSI Trending and above the 50.00
- Price above MA 20
- Volume increasing
I have identifed Bullish targets which are alligning with Previous Highs and Fractal Targets, also running Trend Based Fib Extension over the chart I have identified that Ratio Levels are close to other Bullish Targets mentioned before.
Bearish:
If price was to retest Daily Support and break then I would be looking at the next level of Previous Support.
"DISCLAIMER: NO ADVICE. The information presented here is general in nature and is for education purposes only. Nothing should be considered to be advice. You should consult with an appropriate professional for specific advice tailored to your situation."
Trendbasedfib

IMUGENE Run Complete?Imugene (ASX:IMU) is a clinical stage immuno-oncology company developing a range of new treatments that seek to activate the immune system of cancer patients to identify and eradicate tumors.
3 Scenarios identified
Bullish:
- MACD still Bullish
- Volume increasing
- RSI still trending Bullish although currently Overbought
- Bullish bounce off .382 Fib Retracement
Bullish price action continues and breaks Daily Resistance. Higher targets can be identifed by use of Trend Based Fib Extension.
Consolidation:
- Double Top off Daily Resistance
- MACD Weakening
- RSI Overbought
After a great run price could consolidate underneath Daily Resistance for a short time, which could build a potential Bullish/Bearish Pattern. Im looking at the .382 Fib Retracement as the next level of Major Resistance.
Bearish:
- MACD Weakening
- RSI Overbought
- Fractal Pattern Completed
- Double Top off Daily Resistance
If the Fib Retracement level 0.382 fails as support look for the Golden Pocket 0.5-0.618
"DISCLAIMER: NO ADVICE. The information presented here is general in nature and is for education purposes only. Nothing should be considered to be advice. You should consult with an appropriate professional for specific advice tailored to your situation."

Todd River BullishTodd River Resources (ASX:TRT) is an Australian-based resources company that holds base and precious metal projects covering over 7,500 sq. km. of highly prospective geology in Western Australia and the Northern Territory.
2 potential scenarios.
Bullish:
- Short term Double Bottom
- Testing short term downtrend resistance
- MACD turning Bullish, anticipated cross
- RSI broken above the 50.00
- Daily close above MA 20
Looking for retest of Previous High and if it is to break I have identified higher levels with Trend Based Fib Extension.
Ongoing drilling programs and results pending.
Bearish:
If price fails short term downtrend resistance it most likely will retest Daily Support. If it cannot rally again I am looking for levels of Former Support and Longterm Uptrend.
NOTE: Potential Descending Triangle pattern forming highlighted in yellow.
"DISCLAIMER: NO ADVICE. The information presented here is general in nature and is for education purposes only. Nothing should be considered to be advice. You should consult with an appropriate professional for specific advice tailored to your situation."

DEX Ascending Triangle.Duke Exploartion Limited (ASX:DEX) is an exploration company focusing on Copper, Gold and Silver discoveries in Queensland and New South Wales AUS. Duke's 100% owned flagship project is the Bundarra tenement EPM 26499. A fully funded exploration work program aims to drill out a maiden resource by mid-2021 at the Mt Flora prospect within the larger Bundarra tenement.
There are 2 TA scenarios currently IMO
Bullish:
- Ascending Triangle forming against daily Resistance.
- MACD Bullish cross anticipated
- RSI above 50.00 and broken short term downtrend
- Fundamental news due within 2 months
- Broken 20 MA Bullish
- Targets for Ascending Triangle completion are levels of Former Resistance which also are very close to Trend Based Fib Extension Levels.
Bearish:
If we fail the Ascending Triangle price will retest Uptrend and Break, then we should see MACD Bearish aswell as RSI below the 50.00 trending Bearish. Most likely we will see a retest of Former Support @.30
"DISCLAIMER: NO ADVICE. The information presented here is general in nature and is for education purposes only. Nothing should be considered to be advice. You should consult with an appropriate professional for specific advice tailored to your situation."

ADA - Decided to post something differentCardano ADA UPDATE:
I decided to do a little something different tonight and show some potential price targets with Trend Based Fibonacci Extension Levels.
First and foremost, ADA is still in a longterm uptrend.
If we look at the daily chart, you can see that ADA is still above its Bollinger Bands Middle Band Basis. ADA is also still consolidating in a very long Bollinger Bands Squeeze.
ADA is still above its Longterm Pitchfork Median Line. If you want to see the full scale of it then check out a previous ADA chart i posted a few weeks ago.
ADA is still above its Upper Yellow Pitchfork Support Line.
I have added 2 previous Trend Based Fibonacci Extensions to show you what has transpired before and want may transpire again with the 3rd Trend Based Fib.
Worthy of note is that the 3rd Trend Based Fibonacci Extension stays valid as is, if the candle indicated on the chart stays as the bottom for that pattern, so we don’t want any sudden crazy dips just yet.
Looking at the 3rd Trend Based Fibonacci Extension, we can see what potential price targets ADA may hit if this Bollinger Bands Squeeze ends with an upwards surge, obviously nothing is set in stone but i believe ADA will end the Squeeze with upwards momentum 👍.
Just keeping this one short and sweet. I hope this is helpful with your Trading & Hodl-ing 🔥🚀🌍🌔🪐🛸👽

LifeSpot BreakoutASX:LSH LifeSpot Health
Bullish Outlook:
- Ascending Triangle forming against resistance
- Uptrend respected
- Volume increasing
- MACD Bullish
- RSI Bullish
- Measured Move & TB Fib Extension Targets Aligning
Bearish Outlook:
If price is to be held below Daily Resistance and Breaks Uptrend then a return to @.10 is likely
NOTE: Position would only be taken as resistance breaks. Risk Management and Position Sizing is also critical.
"DISCLAIMER: NO ADVICE. The information presented here is general in nature and is for education purposes only. Nothing should be considered to be advice. You should consult with an appropriate professional for specific advice tailored to your situation."

Botanix Bullish Channel to Continue?Botanix Pharmaceuticals Ltd (ASX:BOT) is a clinical stage cannabinoid therapeutics company. The company focus is the development of safe and effective topical treatments for serious skin conditions. It has an exclusive license to use a proprietary drug delivery system - Permetrex for direct skin delivery of active pharmaceuticals in all skin diseases. The company's product pipeline includes BTX1503 - Moderate to Severe Acne, BTX1308 - Plaque Psoriasis, BTX1204 - Atopic Dermatitis, and BTX 1701 - Mild Acne.
Since posting my last idea on the 16th JAN, I thought since we are at another critical level to revisit the Idea and look at 3 posible forecasts.
1. Bullish
- Respect Upward Channel
- MACD weak and anticipating Bullish Cross
- RSI Trending Bullish towards the 50.00 Level
- TB Fib Extension level 1.618 aligning with upper band of Channel
NOTE: price will need to see some Strong Volume and Bullish movement to break through the Ichimoku Cloud internal of the channel (could we be so lucky to receive an announcement worthy?)
2. Bullish off Daily Support (EQ)
- If price is to break Uptrend Channel then a fall to Daily Equilibrium (Support) is likely. RSI is still below the Bullish 50.00 and MACD yet to cross Bullish. Price would also have to break through the Bearish ichimoku cloud that is identified. I think that lack of news and investment frustration could see price fall before a potential Double/Triple Bottom.
3. Bearish
- Break of Upward Channel
- Break of Daily Support
- TB Fib Extension Targets aligning with key levels of Support
- RSI would break uptrend
- MACD would spread and continue Bearish
NOTE: If price manages to fall below Daily Support then I would expect opportunistic buying at former levels of support before reversal.
The "boys" holding this down are getting weaker and starting to sweat IMO GLTAH
Disclosure: Held, Sentiment: Buy
"DISCLAIMER: NO ADVICE. The information presented here is general in nature and is for education purposes only. Nothing should be considered to be advice. You should consult with an appropriate professional for specific advice tailored to your situation."

Medlab Ascending Channel(ASX:MDC) Medlab Clinical Ltd is an Australian, publicly listed biotechnology company that is finding new ways to address the biggest challenges of our time including the growing burden of cancer, suboptimal pain management as well as enhancing drug delivery with nanotechnology.
Bullish Outlook:
- Ascending Channel
- Internal Uptrend
- Bounce off RSI 50.00
- MACD crossing Bullish
- Testing Daily Resistance
- Positive Product Announcement
Looking to see if price will break upper band of Ascending Channel and test former Resistance levels which align with TB Fib Extension Targets (1.), or will price consolidate for a short time before it breaks Daily Resistance after retesting Internal Uptrend Trendline (2.)
Bearish Outlook:
If Internal Uptrend Fails then a return to Daily Resistance and Lower band of Ascending Channel is likely, If it is to fail then there are 2 levels of former Support to watch (3.)
"DISCLAIMER: NO ADVICE. The information presented here is general in nature and is for education purposes only. Nothing should be considered to be advice. You should consult with an appropriate professional for specific advice tailored to your situation."

AMD to respect Gann Fan?NASDAQ: AMD Advanced Micro Devices, Inc. is an American multinational semiconductor company based in Santa Clara, California, that develops computer processors and related technologies for business and consumer markets.
Gann Fan Outlook:
As we can clear see on the Weekly TF, AMD has respected this charted Gann Fan multiple times. Currently sitting above Angle 1/2, price action is telling us we are still currently above averagely "Bullish".
Im interested to see If price breaks Daily Resistance and hits any of the charted TB Fib Extension Targets closer to the Angle 1/3. On the flip side if we break Daily Support & Former Support im interested to see if price action will return to the Angle 1/1 (which is also a former level of Resistance).
Cheers to the next 6 months!
"DISCLAIMER: NO ADVICE. The information presented here is general in nature and is for education purposes only. Nothing should be considered to be advice. You should consult with an appropriate professional for specific advice tailored to your situation."

AMAZON new HIGHSNASDAQ: AMZN Amazon.com, Inc. is an American multinational technology company based in Seattle, Washington, which focuses on e-commerce, cloud computing, digital streaming, and artificial intelligence.
Bullish Outlook (WEEKLY):
- MACRO Ascending Triangle forming against Weekly Resistance
- TB Fib Extension target 0.786 lining up with Internal Fractal Move @3869.5
- MACD turning and anticipated Bullish Cross
- RSI bounce of the 50.00 level
- TB Fib Extension Target 1.618 also lining up with a flagpole target around 4900-5000 region at break of Weekly Resistance.
NOTE: keep in mind the Weekly TF and that this would take IMO at least 6 months to play.
Bearish Outlook Weekly:
If Uptrend and Ascending Triangle pattern fails id expect a fall to @2900-3100 region.
"DISCLAIMER: NO ADVICE. The information presented here is general in nature and is for education purposes only. Nothing should be considered to be advice. You should consult with an appropriate professional for specific advice tailored to your situation."

NIO Recharged?(NYSE:NIO) NIO Limited designs, manufactures, and sells electric vehicles in the People’s Republic of China, Hong Kong, the United States, the United Kingdom, and Germany. The company offers a range of electric SUVs. It is also involved in the provision of energy and service packages to its users; marketing, design, and technology development activities; manufacture of e-powertrains, battery packs, and components.
2 Scenarios im looking at currently.
Bullish Outlook:
- Potential Bull flag Pattern forming
- Still in Uptrend
- Sitting on Daily Support
- Daily Support is aligning with 0.5 Fib Retracement
I'm waiting to see if Support holds and reaction from Uptrend, Bull flag validation relies upon upper downtrend trendline breaking.
Bearish Outlook:
If Daily Support fails and Trend Breaks then I'm looking to see what happens at EQ 48.94
"DISCLAIMER: NO ADVICE. The information presented here is general in nature and is for education purposes only. Nothing should be considered to be advice. You should consult with an appropriate professional for specific advice tailored to your situation."

Botanix: Strength to StrengthBotanix Pharmaceuticals Ltd (ASX:BOT) is a clinical stage cannabinoid therapeutics company. The company focus is the development of safe and effective topical treatments for serious skin conditions. It has an exclusive license to use a proprietary drug delivery system - Permetrex for direct skin delivery of active pharmaceuticals in all skin diseases. The company's product pipeline includes BTX1503 - Moderate to Severe Acne, BTX1308 - Plaque Psoriasis, BTX1204 - Atopic Dermatitis, and BTX 1701 - Mild Acne.
Bullish Outlook:
- Trending Bullish within Upward Channel
- Double Bottom off Support
- RSI not Overbought
- TB Fib Targets Achievable
- Positive news should see this continue trend
Trading.
"DISCLAIMER: NO ADVICE. The information presented here is general in nature and is for education purposes only. Nothing should be considered to be advice. You should consult with an appropriate professional for specific advice tailored to your situation."

LKE Strong TrendLake Resources NL (ASX:LKE; OTC:LLKKF) is a clean lithium developer utilising clean, direct extraction technology for the development of sustainable, high purity lithium from its flagship Kachi Project, as well as three other lithium brine projects in Argentina. The projects cover 200 sq km in a prime location within the Lithium Triangle, where 40% of the world’s lithium is produced at the lowest cost.
Lake Resources looking bullish:
- Strong Uptrend respected
- Previous targets complete
- Bullish Channel confirmed
- MACD Bullish
- RSI Trending Bullish
- Bullish bounce of .328 Fib Retracement over last 2 days
- Bullish Buying Volume
- Market Structure currently Bullish
Bearish Move:
- Im expecting some Bearish action as traders take profit, RSI is slightly overbought. Consolidation within channel is possible.
Watching Closely
"DISCLAIMER: NO ADVICE. The information presented here is general in nature and is for education purposes only. Nothing should be considered to be advice. You should consult with an appropriate professional for specific advice tailored to your situation."

Raiden Recourses looking BULLISHRaiden Resources Limited (ASX:RDN) is an ASX copper-gold exploration company focused on discovering large scale mineral deposits in the world class Tethyan region of Eastern Europe. Raiden operates in low cost and mining friendly jurisdiction’s which remain underexplored, seeking to systematically apply modern exploration techniques to discover Tier 1 projects.
Bullish Outlook:
- Falling Wedge Continuation Pattern
- Bullish Break of Downtrend Trendline
- Fractal and TB Fib Extension Targets Aligning
- Volume returning
- Fundamental News as Exploration Begins 09/12
Bearish notes:
- Unclosed GAP 0.023-0.025
"DISCLAIMER: NO ADVICE. The information presented here is general in nature and is for education purposes only. Nothing should be considered to be advice. You should consult with an appropriate professional for specific advice tailored to your situation."

Trend base Fib indication on daily chartTrend base fib series indicating daily bar touching level of 1.0 in Trend base fib series. exact reversal from 12769 ~ 12766. With 8 days of rally looks like some profit booking will come from this level.

PAN Cup and HandlePanoramic Resources Limited (ASX:PAN) is a base metal mining and exploration company headquartered in Perth, Western Australia with a 20 year history of mining and expertise in nickel, copper and cobalt sulphide projects.
Is PAN ready for a Cup and Handle Breakout? Technical Analysis as below.
Bullish:
Cup an Handle Formation
Bullish Market Structure
Trending above the 20MA
RSI trending above the 50 level
Cup & Handle target aligning with other targets
TB Fib Extension Final Target aligning with other targets
Fib Retracement .382 aligning with other targets
TB Fib Extension Target 1 looking achievable on the break
Bearish:
2 levels of support are indicated if we fail completion and reject off resistance.
Exciting future for all Nickel mining operations as global demand will increase due to its uses such as Batteries and other Electrical Apparatus.
Watchlist worthy.
Disclosure: Held. Sentiment: Bullish.
"DISCLAIMER: NO ADVICE. The information presented here is general in nature and is for education purposes only. Nothing should be considered to be advice. You should consult with an appropriate professional for specific advice tailored to your situation."

Bitcoin revised running flat countMorning Traders
My primary bullish macro count for now. Can definitely see this playing out. Running flat correction (3-3-5) where we get a 1:1 (a):(c) extension to complete B like we had for A.
Targeting $15.5k in Q4 2020 for this final leg up before the next downtrend to complete finally a macro wave 2 sometime next year.
Locally, this is what I'm expecting from here:

Is HTGM just full of ABCD patterns?HTGM on the 1 hr chart. I swear this ticker is full of ABCD patterns!
I am learning to identify ABCD patterns, and i am hoping my observations are accurate here.
I see a large ascending ABCD pattern leading to a huge descending ABCD pattern.
At the bottom I see a small descending ABCD pattern, which appears to be starting its upward movement.
I have setup 2 fibs, extension and retracement, both showing potential PT range of 3.50-3.90 with 3.75 looking very doable.
Hopefully I am right because I entered this thing at 0.3094!
Let's see how it goes!

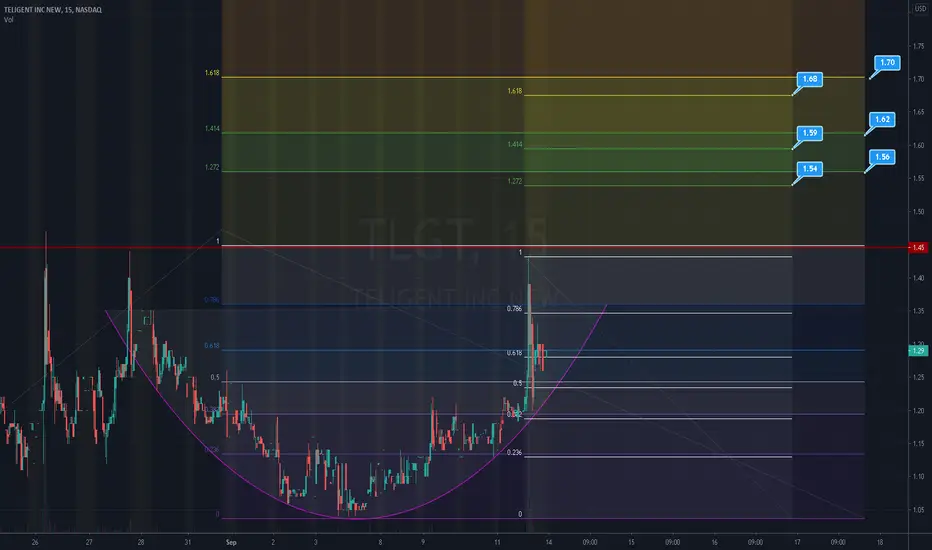
TLGT: Showing me its round bottom?TLGT on the 15 minute chart in order to watch it move.
I see a rounding bottom, but I swear I just see that everywhere nowadays.
The fibs, retracement as well as trend-based extension, show a range of PT's above 1.44.
Seems a good PT range is 1.54 -1.62 for lower end, and up to 1.70 for higher end.
Anything beyond those levels will require quite a bit of volume and buying pressure.
Let's see how this plays out!
Trend Base Fibo Shows btc 7K in horizon Base on trend base fibo , shows in next 4 days btc possibly reach 7K


BTCUSD Bear scenario -No Bull run yet (bull scen @ my profile)Hold your horses. I also have a bull scenario which in fact is already took effect.
Tho this is subjective. This type of diagonal which I assume is ending should be found between wave 4->5 OR Wave B->C. Or probably a leading diagonal but a 53535.
As long as we break above the resistance area which is on wave 4. THIS FORECAST WILL BE INVALIDATED.

Return to last high pivotIf price break the .0 fibo in the next 3 days and 12045 support the price for 1 day,then in the next 7 days price could reach the .618 fibo , and rise till 12650
