Bitcoin Hits PRZ — Is This the Perfect Short Entry?Bitcoin ( BINANCE:BTCUSDT ) has entered the Potential Reversal Zone (PRZ) after a strong bullish impulse , testing the confluence of Daily Resistance(3) .
In terms of Elliott Wave analysis , the market seems to have completed a complex WXY corrective structure , with the recent rally likely representing the final wave Y . This makes the current zone highly reactive for potential reversal .
I expect Bitcoin to retrace toward the CME Gap($105,075-$105,055) and possibly continue downward toward the Support zone($104,380-$103,060) and Cumulative Long Liquidation levels if the sellers regain momentum .
Cumulative Short Liquidation Leverage: $107,568-$106,601
Cumulative Long Liquidation Leverage: $105,360-$104,784
Cumulative Long Liquidation Leverage: $103,937-$103,217
Note: It is better to look for short positions at the Potential Reversal Zone (PRZ) or if Bitcoin touches $104,780 before reaching PRZ. That is why I chose to label this analysis as ''Short".
Note: If Bitcoin can touch $107,620 , there is a possibility of breaking the resistance lines and increasing further.
Please respect each other's ideas and express them politely if you agree or disagree.
Bitcoin Analyze (BTCUSDT), 1-hour time frame.
Be sure to follow the updated ideas.
Do not forget to put a Stop loss for your positions (For every position you want to open).
Please follow your strategy and updates; this is just my Idea, and I will gladly see your ideas in this post.
Please do not forget the ✅' like '✅ button 🙏😊 & Share it with your friends; thanks, and Trade safe.
Trend Lines

HelenP. I Euro will break resistance level and continue to fallHi folks today I'm prepared for you Euro analytics. On this chart, we can see how price initially moved inside a triangle formation, forming higher lows from the trend line and testing the resistance zone multiple times. Eventually, price broke out to the downside, falling sharply and breaking through the lower boundary of the triangle and also the trend line, signaling a shift in market sentiment. After touching the support zone and forming a temporary bottom, the pair started climbing back up, but this movement was more of a correction than a trend reversal. Price respected the trend line from below and followed it upward, but failed to break significantly higher. It managed to push above both support 2 and support 1 levels, which now act as resistance. Currently, EURUSD is trading inside the resistance zone, where previous reactions have led to strong bearish impulses. Given this behavior and the recent false breakout, I expect the price to rebound from this area and break back below support. My goal is set at 1.1350, anticipating further downside movement as the bearish structure remains valid. If you like my analytics you may support me with your like/comment ❤️
Disclaimer: As part of ThinkMarkets’ Influencer Program, I am sponsored to share and publish their charts in my analysis.

#GBPUSD: A strong bullish move incoming, comment your views The price has shown a possible price divergence, which could lead to a long-term move to 1.37. We expect the US dollar to weaken, which will likely push the price of GBPUSD to our target. Key economic data will be released later today and tomorrow, which could shape the price pattern.
Good luck and trade safely!
Team Setupsfx_

EURUSD Potential UpsidesHey Traders, in the coming week we are monitoring EURUSD for a buying opportunity around 1.14500 zone, EURUSD is trading in an uptrend and currently is in a correction phase in which it is approaching the trend at 1.14500 support and resistance area.
Trade safe, Joe.

Gold: Breakout and Potential Retrace!!Hey Traders, in today's trading session we are monitoring XAUUSD for a selling opportunity around 3,390 zone, Gold was trading in an uptrend and successfully managed to break it out. Currently is in a correction phase in which it is approaching the retrace area at 3,390 support and resistance zone.
Trade safe, Joe.

GOLD → Consolidation within a falling wedgeFX:XAUUSD is consolidating. A major player is gathering a trading position inside a wedge ahead of distribution. But the main question is: in which direction?
Gold lost ground again on Friday after mixed holiday trading on Thursday. Traders are waiting for new signals from the Fed and monitoring the situation in the Middle East. Interestingly, gold fell as the conflict escalated further (which is not logical overall). The dollar is in a global bearish trend, and traders are waiting for a decision from Powell (who is under pressure from Trump to cut rates).
Technically, if we look at the wedge, we can see how difficult it is for the market to move. The price is stuck inside the consolidation. The intraday movement is very short, with long tails and a very weak reaction to both false breakouts and level break. Large players are building up positions inside the current channel. This may only hint at the possibility of future implementation (distribution).
Resistance levels: 3360, 3396, 3420
Support levels: 3338, 3320, 3302
On D1 - H4, gold is in a countertrend (bullish trend) correction and is testing the trend support + 0.7 Fibo zone. Below, there are fairly strong areas of interest — 3320 and 3302 — which gold may test before rising. However, within the wedge, there is a fairly high probability of a breakout of resistance and the 3360 level, followed by a rally to the liquidity zone at 3396
Best regards, R. Linda!

EUR/USD analysis and pending orderTwo days ago, there was a FED meeting, where it was stated that the benchmark interest rate will be kept at 4.25-4.50% level.
What is important is what they told - the expectations - economicp rojections are lower, and inflation is higher.
Maybe they’ll decrease rates in future?
Right now, it’s not so important. It’s summer already, and by the old “Sell in May, and go aways” mentality, I don’t expect some huge impact on the market.
I know… Iran, Israel, Trump, maybe even Putin? Anybody can do some stupit stuff and everything can go to Hell.
And it’s Friday, not very smart time to open trades, so I’m putting pending order.
I decided for EUR/USD.
Timeframe is 4h.
On my chart I can see clear uptrend in the last couple of weeks, especially in the last 3 months.
Also, I see lower highs.
Upward trend is breached… Where it could stop?
Overall, I don’t expect the pair will come near parity, even though ECB lowered rates before FED did.
But some “selloff”, probably.
I used good old Fibonacci, draw it, and the price could potentialy drop to 50% level or even ideal 61…8%-78.6% zone.
Pending entry: 1.15577
TP: 1.12645
SL: 1.1671
If it activates today, I’ll leave it over the weekend.

XAU/USD Reversal Expected from Demand Zone – Bullish Breakout PoIn this 1H chart of XAU/USD (Gold vs US Dollar), the price has been trading inside a descending channel, gradually approaching a strong demand zone between $3,345 – $3,341, which also aligns with the weekly low. The price recently tested this zone and showed signs of slowing bearish momentum.
I anticipate a potential bullish reversal from this area, supported by historical demand reaction and volume activity. The projected price action (illustrated with the W-pattern) suggests a higher probability of a breakout from the channel, targeting:
🎯 TP1: $3,367 (mid-structure & MA test)
🎯 TP2: $3,374.16 (key horizontal level)
🎯 TP3: $3,383.82 (upper resistance & previous support flip)
🛑 SL: Below $3,341 – invalidation of the demand zone
This trade idea relies on confirmation via bullish engulfing or rejection wicks around the demand zone with volume uptick.
Always wait for a clear entry confirmation before entering the trade. Trade safe and manage your risk.

NASDAQ Potential UpsidesHey Traders, in the coming week we are monitoring NAS100 for a buying opportunity around 21,500 zone, NASDAQ is trading in an uptrend and currently is in a correction phase in which it is approaching the trend at 21,500 support and resistance area.
Trade safe, Joe.

HYPE/USDT Technical Analysis (4H Chart)🔍 HYPE/USDT Technical Analysis (4H Chart)
High Time Frame (Daily): Bullish
Despite recent pullbacks, the overall trend remains bullish on the daily timeframe. However, current price action suggests a potential fakeout or legitimate breakdown, as we test key structural and volume-based supports.
Short-Term Time Frame (4H): Bearish
The 4-hour chart displays clear bearish pressure, confirmed by the Three Black Crows candlestick pattern. This signals sustained selling interest and supports the current downward move.
🧱 Key Zones
Supply Zone: $41.7 – $45.9
Strong resistance marked by prior selling pressure and overlapping FVGs.
Demand Zone: $24.4 – $26.3
Historical area of buying support, aligned with a low-volume node and an unfilled FVG.
📏 Fair Value Gaps (FVGs)
Above Price:
Four 4H FVGs act as upside inefficiencies, offering targets in a bullish recovery:
~$34.9
~$36.6
~$37.8
~$40.0 (psychological level & POC cluster)
Below Price:
One major 4H FVG remains unfilled, directly above the demand zone.
📐 Fibonacci Analysis
Price is testing the Golden Pocket (0.618–0.65) from the recent swing low to high.
A clean break below this area (with confirmation) targets the unfilled FVG around $30, and potentially the demand zone ($24.4–$26.3).
📉 Volume Profile Insight
Volume is clustered around $34–$37, indicating strong past market participation.
Very low volume between $29–$30, creating a volume void — if price loses support at the FVG and golden pocket, it could rapidly drop into the demand zone.
🔻 OBV Analysis (Volume Momentum)
OBV has broken below a larger rising wedge, confirming bearish divergence.
A falling wedge is now forming within OBV.
Break below this wedge: Confirms further price breakdown.
Reclaim of the larger wedge trendline: Suggests potential bullish reversal.
✅ Trade Scenarios
🔺 Bullish Scenario
Trigger: Bullish reversal pattern at the golden pocket (e.g., double bottom, falling wedge, inverse H&S) + OBV recovery.
Entry: Upon confirmation around $32.5.
Targets:
$34.9 (FVG)
$36.6 (FVG)
$37.8 (FVG)
$40.0 (psychological)
Stop: Below $30 or recent swing low (tight below FVG).
🔻 Bearish Scenario
Trigger : Confirmed breakdown of golden pocket & 4H FVG with OBV falling wedge breakdown.
Entry : Below $32.5 with confirmation (e.g., retest or strong momentum candle).
Targets:
$30.0 (psychological level)
$28.5 (FVG zone)
$26.3 → $24.4 (Demand zone)
Stop : Above golden pocket resistance (~$33.8–$34.2).
📝 Conclusion: The market is at a pivotal point. A confirmed break below $32.5 could accelerate selling due to the volume gap, while a strong bullish reaction from the golden pocket could drive a recovery toward $40. Always wait for confirmation before entering either scenario.

Trading Signals for Gold Sell below $3,443 (21 SMA -7/8 Murrray)The XAU/USD trend remains bullish as long as the price consolidates above 3,384.
Therefore, it would be prudent to buy gold as long as the price consolidates above3,444, where the 7/8 Murray level is located.
Gold's volatility will continue over the next few days, so we believe it could move between 3,386 and 3,356.
Consequently, if gold consolidates and breaks above 3.498, it would be seen as a buying opportunity, with targets at the 8/8 Murray level around 3,600/
Last tow months, gold gapped around 3,498. This will likely be seen as a buying opportunity if the price breaks above the psychological level of $3,439
Conversely, below the R_1 around 3,443, gold will be seen as an opportunity to sell, targeting 3,400 and the bottom of the uptrend channel around 3,338.
The RSI indicator is showing a negative signal, so we must be cautious when buying, as a very strong technical correction could occur.

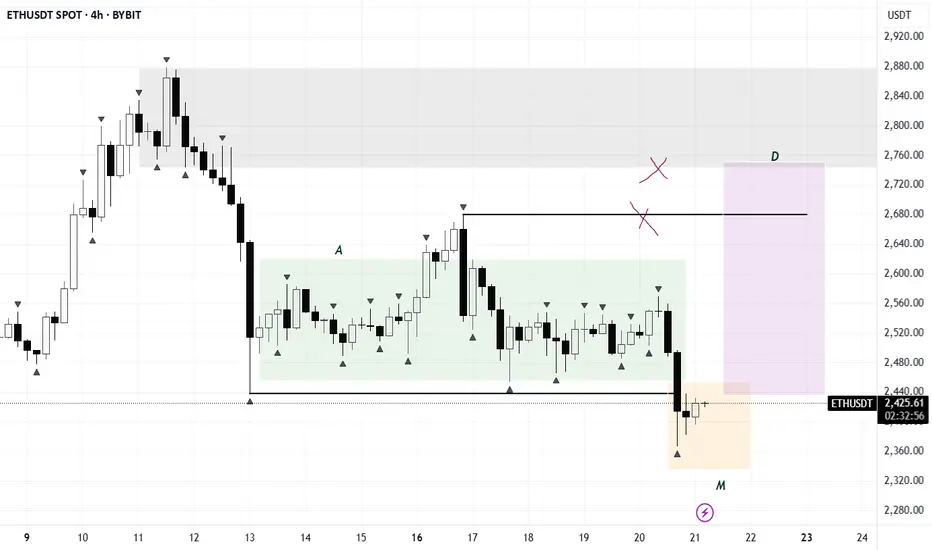
ETH/USDTFollowing the consolidation phase, we’ve seen a clear manipulation move — the structure closely resembles an AMD setup. As long as the pattern holds, upside targets are in the $2700–$3000 range.
Precise short orders in 3370-3375 area are launched!Gold has been volatile recently, with intraday fluctuations ranging from 1 to 200 US dollars, which greatly increases the difficulty of operation for retail investors. On the surface, there are many opportunities, but there are only a few real big market opportunities. If you miss the rhythm, you can only watch your funds shrink. Remember that risk management is crucial.
From the 4-hour analysis of gold, there are repeated resistances from bulls before the downward break; once it breaks down, the market will go further down, and the focus below is 3340. The upper short-term is 3370-3380, and the important resistance is 3400. Only by breaking through the bulls can the rebound continue. In terms of operation, sell high and buy low, and pay attention to the breakthrough!
There are too many long orders accumulated at the current high level of gold, and the market will not rise sharply easily. The current international situation is so tense, and gold is still slowly declining. In this situation, it is difficult to rebound sharply.
Operational suggestions: For short orders above, focus on the layout of the 3370-3375 area, strictly set a stop loss, target more than 20 points, control risks, and follow the trend.

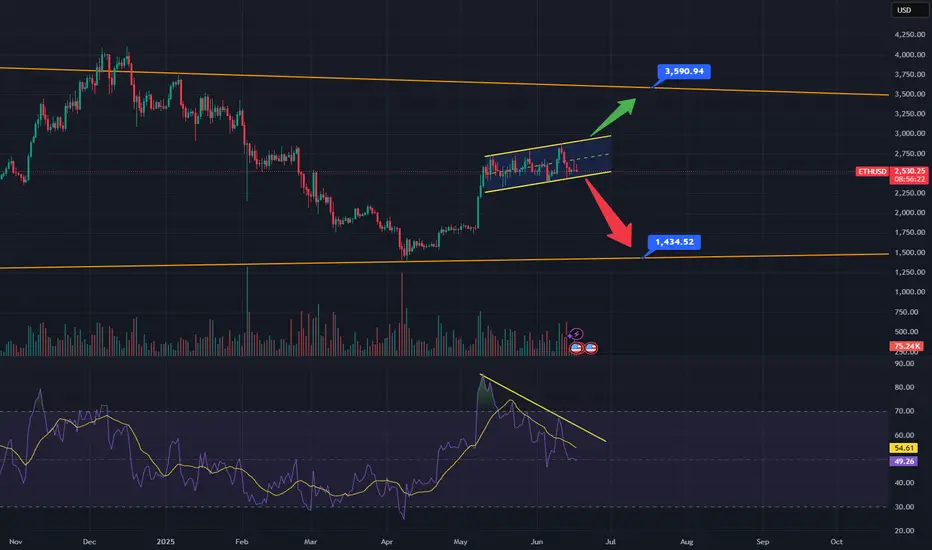
ETH: Breakout or Breakdown?As you can see ETH has been trading inside of this rising channel since the beginning of May. Rising channels favor a break to the downside, I've also highlighted some bearish divergence on the RSI which also points to a move down. The orange lines are long term weekly trend lines. The bottom orange line connects the 2022 lows through to the April lows, if price breaks down, expect a retest of the underside of the channel before moving down to the orange line around $1435. This would only be the third hit and third hits rarely breakdown. If it defies logic and breaks out above, look for it to move up to the top orange line around $3600, which connects the 2021 bull market highs through the march 24', May 24' and December 24' highs. If it comes into this area, it would be a 5th hit of a major weekly trendline, 5th hits have a very high probability of breaking out to the upside, if this happens it would be very bullish. In this scenario I would expect ETH to come down and test the top of said trendline as support before moving to new all-time highs. A Fibonacci retracement from the 2020 lows to the 2021 highs would put new price targets at $6,670 at the -0.382 as well as $7,800 at the -0.618.
GOLD (XAUUSD): Technical Analysis & Important Pattern to Watch
For some known reason, Gold remains bearish this entire week.
The market is currently correcting within a falling channel - a bullish flag on a 4H time frame.
Ahead, I see a bunch of strong intraday supports.
From one of these structures, a bullish rally may resume.
A trigger that you should look for is a bullish breakout of
a resistance line of the flag and a 4H candle close above that.
A bullish continuation will be expected then.
❤️Please, support my work with like, thank you!❤️
I am part of Trade Nation's Influencer program and receive a monthly fee for using their TradingView charts in my analysis.

BITCOIN (BTCUSD): Strong Bullish Confirmation?!
Bitcoin has a high chance to rise more, following
a strong bullish reaction to a rising trend line on a 4H.
Goal - 108000
❤️Please, support my work with like, thank you!❤️

GBPUSD: Bearish After Opening 🇬🇧🇺🇸
There is a high chance that GBPUSD will drop after the market opening.
I see a strong bearish confirmation after a test of a recently broken trend line.
The price formed a head & shoulders pattern and violated its neckline
on an hourly time frame.
Goal - 1.3425
❤️Please, support my work with like, thank you!❤️
I am part of Trade Nation's Influencer program and receive a monthly fee for using their TradingView charts in my analysis.

GOLD → Continuation of the global trend... To 3350?FX:XAUUSD is testing trend support within a correction. Against a complex fundamental backdrop (the Middle East, Fed comments, Trump's desire to lower rates), the price may continue to rise.
The price of gold rose from a weekly low of $3,363 on Thursday thanks to increased demand for safe-haven assets following reports of possible US strikes on Iran. Markets are ignoring the Fed's hawkish decision to maintain its tight policy and rate forecasts. Traders are waiting for new signals from the Middle East, given the risk of increased volatility due to low liquidity in connection with the US holiday.
Technically, a bullish wedge pattern is forming as part of the correction. The breakdown of the pattern's support did not lead to a decline, but a return of prices and a breakout of resistance could trigger growth after liquidity returns.
Resistance levels: 3373, 3403, 3420
Support levels: 3349, 3320
Before growth, a retest of the trend support or the 3350 zone is possible. However, if the price goes above 3375 and the bulls hold their ground above this level, then we can expect growth to continue within the trend.
Best regards, R. Linda!

BTC is expected to give move by mid or end of July 2025BTC is expected to make a move by mid or end of July 2025
BTC is forming a Bullish Flag Pattern, and it is expected to give a breakout from this flag, by mid or end of July.

Wait for the key points to be confirmed before taking actionThe trend of gold on Friday is still in line with my analysis. Before the market opened, I suggested that gold would rebound from the bottom. Considering the resistance level, I would arrange short orders with a light position. I clearly emphasized that I should not chase short orders at low levels. The actual market price fluctuated upward after hitting the 3340 line at the lowest point, and maintained a range-bound fluctuation pattern as a whole. We arranged long orders in batches at 3342-3353, successfully stopped profit near 3358, reversed shorting, and stopped profit again at 3342. After that, the market hit the top again and was blocked. Short orders were arranged at 3370-3375. It is not recommended to hold positions over the weekend. I have already left the market with a small profit near 3365. Although there was no significant breakthrough, all ended with profit, but it was quite satisfactory for Friday's market.
News: Gold prices were stable on Friday, but fell 1.8% this week. It closed at 3368. The latest Federal Open Market Committee (FOMC) statement reinforced the Fed's cautious stance, keeping interest rates in the 4.25%-4.50% range. However, the statement also lowered the number of expected rate cuts this year, which put downward pressure on gold prices. In addition, U.S. Treasury yields did not change much but rose slightly, reflecting the stabilization of market risk sentiment. The 10-year Treasury yield rose by more than 2 basis points to 4.421%, and the 30-year Treasury yield rose to 4.924%. Rising yields often put pressure on non-yielding assets such as gold, further suppressing the upward momentum of gold prices. The Fed's failure to immediately launch an easing policy, coupled with a stronger dollar and a reduced urgency of geopolitical risks, have all exacerbated selling pressure. Unless tensions escalate again or the Fed unexpectedly turns, short-term gold price forecasts point to further weakening.
The price of gold has rebounded since it fell from its historical high of 3500 to 3120, After continuous rise, due to the decline of risk aversion in the market, it fell under pressure at 3452. It rebounded to 3340 on Friday. The K-line combination arrangement was bearish. The 4H chart showed a stop-loss signal. It is expected that the market will consolidate below 3400 in the short term. In the medium term, attention should be paid to the geopolitical crisis and the July interest rate decision of the Federal Reserve. It will break through the node after confirming the upper resistance of 3400. In the short-term 4-hour chart, the lower support is around 3340-3345, and the upper short-term resistance is around 3380-3385. Focus on the suppression of the 3400-05 line. The overall idea of retracing back to long positions remains unchanged, and the middle area is mainly kept on the sidelines. Be cautious in chasing orders and wait patiently for the key points to be confirmed before intervening. If the upper resistance is not broken, you can still consider light positions to arrange short orders, and pay attention to the bottom for the specific entry point.

LTC coming into MAJOR Support
As you can see in the second photo, LTC has been holding this trendline as support for almost a decade, as far back as 2017. LTC still has a few weeks left to fall but once in comes down in between these 2 major weekly trendlines I have drawn, I think that's as far down as it will go, and we should see a major bounce.


Israel-Iran Confrontation. (I expect upward movement in USD/CADIsrael and Iran are exchanging missile strikes, but it seems markets are trying to play their own game, assuming that this conflict will not cross the nuclear threshold. in the meantime, investors are shifting their focus to key events this week.
The main highlights will be the consumer inflation reports from the UK and the eurozone. In the EU, inflation is expected to stabilize at 1.9%, while in the UK, it is forecast to decrease from 3.5% to 3.3% year over year.
This week will also bring central bank meetings in Switzerland, the UK, and, of course, the U.S. Federal Reserve-which will likely take center stage and divert attention from the tow European central banks.
Other events worth focusing on include the release of the Philadelphia Fed Manufacturing Index U.S. retail sales figures.
But let's return to the week's main event-the Fed's final monetary policy decision, which will be made over two days, Tuesday and Wednesday. According to the consensus forecast, the central bank is expected to leave the key interest rate unchanged at 4,50% The main reasons for this are persistently high consumer inflation figures, which showed an annual increase last week (albeit smaller than expected), and uncertainty about the consequences of Donald Trump's presidency. Fed Chair Jerome Powell has previously cited both as reasons to pause the rate-cutting cycle.
So, what might come of the Fed holding rates steady?
Frankly, not much. Ongoing uncertainty will continue to be the primary driving force in the markets. Traders are starting to anticipate rate cuts in the second half of the year. However, I believe there is a strong chance that rates will remain unchanged until next year. This is due not only to risk of inflation returning to 3% and the murky geoeconomic policies of the U.S.-China trade war and its unclear outcome.
Given this combination of negative factors-each of which obstructs rate cuts-and the fact that the market has already priced these into its expectations, we can anticipate a continuation of existing trends.
The pair is declining amid rising crude oil prices, which support the Canadian dollar, a commodity-linked currency. If oil prices resume upward momentum, USD/CAD will face pressure again. If the pair fails to rise above 1,3600, a decline toward 1.3435 is likely. A potential sell level is 13560.
