XAUUSD 1H TIMEFRAME OVERVIEW ALL MAJOR ZONES/POSSIBLITY OF BEARS🔍 Structure | Trend | Key Reaction Zones
Gold is trading near 3317, after failing to accumulate at higher levels and forming lower highs (LH) and lower lows (LL). Price remains under the descending trendline, showing bearish pressure, but a relief bounce from nearby support is possible.
🧠 Market Overview:
🔻 Trend shifted from bullish (HH/HL) to bearish (LH/LL).
🔁 Breakdown and retests confirm sellers’ control.
📉 Key support lies at 3314–3307 zone (order block).
🔼 Resistance stands near 3330 → 3342 → 3358.
🎯 Key Scenarios:
🔼 Bullish Relief Possibility 🚀
If buyers defend 3314–3307,
then short-term upside targets may be:
🔹 Target 1: 3330
🔹 Target 2: 3342
🔻 Bearish Continuation Possibility 📉
If price loses 3314,
then sellers may push toward:
🔹 3307
🔹 3281 (major liquidity zone)
📌 Current Levels to Watch:
Resistance: 3330 → 3342 → 3358
Support: 3314 → 3307 → 3281
⚠️ Disclaimer: This analysis is for educational and informational purposes only. It is not financial advice. Please conduct your own research before trading.
Trend Lines

Gold Weekly Forecastin Daily time frame price capped between 3268 - 3440 horizontal channel.
If price breaks out from upside , it can raise to 3600 $ at first place.
If price breaks out from bottom and starts dropping , there is a strong demand area in 2500 - 2700 zone. ( fundamentally , it can drop this much if news will be good )

Beware of gold selling wave, surprise attack!
💡Message Strategy
Shining signs of progress in Russia-Ukraine peace talks dampened gold demand, leaving bulls in a wait-and-see mood.
Traders pared back bets on a sharp Federal Reserve rate cut in September after Thursday's stronger-than-expected U.S. Producer Price Index (PPI) data. The PPI rose in July at its fastest monthly pace since 2022. Furthermore, preliminary data released by the University of Michigan on Friday showed one-year inflation expectations rising to 4.9% from 4.5%, and five-year inflation expectations rising to 3.9% from 3.4%.
These data suggest strengthening price pressures, supporting the view that the Federal Reserve is adopting a hawkish stance, which in turn is seen as a headwind for non-yielding gold.
On the geopolitical front, Russian President Vladimir Putin agreed to meet with his Ukrainian counterpart Volodymyr Zelensky for a peace summit, raising hopes for an end to the protracted Russia-Ukraine conflict and potentially limiting any significant gains in the safe-haven precious metal.
📊Technical aspects
Gold is currently under pressure on the daily trend, with the short-term moving average maintaining a narrow fluctuation at a low level. The current price is temporarily supported around 3330, but the rebound strength and continuation on the daily line are relatively weak, and a slight break may occur before a continued downward trend.
Technical indicators on the four-hour chart are slightly negative, suggesting that bulls should be cautious in positioning for any meaningful appreciation in the short term. Therefore, any subsequent rise is more likely to face strong resistance near the 200-period simple moving average on the four-hour chart, which is currently located in the $3,345-3,350 area.
💰Strategy Package
Short Position:3345-3350,SL:3380,Target: 3300,3280

GOLD → The market is waiting for a kick (driver). ConsolidationFX:XAUUSD is in a stalemate. A “casino” pattern is forming in the form of a symmetrical triangle. The odds are 50/50, and everything depends on the fundamental background and the emergence of a driver.
Gold is stuck in a symmetrical triangle - consolidation.
Gold is trading around $3330 on Tuesday, remaining in a range with a downward bias amid caution among traders ahead of the Fed minutes.
Technically, it is possible to trade the breakout from consolidation with the price consolidating above a certain level, i.e., post-factum.
Optimism after the meeting between Trump and Zelensky, who promised to end the conflict, is reducing demand for safe assets, but expectations of a Fed rate cut this year are supporting the metal. An additional factor is the confirmation of the US rating by S&P. Powell's speech on Friday will be a key driver, while the dollar has partially recovered after its recent decline.
Resistance levels: 3349.8, 3370.7
Support levels: 3331, 3315, 3301
Volatility has been very low over the past few days, with the market waiting for someone to kick-start movement. Fundamental factors are contradictory, and technically, gold looks uncertainly weak. Based on this, I expect that a retest of the nearest resistance could end with a downward breakdown from consolidation.
Sincerely, R. Linda!

EURCAD → Countertrend correction before growthFX:EURCAD is forming a correction to the support zone against the backdrop of temporary stagnation of the euro, which is the previous extreme from July 1...
EURCAD is forming a countertrend correction within the global bullish trend. The euro is gradually rising amid the fall of the dollar. The Canadian dollar is consolidating below strong medium-term resistance and may continue its decline, which will only support the bullish trend in EURCAD
Technically, the price is entering a liquidity zone, with a point of interest at 1.61 - 1.609, locally at 1.61225, where the upward support line also passes...
Support levels: 1.6122, 1.6100
Resistance levels: 1.618, 1.625
The main focus is on the specified support zones. If, after a false breakdown of the point of interest, the bulls are able to keep the price above the support zone, then in this case we can expect a possible continuation of the trend. Otherwise, the local trend may be broken and the market will go into a deep correction...
Best regards, R. Linda!

Why The Bubble Theory Makes No SenseIt seems like every other week with tech stocks making new all time highs, there is a constant chatter of claiming we're in a bubble. One of the classic signs of a bubble, is excessive leverage betting on ever higher returns.
This is a chart of securities margin loans provided by the Fed updated quarterly. As you can see since the 2008 financial crisis speculators have been very conservative with their use of leverage. It's almost like 2008 scared people so badly people more than a decade later are still behaving financially conservative.
Some of the rational for the talk of a bubble is historically high PE ratios, but this can be explained by massive reinvestments into AI infrastructure by the biggest tech companies. The more investments they make the higher the PE ratios look.
The key ingredient of a bubble is leverage and besides the small spike of it post-covid, there is no sign of excessive speculation.
Remember tech stocks are absolutely going to have a pullback likely next year or 2027, but the fear of a dot-com era bubble is just simply unfounded.

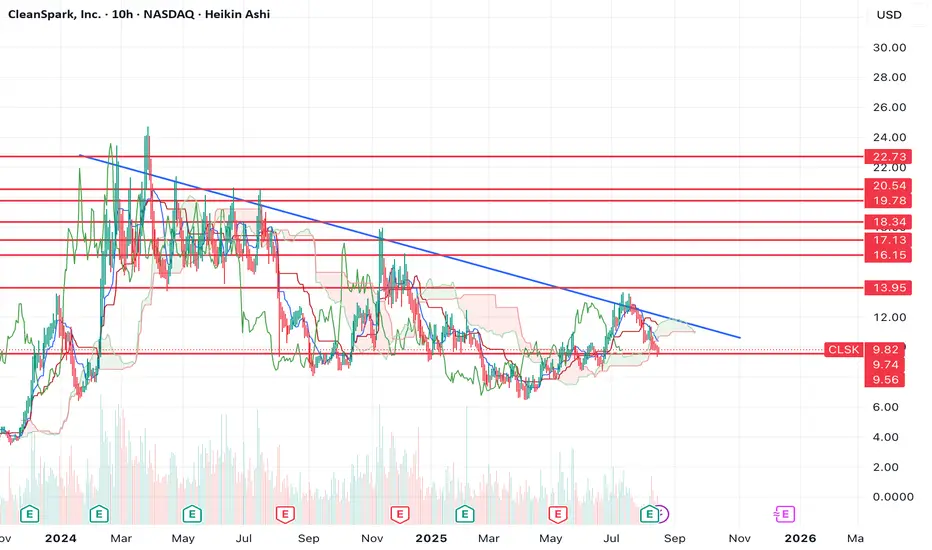
$CLSK another good looking short term long $14-19 target?Assuming NASDAQ:CLSK can keep holding support here, it sets up a very nice long trade.
This hasn't really turned bullish yet on higher timeframes, but if we can see a move start this week, I can see continuation to the upside between the $13 resistance and the $19 resistance on the high side.
The chart looks like it's forming somewhat of an inverse head and shoulders, although I don't like patterns that have diagonal resistances as they're less likely to play out. The measured move of that pattern would be the $17.13 resistance though.
Let's see what happens from here.
XAUUSD H1 – Following Wave 3 DownGold (XAUUSD) on the H1 is respecting Elliott Wave counts. After completing wave (ii)/(b), price rejected from supply and is currently unfolding wave (iii) of (c), pointing towards deeper downside.
-Wave structure shows completion of corrective move and start of impulsive wave 3.
-Clean rejection at 3358–3347 zone (LR & MD block) acting as strong resistance.
-Price breaking trendline, confirming bearish continuation.
-Next liquidity zone sits around 3297–3268 (LZB).
Trade Plan
-Bias: Short / Bearish (Wave 3 in play)
-Entry Zones:
Rejection retest near 3338–3347
Or continuation break below 3327

LLORENTE Y CUENCA, S.A. | Chart & Forecast SummaryKey Indicators On Trade Set Up In General
1. Push Set Up
2. Range Set Up
3. Break & Retest Set Up
Notes On Session
# LLORENTE Y CUENCA, S.A.
- Double Formation
* (A+)) - *Crossing - *Short Entry - *25EMA | Subdivision 1
* #Stop Loss - *(Range Allocation)) | No Size Up | Completed Survey
* 143bars, 1001d | Date Range Method - *(Downtrend Argument))
- Triple Formation
* (P1)) / (P2)) & (P3)) | Subdivision 2
* Weekly Time Frame | Trend Settings Condition | Subdivision 3
- (Hypothesis On Entry Bias)) | Regular Settings
* Stop Loss Feature Varies Regarding To Main Entry And Can Occur Unevenly
- Position On A 1.5RR
* Stop Loss At 10.00 EUR
* Entry At 9.25 EUR
* Take Profit At 6.80 EUR
* (Downtrend Argument)) & No Pattern Confirmation
- Continuation Pattern | Not Valid
- Reversal Pattern | Not Valid
* Ongoing Entry & (Neutral Area))
Active Sessions On Relevant Range & Elemented Probabilities;
European-Session(Upwards) - East Coast-Session(Downwards) - Asian-Session(Ranging)
Conclusion | Trade Plan Execution & Risk Management On Demand;
Overall Consensus | Sell

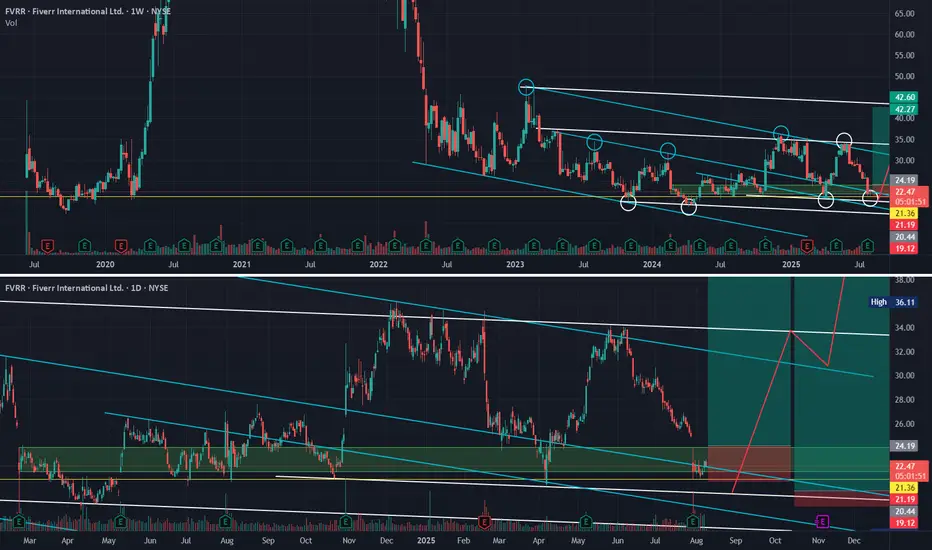
The stock that keeps on disappointing - Where & why I'm bullishFVRR. We all know the company. Many of us have probably waited patiently for a covid-like resemblance of the stock price. And yet here we are, sitting at $22, wondering if we'll ever reach $40 again.
I'm here to tell you, aside from the company being fundamentally strong and proving that with earnings and revenue growth YOY, the algorithms have got your back technically as well!
The overall reason I am technically bullish on this company and have been since April 2024 is the white algorithm as outlined by the white circles in the weekly chart above. Notice any time we are selling down and respecting teal/blue on the buy-side (blue circles), we hold and respect white taper (white circles) on the sell-side and allow for price to make it's way up back toward teal.
Once we prove the white algorithm on the buy-side as well, we will break out of this LTF consolidation and head toward HTF algorithms.
I want to prime you for three possible scenarios:
#1.
We are holding a very strong multi-year demand zone (green box). If we continue to hold this and close back above, as with every other time, it is a strong buy signal.
#2.
We are holding above a multi-year support zone at $21.70 (yellow line). This has held us (save for one or two liquidity grabs) since the company's IPO. Another attempt at this level will be a no-brainer scoop-up as far as R:R is concerned.
#3.
My prediction (and hope) is that we are trying, once again, to prove this white tapered algorithm on the sell-side. If we do that, we give price the ability/permission to break out of teal once and for all and head toward the fair-value pricing of this company (according to all the analysts - not me) in the $40+ range.
This is another one that may require a bit of patience to get the best case scenario - allowing for a push lower toward our HTF white algorithm.
In any case, I am still bullish on this chart - even with all the selling pressure and sideways movement.
Happy Trading :)
Bullish on BULLBULL offers an interesting opportunity. We've seen the potential of tech-focused trading companies such as Robinhood and what a strong & consistent user base can lead to in terms of shareholder return.
BULL offers something similar.
While I'm not personally a user, I know that I see it everywhere from Instagram to Tiktok - and that tells me more than I need to know. Similar to my conviction of RBLX which I've been preaching since $30 - if people use it, it is valuable.
Which takes me to the technicals:
We can clearly see in the charts short history that since the IPO and subsequent dump, we have been casually tapering in our white algorithm. This is great news if we are patient.
We are not looking at multiple strong (red) selling algorithms broken and have also identified our bearish green buying channel (which leads us to a dump everytime).
Why is this time different?
We are not buying in green but rather tapering along a LTF white algorithm. The more we prove this lower time frame white, the more likelihood we break out of HTF white and find HTF teal.
We are not looking to "invest" in BULL here - even though that wouldn't be a horrible idea in my opinion. We are looking to execute on trade opportunities that can yield us a solid return relative to our risk. This may be one of those opportunities.
Current Scenario:
After a recent strong breakout of LTF teal toward our HTF demand, we are pulling back and re-entering a HTF demand zone. This is a zone that was recently flipped from supply (resistance) to demand (support) - meaning, buyers are present here and have proven that they will step in here.
IF we get that confirmation and show strength to break back out of this demand zone and subsequently LTF teal, we have a great trade opportunity toward HTF white and to leave a runner for HTF teal and beyond.
Targeting a 3-4 R:R with a stop-loss below our LTF white algorithm which has been proving itself on the sell-side.
Happy Trading :)

EUR/USD Bullish But... Trendline📊 EUR/USD Technical Analysis – August 19, 2025
The Euro/Dollar pair is currently trading around 1.1657, showing consolidation after recent strong moves.
🔹 Key Fibonacci Levels
Immediate resistance at 1.1687 (38.2%).
Psychological and technical barrier at 1.1775 (50%).
Major resistance at 1.1867 (61.8%).
Upside extension projected towards 1.2159 if the bearish trendline is broken.
🔹 Trend
The descending trendline (in purple) continues to act as a dynamic ceiling. Unless broken decisively, upside potential may remain limited.
🔹 Important Supports
First support at 1.1575 (23.6%).
High-liquidity zone between 1.1450 – 1.1370, crucial to maintain the medium-term bullish structure.
A break below 1.1275 could open the door to a deeper correction.
📌 Conclusion:
The pair is at a decision point. A breakout above the trendline and 1.1687 could trigger fresh bullish momentum. On the other hand, losing the 1.1575 – 1.1450 zone would increase the likelihood of a deeper pullback.

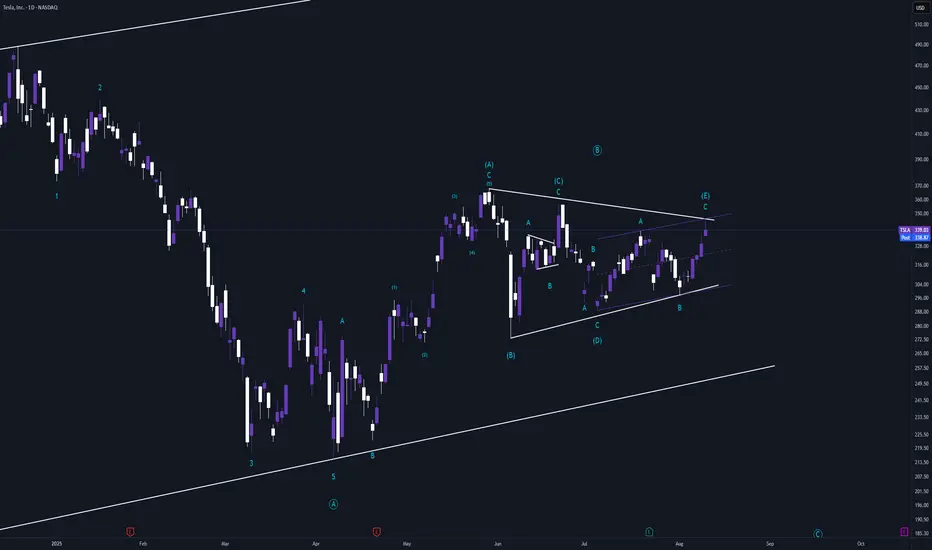
TSLA Potential Triangle FinishSeeing a lot of pots around the TSLA breakout. The rejection off the top of the ABC channel starting in July makes me think that this triangle is in play and TSLA will begin heading back down from here. Invalidation above 357.
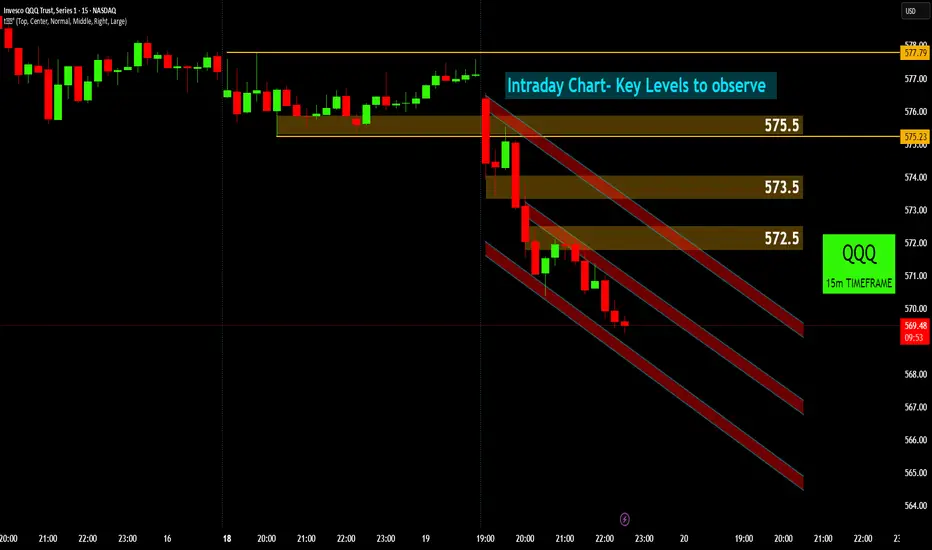
QQQ: Navigating the Intraday Downtrend🔭 QQQ's Current View: Bearish Channel in Focus! ⬇️
QQQ's intraday chart shows a recent breakdown, with price now navigating a clear bearish channel.
Initial Breakdown: QQQ experienced a sharp drop below 575.5 💥, turning previous support into immediate resistance. This marked the start of the current bearish leg.
Bearish Channel Formation: Price is now moving within a well-defined descending channel 🔽🔽🔽. This indicates short-term bearish control, with sellers dominant.
Overhead Resistance Zones: Key resistance levels to watch are 572.5 🧱 and 573.5 🧱. These levels, along with the channel's upper boundary, represent potential areas where sellers might step in if price attempts to rally.
Intraday Outlook: Traders should monitor how QQQ reacts within this channel. A move above the channel and 573.5 would signal a shift, while continued weakness points to further downside potential within the channel. Stay vigilant on these key levels for any intraday reversal or continuation signals.
Disclaimer
The information provided in this chart is for educational and informational purposes only and should not be considered as investment advice. Trading and investing involve substantial risk and are not suitable for every investor. You should carefully consider your financial situation and consult with a financial advisor before making any investment decisions. The creator of this chart does not guarantee any specific outcome or profit and is not responsible for any losses incurred as a result of using this information. Past performance is not indicative of future results. Use this information at your own risk. This chart has been created for my own improvement in Trading and Investment Analysis. Please do your own analysis before any investments.
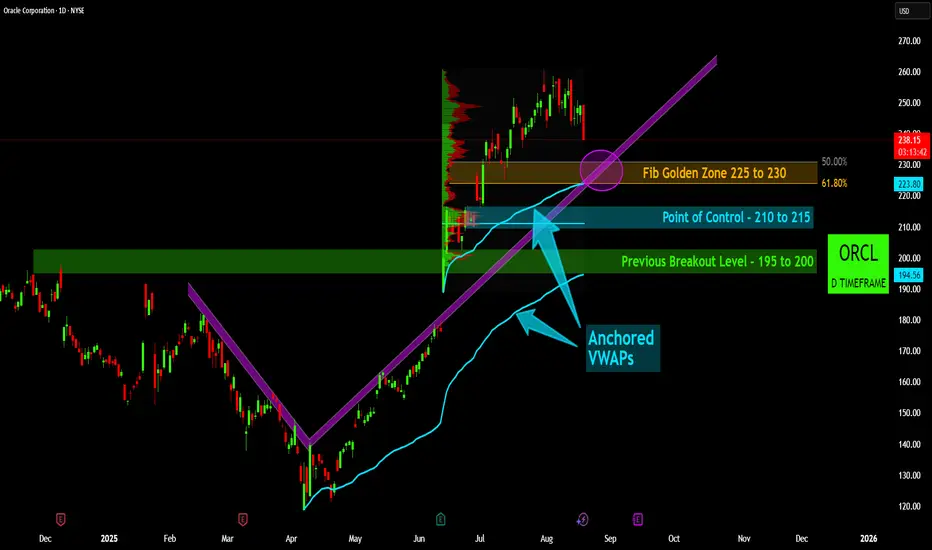
ORCL: Riding the VWAP Waves Towards Critical Support! 🌊 ORCL: Riding the VWAP Waves Towards Critical Support! 🧐
Oracle (ORCL) has displayed remarkable strength, and its current price action is nearing critical support levels that demand attention from traders and investors alike.
Established Uptrend & Underlying Strength: ORCL has been in a robust ascending trend ⬆️⬆️⬆️ since its April lows, clearly demonstrated by the dominant purple trendline. This sustained upward momentum indicates strong underlying demand and positive market sentiment, with buyers consistently stepping in to support higher prices.
Primary Support Confluence: Fibonacci & Trendline: The stock is currently undergoing a healthy correction, approaching a highly significant Fibonacci Golden Zone 🟡 between $225 and $230. This zone aligns perfectly with the crucial ascending trendline 🟣 that has guided the uptrend. Furthermore, an Anchored VWAP 🌊, reflecting volume-weighted average price from a key low, converges into this same area. This powerful confluence of indicators makes this zone a critical area for potential support and a strong candidate for a bullish reversal.
Deeper Support Layers: Point of Control & Breakout Level: Should the primary Fib Golden Zone fail to hold, deeper but equally significant support levels await. The Point of Control (POC) ⚖️ at $210 to 215 represents a high−volume node where significant trading activity occurred, often acting as a magnet and strong support. Further down, the Previous Breakout Level 🧱from $195 to $200 marks a re-test of prior resistance that turned into support, offering a final robust line of defense.
Outlook: Patience for Confirmation: Traders should closely monitor price action around the $225−$230 zone. A bounce and sustained move higher from this confluence, ideally accompanied by increased volume, would signal confirmation of the uptrend's continuation. Conversely, a decisive break below these levels would shift focus to the deeper support zones. The current setup offers strategic entry opportunities for those looking to participate in ORCL's ongoing uptrend.
Disclaimer
The information provided in this chart is for educational and informational purposes only and should not be considered as investment advice. Trading and investing involve substantial risk and are not suitable for every investor. You should carefully consider your financial situation and consult with a financial advisor before making any investment decisions. The creator of this chart does not guarantee any specific outcome or profit and is not responsible for any losses incurred as a result of using this information. Past performance is not indicative of future results. Use this information at your own risk. This chart has been created for my own improvement in Trading and Investment Analysis. Please do your own analysis before any investments.
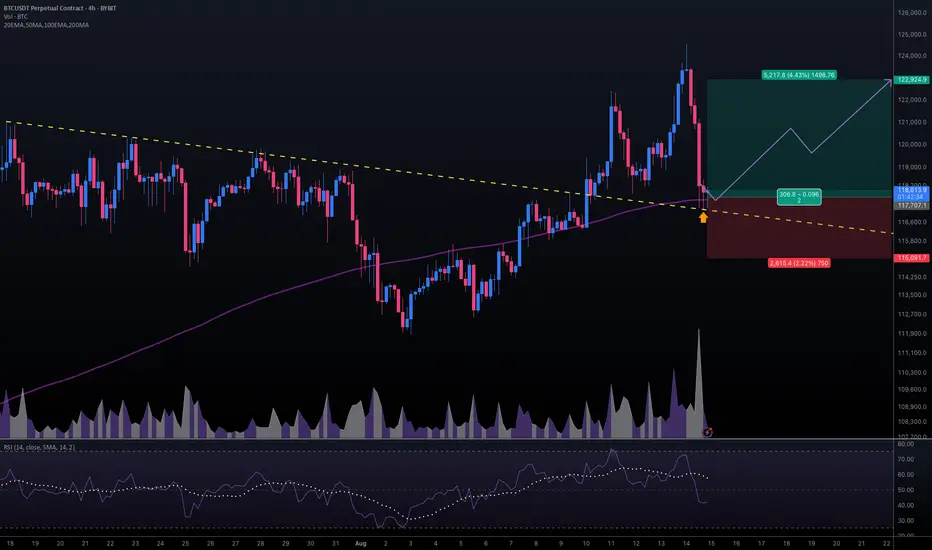
#BTCUSDT #4h (ByBit) Descending trendline breakout and retestBitcoin pulled back to 200MA support where it printed a kind of bullish hammer, seems likely to bounce.
⚡️⚡️ #BTC/USDT ⚡️⚡️
Exchanges: ByBit USDT
Signal Type: Regular (Long)
Leverage: Isolated (18.0X)
Amount: 5.0%
Entry Targets:
1) 117707.1
Take-Profit Targets:
1) 122924.9
Stop Targets:
1) 115091.7
Published By: @Zblaba
CRYPTOCAP:BTC BINANCE:BTCUSDT.P #4h #Bitcoin #PoW bitcoin.org
Risk/Reward= 1:2.0
Expected Profit= +79.8%
Possible Loss= -40.0%
Estimated Gaintime= 1 week
Silver is Again in the Bullish directionHello Traders
In This Chart XAGUSD HOURLY Forex Forecast By FOREX PLANET
today XAGUSD analysis 👆
🟢This Chart includes_ (XAGUSD market update)
🟢What is The Next Opportunity on XAGUSD Market
🟢how to Enter to the Valid Entry With Assurance Profit
This CHART is For Trader's that Want to Improve Their Technical Analysis Skills and Their Trading By Understanding How To Analyze The Market Using Multiple Timeframes and Understanding The Bigger Picture on the Charts

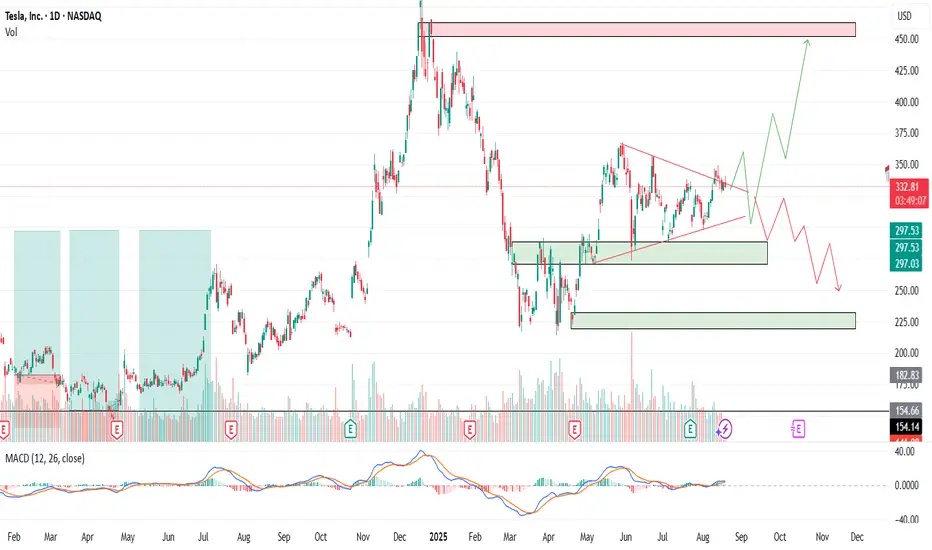
TSLA – Buy the Fear or Wait for the Setup?Tesla (TSLA) is once again in the spotlight. Between robo-taxi hype, new product launches, and ongoing political noise around Elon Musk, the stock has become one of the hottest trading stories on the market. But as always the chart tells us where to act.
Entry Levels
$330 – First line of defense, early buyers may step in here
$295 – Stronger support, better reward-to-risk zone
$255 – Deep pullback level, only triggered on market weakness
🎯 Profit Targets
TP1: ~$345 → ~5% move from $330 entry
TP2: ~$370–$380 → 12–15% move depending on entry
TP3: ~$400–$420 → 18–20% move on a sustained breakout
Tesla remains a trader’s stock: volatile, narrative-driven, and technically reactive. If it holds the $330 zone, momentum traders could see a quick bounce. If we dip to $295 or even $255, that could be the bigger opportunity for those with patience.
No one knows which path the market chooses, but the plan is set. Trade the structure, not the noise.
⚠️ Disclaimer: This is not financial advice. I’m sharing my personal analysis and trade levels. Always do your own research and manage risk responsibly.
18.08 2025 TARGET DONEAs I was writing yesterday the price should go down and we made it. First target of 3 gets full filled so I can easily close the position at the + or hold this position and wait for the price to go lower. This everyone own decision I close my position now from shorting from 116,300 and closed it at 113,900 so I made money and this is important thing. Enjoy the money and stay tuned.

Warm beer or tasteless lager? (GBP/AUD)Setup
After a multi-week surge from below 2.0 to over 2.15, the price pulled back 61.8% of the gains and rebounded from just under its 30-week SMA. A break of a down trendline connecting the 3 peaks could signify a resumption of the long term uptrend.
Signal
The daily chart shows price attempting a break below a rising trendline and RSI dipping below support before rallying back above it - just like the other GBP pairs. A breakout over 2.10 would confirm the bullish momentum.

ETHUSDT broke all major resistances ---> retest ---> PumpPrice on weekly chart broke our first target which was near 3800$ and also broke 4K$ resistances and now above 4K$ market is still extremely bullish and we can look for targets like 5K$ and 7K$.
Notice: only and only if the price dump below 4K$ market is a little range or bearish so for now we are still on bullrun.
DISCLAIMER: ((trade based on your own decision))
<<press like👍 if you enjoy💚

SLPUSDT Red trendline Soon will break Somehow market is here dead and yeh that is true the market and price here is range and dead but once a 6 months we have some sharp pump here and we can expect that happen again and first target for now is also that red trendline and 0.0030$ which is about 70% pump from here.
any breakout there can cause more pump and gain but breakout with high volume is needed first.
DISCLAIMER: ((trade based on your own decision))
<<press like👍 if you enjoy💚

GBPAUD: Bullish Wave Will Continue 🇬🇧🇦🇺
On a today's live stream, we discussed GBPAUD.
The price successfully violated both a falling trend line
and a strong horizontal resistance on a daily.
The next historic resistance is 2.095.
It will be the next goal for the bulls.
❤️Please, support my work with like, thank you!❤️
I am part of Trade Nation's Influencer program and receive a monthly fee for using their TradingView charts in my analysis.

CRYPTO: BTC.D (1W)Currently, we are at a crucial point where the price is playing at the trendline. Once we see a breakout + retest, this is our time to shine! We can see BTC.D hitting targets from 47.06% to 43.68% On the other hand, if the price bounces on the trendline, it may reach to 69% to 73.59%.
I am leaning towards the breakout + retest as of the moment since it is showing clear signs that we are going to see a bull run in the coming months.
