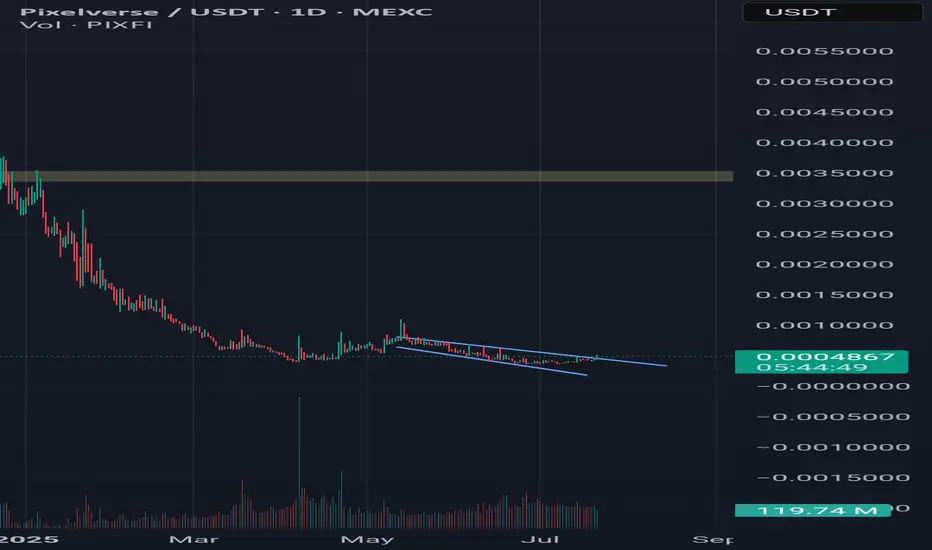
Pixel is longHello, today I will update you with the pixel analysis. I hope you enjoy it. This is a branch analysis. Be careful. If a daily candle closes above 0.0004848, we will go for a target close to 10x. Don't miss the opportunity. 0.0035 is just a few steps away.😉Be profitable.Please give me energy with your comments and likes and express your opinion.🇮🇷
Trend Lines
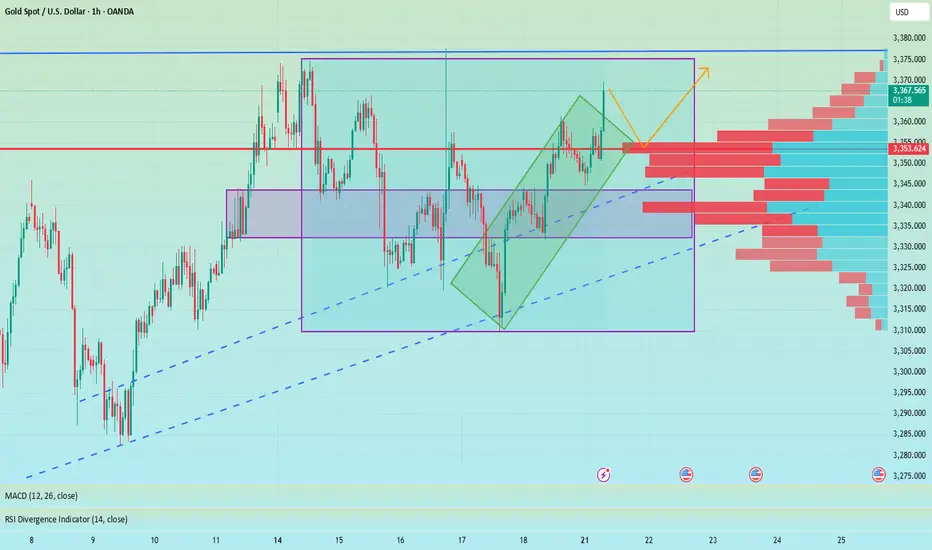
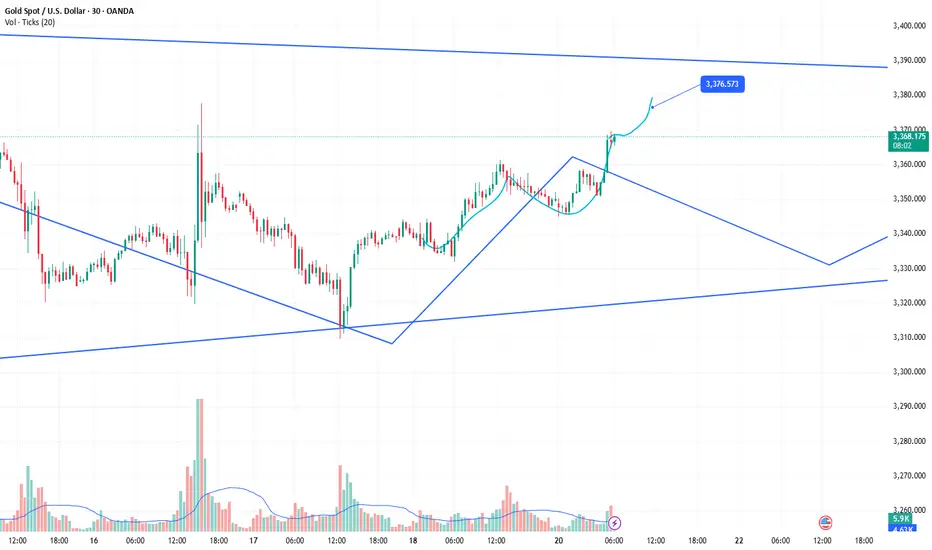
Accurate prediction, continue to buy after retracement to 3353📰 News information:
1. The Trump administration puts pressure on the Federal Reserve to cut interest rates
2. The continued impact of tariffs and the responses of various countries
📈 Technical Analysis:
Gold is currently rising rapidly, reaching a high near 3368, and the overall bullish trend has not changed yet. It is not recommended to continue chasing the highs at present. Those who are long at 3345 can consider exiting the market with profits. The technical indicators are close to the overbought area and there is a certain risk of a correction. Be patient and wait for the pullback to provide an opportunity. At the same time, 3353 has become the position with relatively large trading volume at present, and the top and bottom conversion in the short term provides certain support for gold longs. If it retreats to 3355-3345, you can consider going long again, with the target at 3375-3385. If it falls below 3345, look to 3333, a second trading opportunity within the day. If it falls below again, it means that the market has changed, and you can no longer easily chase long positions.
🎯 Trading Points:
BUY 3355-3345
TP 3375-3385
In addition to investment, life also includes poetry, distant places, and Allen. Facing the market is actually facing yourself, correcting your shortcomings, facing your mistakes, and exercising strict self-discipline. I share free trading strategies and analysis ideas every day for reference by brothers. I hope my analysis can help you.
FXOPEN:XAUUSD OANDA:XAUUSD FX:XAUUSD FOREXCOM:XAUUSD PEPPERSTONE:XAUUSD TVC:GOLD
Why I Went Long on AMD Near the 2025 Lows🔍 Reason for the Trade
This wasn’t just a “buy the dip” setup — this was a calculated trade based on strong confluence:
✅ Multi-Year Demand Zone
Price returned to a massive support level that’s held since 2020. This zone had previously triggered multiple large bullish reversals.
✅ Falling Wedge Breakout
A textbook falling wedge pattern formed during the pullback. Once price broke out, the momentum confirmed a structural reversal.
✅ Risk/Reward Optimization
I positioned my stop just under key support, with targets set at prior structure highs. The setup offered a clean 2.5:1+ R/R ratio, perfect for swing conviction.
✅ Institutional Accumulation Area
The volume and wick rejections in this zone screamed smart money stepping in. It was a classic sign of fear-based selling into patient buyers.
🧠 Lessons Reinforced
- Wait for the Zone, Then Act: Patience paid off — the best trades come from the best levels.
- Structure Over Emotion: I trusted the technical, not the bearish headlines.
- R/R Always Wins: You don’t need to be right every time, but when you’re right — let it run.
#AMD #SwingTrade #TechnicalAnalysis #SupportAndResistance #WedgeBreakout #RiskReward #PriceAction #StockMarket #TradingView #TradeRecap


Gold is rising steadily, finding the right buying point is the k
There are no eternal friends, only eternal interests. Value exchange is the "code" of interpersonal relationships. From the president to individuals, the game of interests is everywhere.
Half a year ago, Musk strongly supported Trump to take office. The two joined forces to win the swing states. One gained power and the other gained fame. After Musk became the head of the efficiency department, he made drastic reforms and fought corruption from the outside to the inside.
Now, the two have parted ways. According to US media reports on July 20, Trump began to review the order contract between Musk's Space X and the federal government. In just 6 months, the two went from close friends to opponents. The "big and beautiful" bill was also strongly resisted by Musk.
If the big guys are like this, let alone ordinary people, their butts determine their heads, sitting in different positions to think about different interests, emotions and friendship are just outer garments, Musk spent $270 million and got fame, and Trump also got the power he pursued, there is no right or wrong.
This struggle is far from over. It is estimated that the game will continue during Trump's four years in office. Musk stands on the high-dimensional pursuit of interests for the exploration of human progress, while Trump's slogan is to make America great again. The two people have taken different routes.
What we care about is not the right and wrong of the two, but whether this right and wrong will bring turmoil to the financial market. Will Tesla be the "prince in distress"? Is there a possibility of bargain hunting after the stock price plummets in the short term? Will the gold market trigger risk aversion because of Trump's unpredictable approach? This is what we need to ponder and study.
Okay, let's talk about the gold market today:
During this period, the volatility of the gold market has become smaller and smaller, and the range of fluctuations has also been compressed. The sentiment of investors in the market is relatively low. When the fluctuations just started in April, some people who were trapped were concerned about when to get out of the trap every day. After 3 months, everyone is tired, and the fight between bulls and bears has cooled down.
However, as the shock is coming to an end, the gold price may explode into a new round of unilateral market at any time due to fundamentals, especially on August 1, Trump will implement equal tariffs on global trading partners. This king bomb has been delayed. Once it starts to land, it will inevitably cause turmoil in the financial market.
Since last week, affected by Trump's threat to fire Fed Chairman Powell, the gold price quickly hit the high of $3,370 and then fell back to $3,310. After that, the price lows continued to rise and rebounded. The top and bottom conversion of $3,345 in the morning and the support of the low point in the early morning of last Friday were the starting points for the rise. Today, the focus is on the long-short dividing point of $3,345, that is, the price is temporarily not empty above $3,345. Today is not a sharp rise at the opening. The prerequisite for a sharp rise must be that $3,345 breaks.
Today, I think that 3345 USD should be used as the dividing point between long and short positions, that is, your stop loss should be placed below 3345, and then find a position to go long, such as within the range of 3360-55, first look at 3370-75 above, and then look at 3392-95 USD after breaking through. Some people say that they dare not do such a large stop loss? In fact, just reduce the position. The stop loss space is dynamically adjusted according to the support level. Fixed stop loss space is a false proposition.
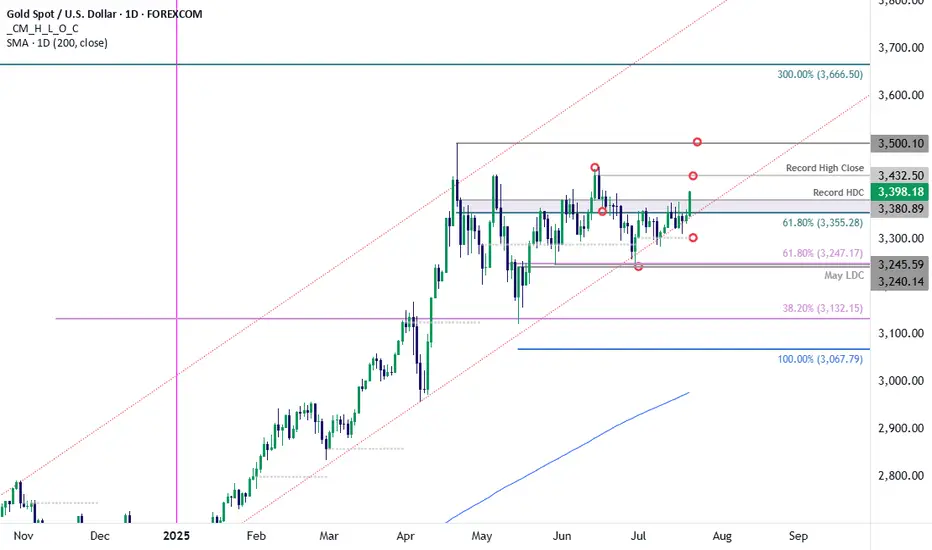
Gold Bull Charge- XAU/USD Clears July Opening-RangeGold is attempting to breach resistance today at the 61.8% retracement of the April decline / record high-day close (HDC) at 3355/80- watch the close.
The advance marks a breakout of the July opening-range and a topside breach here exposes the record high-close at 3432 and the record highs at 3500.
Initial support now back at 3355 with bullish invalidation steady at the objective monthly open at 3303.
-MB
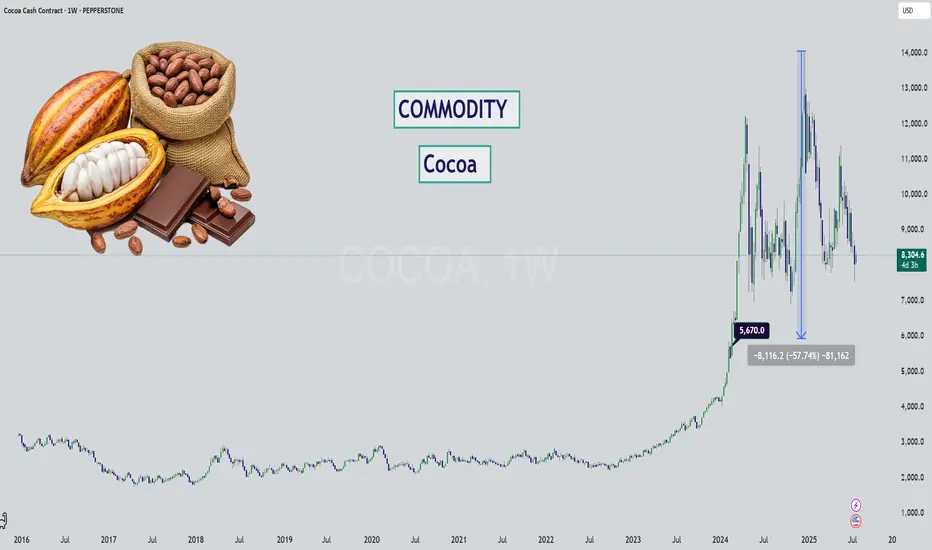
Cocoa - Chocolate is DIPPING (literally)Hello Market Watchers 👀
I bring today an update on your favorite commodity (mine actually)... 🍫
The weekly timeframe from a multi-year perspective is what's on the cover and one thing is clear - cocoa has never increased so much as it during May23' to Dec24'.
Sure inflation brought on by covid has a role to play. But even so, factoring in the amount of +509%? That is way out.
We could likely see this kind of stair step down movement on cocoa, since it has been following the logic of: " previous support = new resistance ".
Either way what this tells me is that cocoa has been running overly hot for too long... and it's time for a cooldown. Prices will likely never return to pre-covid levels, unless there is unfortunate weather or other supply chain issues.
Ultimately, a return back to the $5,600 zone would be a reasonable market correction for such a large increase.
BTCUSDBTCUSD also fell from a high level, reaching a high of around 119700, only 300 points away from the target of 120k. The price after the decline is now around 118600. Buying at a low level is the main focus. The reference buying point is 118500-118000. The target is above 120k. Stop loss 117300
XAUUSD:The next target is 3430.The market is developing completely in accordance with the expectations of the band trading center. Today is a day of sharp rise. As Monday, this increase is quite considerable.
The three reminders to buy are all at a lower position. The post clearly points out that the market has reached 3400. 3400 is a controversial position. It needs to fluctuate in the New York market, and then there will be some breakthroughs. If it is stronger, it will directly break through the New York market. In the short term, you can pay a little attention to the retracement position of 3390-3395. Then continue to buy. The next target is 3430.
USDJPY BREAKOUT IN H1 Price just broke out of the trendline that was formerly serving as support. A sell opportunity is envisaged from the current market price. Target profit is at 146.207

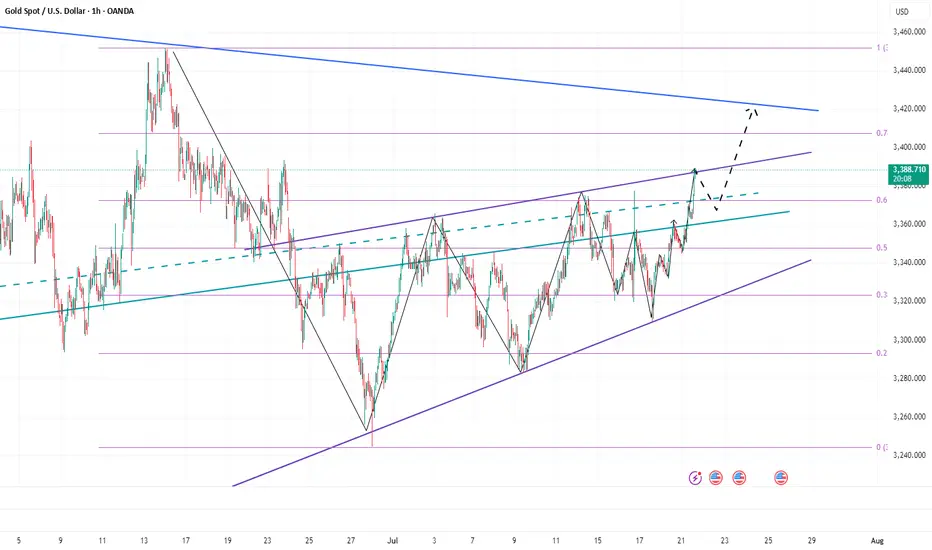
Warning Signs After Gold’s Sharp Rise — Is a Pullback Coming?Today, gold rebounded from around 3345, and has now rebounded to around 3389, which is only one step away from the 3400 mark. Gold has hardly retreated during the rise, and the rise is strong. However, we can see from the small-level candle chart that gold suddenly accelerated its rise after consolidating around 3365, and continued to around 3390, and is now oscillating near the recent high trend line.
After gold accelerated its rise and oscillated near the recent high trend line, this made me have to be more cautious, because we must be careful that the acceleration of gold's rise in the short term is a trap for buyers, so even if we are bullish on gold in the short term, we should not directly chase gold at a high level; according to the current structure of gold, I think it is necessary for gold to retest the 3370-3360 area support before continuing to rise and hitting 3400. Only after verifying that the support in this area is effective can it be conducive to a better rise in gold!
So for short-term trading, I think we can still try to short gold now, and then wait patiently for gold to retest the 3370-3360 area.
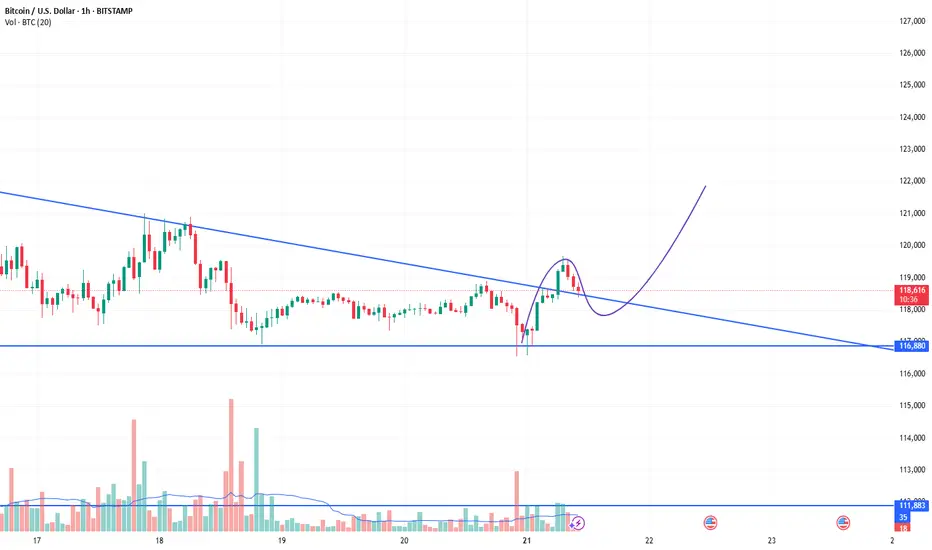
HelenP. I Bitcoin will rebound from trend line and rise to $123KHi folks today I'm prepared for you Bitcoin analytics. If we look at the chart, we can see a very clear and long-term bullish structure. The entire uptrend is supported by a major ascending trend line that has acted as a reliable foundation for the price for a significant amount of time. Currently, the price is consolidating above this crucial trend line and is interacting with the key support zone between 117500 and 116700 points. I believe that the most probable scenario here is a brief corrective move downwards for the price to properly retest the main ascending trend line. This type of retest is often a healthy sign in a strong trend, as it allows for the confirmation of support and gathers momentum for the next leg up. A strong rebound from this trend line would serve as a powerful signal that the buyers are still in control. Therefore, once the price confirms its bounce from this dynamic support, the path should be clear for a continuation of the uptrend. For this reason, my primary goal for this trade idea is set at the 123000 points. If you like my analytics you may support me with your like/comment ❤️
Disclaimer: As part of ThinkMarkets’ Influencer Program, I am sponsored to share and publish their charts in my analysis.

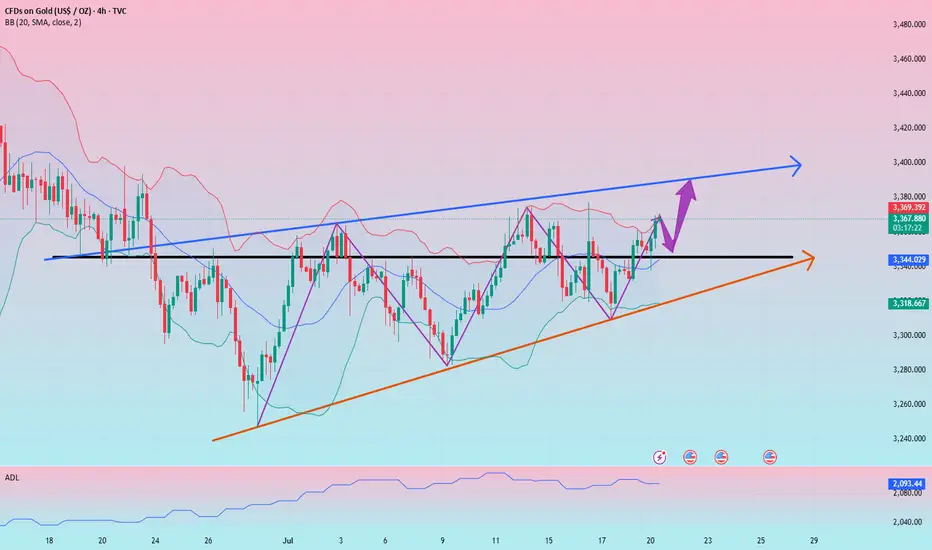
Trend breakout towards master(ATH) trend line Purely from a trend line POV and HTF (M, W,D) POCs, which have been tested multiple times confirming their validity, best case scenario is a retest of the upper trend line that originates from the all time high.
The lower trend line has been tested and defended @ 3311. The continuation of this leg has faced initial resistance from a level @3360 where price closed below decisively after news event.
Favourite scenario is a pull back to last weeks VAL where the weekly candle closed above signalling buyers were keen on such level @3300, clear support formed to confirm validity of the level and upside target to 3400

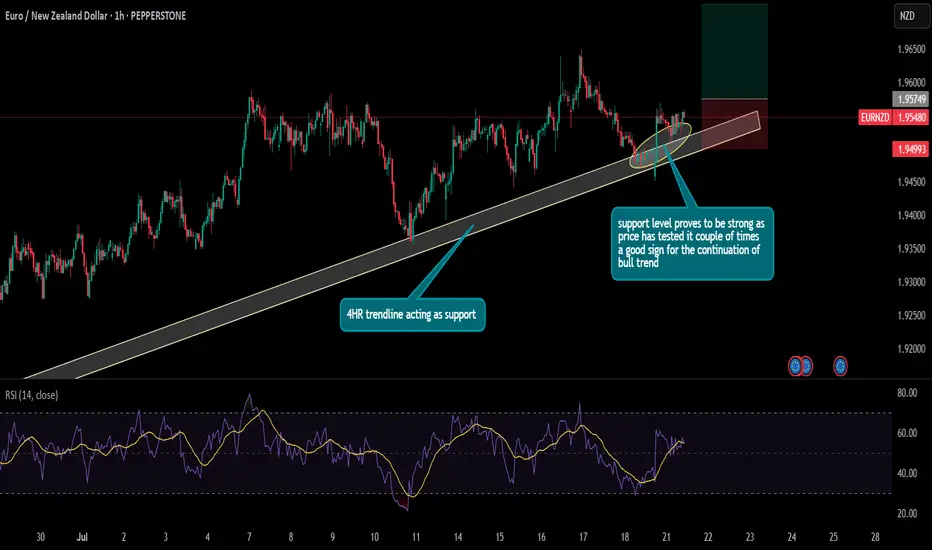
EURNZD continues to be in bullish trend as shown in the chart, the 4-hour tf trendline is acting as a strong support level since the price has tested it multiple times to continue the bullish trend therefore a buy trade idea has been given on the chart according to the price action
Gold is about to approach the top suppression position, so be ca
Today, Monday, gold continued its upward trend from last Friday, and the highest so far is around 3370.
Last Thursday, it once reached a low of 3309, and then rebounded sharply, entering the upper suppression area again.
First of all, from the current perspective of the US dollar:
The US dollar is currently in a retracement, and the rise of gold is understandable.
The US dollar has not yet stepped back to the right level, at least it has to step back to around 98.0.
And it has to stabilize at the support near 98.0, so the US dollar may stretch again in the future.
Once it stretches from 98.0 again, the highest can reach above 99.0.
If the US dollar can stabilize above 98.0, then gold should also reach its peak by then.
To be honest, gold is still a little short of the mark at the moment.
3370 is not the top position. It would be best if it could reach a new high, break through around 3380, and then come down again, then the top can be determined.
From the current 4-hour gold chart, we can also see that the top suppression position has not been touched.
Therefore, we still cannot act rashly and cannot chase too much.
It is best to wait for the US market to reach around 3380 to form a top structure.
Combined with the situation of the US dollar, short gold, if gold falls again, at least go back to test 3330-40.
If the US dollar is stronger and can stand above 99.0, it is also possible for gold to directly fall below the 4-hour chart trend line support.
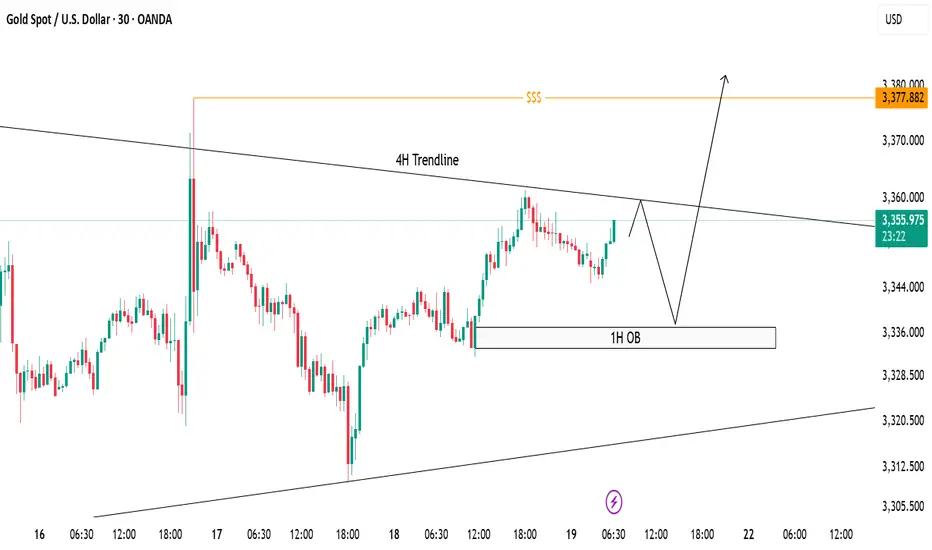
XAUUSD Trade Idea - 30m Structure with 4H ConfluenceCurrently, price is trading below the 4H descending trendline, respecting bearish structure on lower timeframe (30m).
✅ 1H Order Block (OB) marked between 3335-3340 remains a strong demand zone where price can bounce break the trendline to sweep liquidity above around 3377 to form bullish continuation.
📌 Scenarios I'm Watching:
Short-term rejection from the 4H trendline.
Potential reversal towards 1H OB.
Bullish reaction from OB could trigger a breakout above the 4H trendline.
Final upside target remains at the liquidity pool around 3377 zone ($$$).
🟣 Overall Bias: Bullish after liquidity sweep. Watching for bullish confirmation at OB before executing buys.
Bear Despite major trend being bulls we have a n opportunity to sell at this region (1Day resistance line and target previous 4hr resistance line that has been broken

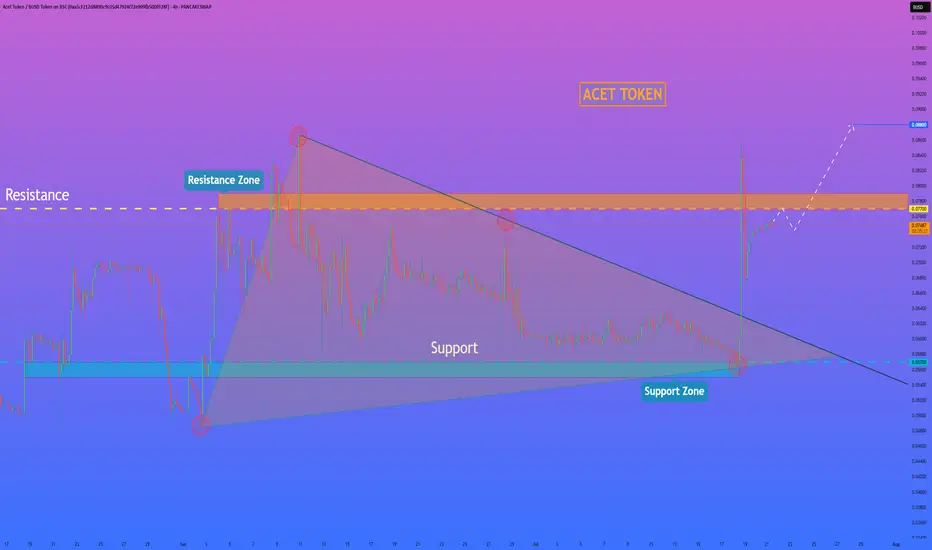
HelenP. I Acet Token may make correction and then continue growHi folks today I'm prepared for you Act Token analytics. If we look at the chart, we can observe a clear technical picture. For a considerable amount of time, the price was tightly compressed inside a large downward wedge, defined by a robust support zone at 0.0570 - 0.0550 and a descending trend line that put consistent pressure on the price. Such long consolidation periods often precede a powerful expansion. Recently, we have witnessed a decisive breakout from this wedge, confirmed by a strong impulse candle. This move signals a clear shift in market sentiment from neutral to bullish and invalidates the prior constraining structure. I believe that the momentum from this breakout will be sufficient to challenge the next major obstacle: the horizontal resistance zone at 0.0770 - 0.0790. This is a critical level to watch, as it has previously rejected price advances. My scenario implies that after potentially a small, healthy correction or retest, the price will continue its upward movement. A successful break above this critical area would confirm the newfound strength of the buyers and open up a clear path for further appreciation. For this reason, my primary goal, the logical target for this move, is set at the 0.0880 level. If you like my analytics you may support me with your like/comment ❤️
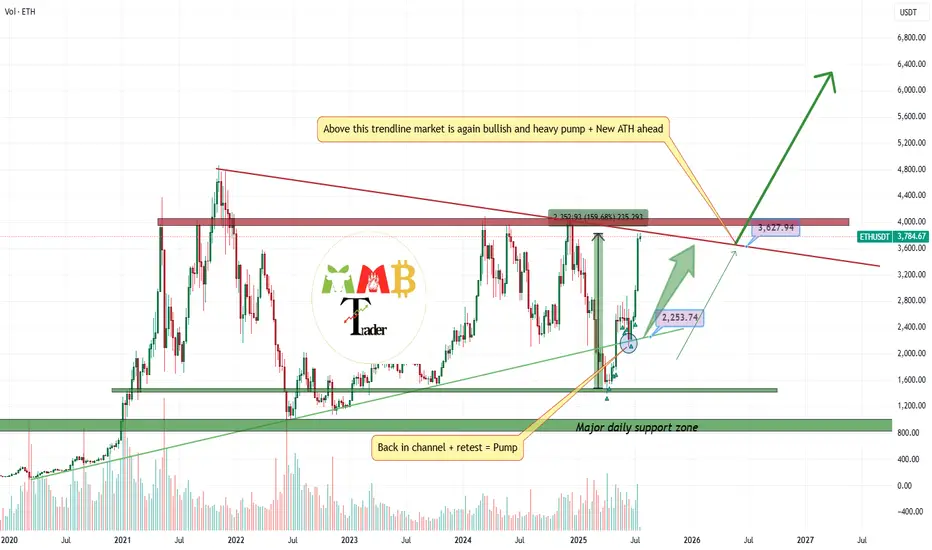
The best Buy call doesn't exists?(+160% profit on ETH)After i open long at weekly low and it almost play well until now:
\https://www.tradingview.com/chart/ETHUSDT/BrdJLvgY-ETHUSDT-near-two-major-weekly-support-and-soon-2200/
Now i am looking for range here or without that range ASAP red trendline will break to the upside and more pump and gain also is expected and this is just the beginning.
DISCLAIMER: ((trade based on your own decision))
<<press like👍 if you enjoy💚
SOLUSDT at least is targeting 300$ this time We are looking for more pump for BINANCE:SOLUSDT on this market and at least after breaking and hitting first targets which are 200$ and 250$ then it is time for new ATH above the 300$.
Major supports and resistances are all mentioned on the chart too.
DISCLAIMER: ((trade based on your own decision))
<<press like👍 if you enjoy💚

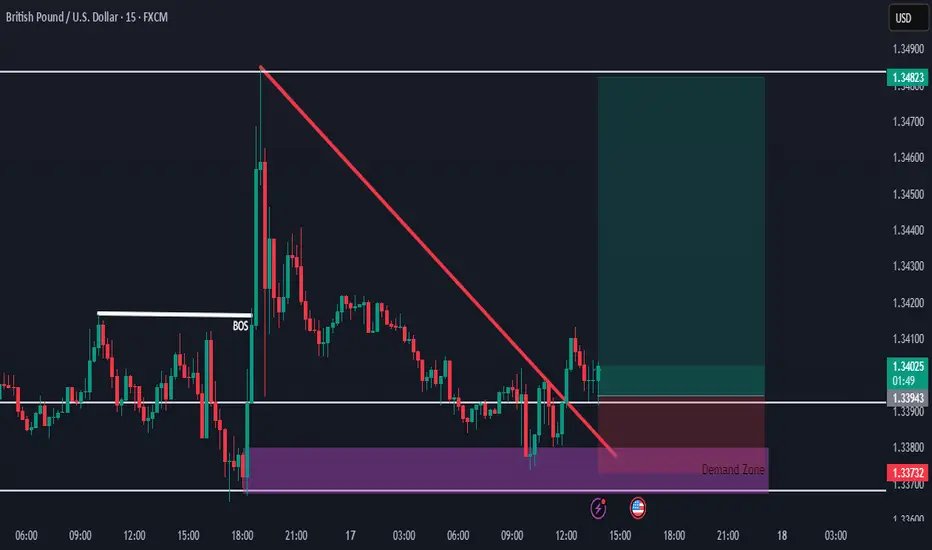
GBPUSD Buy Setup from Strong Demand ZoneHello everybody!
Price is in a higher timeframe demand zone, which is very strong and a good place to buy.
We were waiting patiently for confirmation, and now we have two key signals:
1- After a break of structure in the market, a small demand zone has formed.
2- The break of the downward trendline is where we entered the buy position.
Ultra-short-term trading. Profit of $10/ounceThe order to buy XAUUSD successfully made a profit. The current gold price is 3367. Stimulated by the weekend news, the expected trend was achieved smoothly, and the short-term bulls were strong. Buying can continue to be the main focus. Relying on the half-hour and one-hour trends, trading can be carried out in the London market for the purpose of buying and profit. The increase is about $10/ounce.
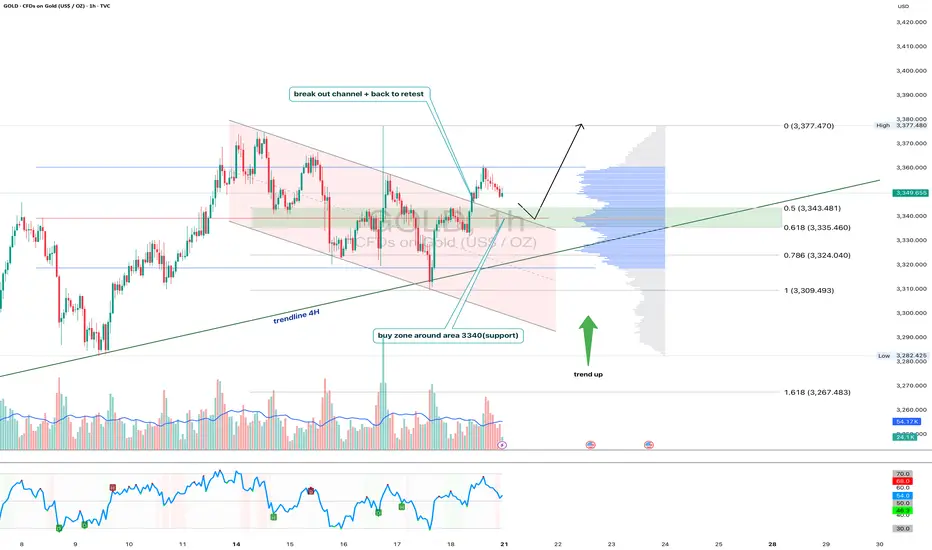
Gold 1H - Retest of channel & support zone at 3340After breaking out of the falling channel, gold is currently retesting its upper boundary — now acting as support. The 3340 zone is particularly important as it aligns with the 0.618 Fibonacci level and high volume node on the visible range volume profile. The price action suggests a potential bullish rejection from this area. With both the 50 and 200 EMA below price on the 1H, the short-term trend remains bullish. The 4H trendline further supports this setup. RSI is cooling off near the neutral zone, leaving room for another leg higher toward the 3377 resistance zone. If 3340 fails, 3324 (0.786 Fibo) becomes the next line of defense. Until then, the structure remains bullish following the successful breakout and retest of the channel.
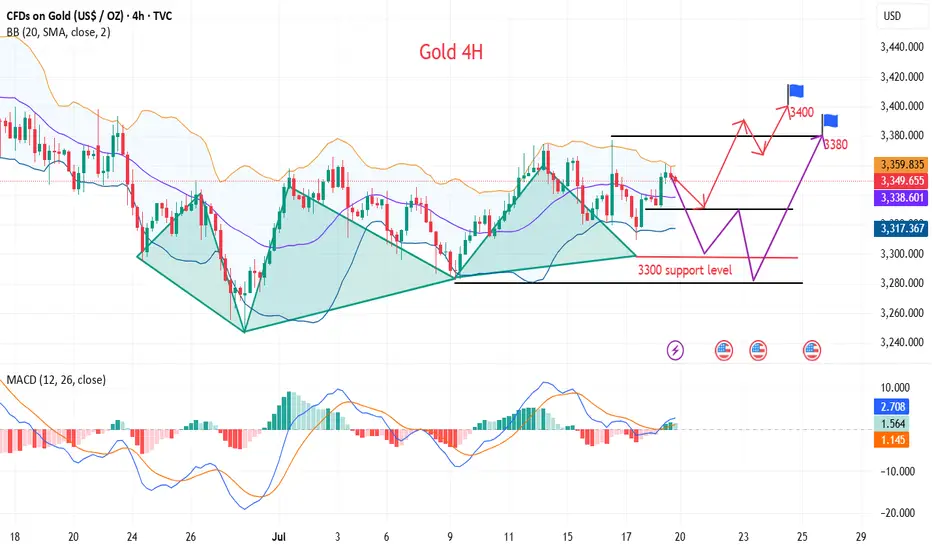
Gold momentum is about to explode, is 3400 still far away?
💡Message Strategy
Gold prices rose as expected on Friday as a weaker dollar and continued geopolitical and economic uncertainty boosted demand for safe-haven gold. Spot gold rose 0.4% to $3,353.25 an ounce, down 1.1% in the previous session. U.S. gold futures also rose 0.4% to $3,359.70. Gold prices remained largely stable around $3,350 an ounce this week.
The trend of gold prices is currently mainly affected by the following three factors:
1. US economic data supports the US dollar
The latest US real estate data is generally positive, and building permits and new housing starts data are both above expectations. The recovery of the real estate market has reduced market concerns about economic recession, which has provided some support to the US dollar, thereby constituting a certain suppression on gold.
2. Fed policy differences trigger market games
Fed officials have obvious differences in their statements on monetary policy. Christopher Waller, a Fed governor, prefers to directly cut interest rates by 25 basis points in July, worried about economic slowdown and weak job market. San Francisco Fed President Daly believes that two interest rate cuts in 2025 are "reasonable", but is wary of the impact of excessive tightening policies on the job market.
On the contrary, Fed Governor Kugler is more hawkish, believing that recent tariffs have been transmitted to consumer prices, and high interest rates should continue to be maintained, and it is not appropriate to cut interest rates for the time being. The existence of differences has caused market expectations to waver, and gold has fallen into consolidation.
3. Inflation expectations determine the medium-term direction of gold prices
The June CPI data from the United States showed signs of rising inflation, which may cause the Federal Reserve to postpone the pace of interest rate cuts.
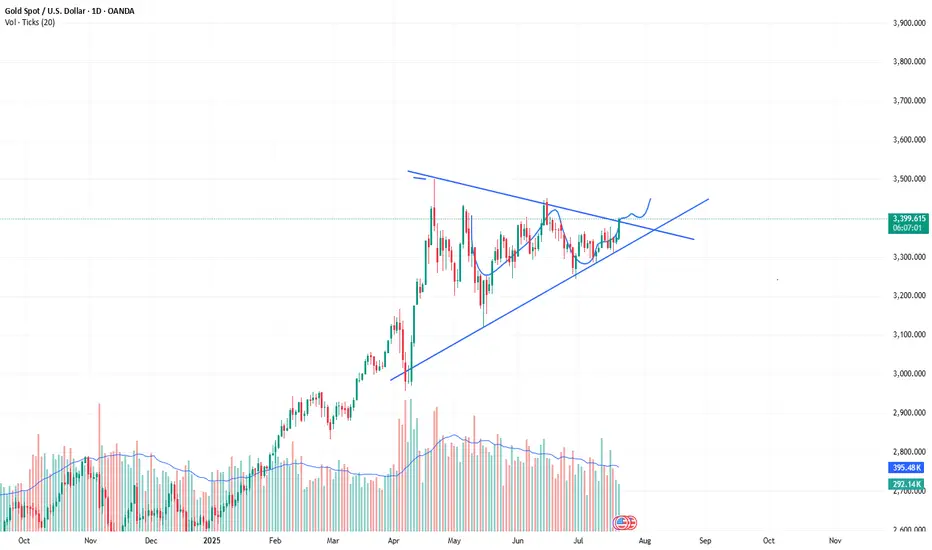
📊Technical aspects
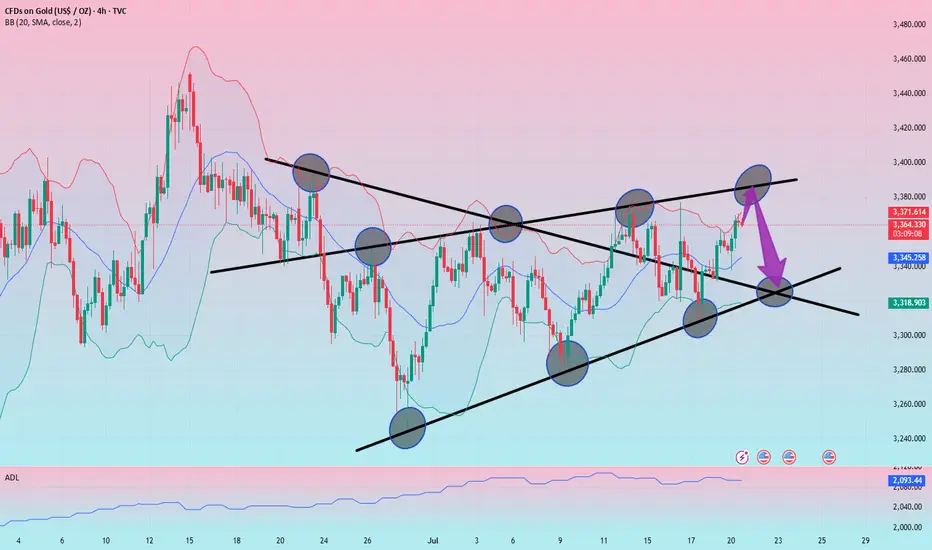
From the 4H chart, gold is currently oscillating in an obvious symmetrical triangle, forming a consolidation pattern in the short term.
Bollinger Band indicator: The middle track of the Bollinger Band is at $3345, the upper track is at $3405, and the lower track is at $3280. The current price is running near the middle track, indicating that volatility is converging and there is an expectation that a direction will be chosen soon.
Support and resistance: The current key support level is $3,280; short-term support is 3,300, and the upper resistance is $3,380. After breaking through, it is expected to test the previous highs of $3,451 and $3,499.
MACD indicator: The MACD histogram is gradually converging, and the DIFF line (3.19) and the DEA line (1.91) are in a sticky state, indicating that the momentum is exhausted and the probability of short-term shocks is high, but once the volume breaks through, the trend may form quickly.
RSI indicator: The RSI indicator is currently at 53.64, which is in the neutral area and has not entered the overbought or oversold area, indicating that the market is still waiting for new direction signals.
Overall, the analysis believes that gold is at the end of a symmetrical triangle, and the technical side shows that it is about to face a breakthrough. The direction choice may appear tonight or early next week, and the idea is still mainly low-level bulls.
💰Strategy Package
Long Position:3320-3330,SL:3300,Target: 3370-80,3400