Suppression remains unchanged, the latest layout of gold📰 Impact of news:
1. Powell's testimony
2. Geopolitical impact
📈 Market analysis:
The short-term rebound of gold is the release of energy for the accumulated bulls. From the current market trend, 3340 above is the key point of the short-term watershed between bulls and bears. The short-term resistance above is around 3342-3348, and the short-term support below is around 33220-3315. If it falls below this, it will continue to look towards yesterday's low of 3290-3280. The daily level is under pressure and continues to see a decline and adjustment. If it touches 3340-3350 above, you can try to short. After it retreats to 3320-3315 and obtains effective support, you can consider going long.
🏅 Trading strategies:
SELL 3340-3350
TP 3330-3320-3315
BUY 3320-3315
TP 3330-3340-3350
If you agree with this view, or have a better idea, please leave a message in the comment area. I look forward to hearing different voices.
OANDA:XAUUSD FX:XAUUSD FOREXCOM:XAUUSD FXOPEN:XAUUSD TVC:GOLD
Trend Lines

New buying opportunity may emerge for BTCBTC tends to fluctuate in the short term, but as BTC builds a double bottom structure to support the rebound pattern, it is currently inclined to fluctuate upward. Although the upward momentum has weakened after reaching around 106,000, as long as it stays above the 105,300-104,800 area, BTC is still expected to continue to rise and may challenge the 108,000-109,000 area again.
And with the collapse of the gold and oil markets, funds in the two markets may flow into BTC, which is more attractive and the mainstream market of cryptocurrencies. So as BTC retreats in the short term, BTC may have new short-term buying opportunities. Then if BTC retreats to the 105,500-104,500 area and does not fall below this area, we can consider going long on BTC at the right time.

Bulls have made profits, gold layout in the evening📰 Impact of news:
1. Powell's testimony
2. Geopolitical impact
📈 Market analysis:
I have completed the long trade according to the previous trading strategy, and the long order has generated profit. In the short term, the overall trend of gold is still bearish. Only if it breaks through and stabilizes above 3350 can the bulls continue. If it rebounds to the 3330-3335 line and encounters resistance under pressure, you can consider shorting. If it rebounds to 3340-3350 but fails to stabilize, you can increase your short position. Pay attention to the support of 3320-3300 below. If it falls below 3300, it is expected to reach 3280
🏅 Trading strategies:
SELL 3330-3335-3340-3350
TP 3320-3310-3300-3280
If you agree with this view, or have a better idea, please leave a message in the comment area. I look forward to hearing different voices.
OANDA:XAUUSD FX:XAUUSD FOREXCOM:XAUUSD FXOPEN:XAUUSD TVC:GOLD

Gold fluctuates sharply, both bulls and bears have opportunities
💡Message Strategy
1. The decline in gold prices is directly due to the cooling of market risk aversion caused by the ceasefire agreement between Israel and Iran. The attractiveness of gold as a safe-haven asset has weakened. The ceasefire agreement is fragile. Israel and Iran have accused each other of default. Trump criticized both sides. Its sustainability is questionable, adding uncertainty to the gold market.
2. Federal Reserve Chairman Powell testified at a congressional hearing on June 24 that it is necessary to observe the impact of tariffs on inflation before cutting interest rates. He is not in a hurry to cut interest rates, which has cooled expectations for a rate cut in July. Gold, as a non-interest-bearing asset, is under pressure under high interest rate expectations. The uncertainty of inflation caused by tariffs also limits the attractiveness of gold as an inflation hedging tool.
3. The U.S. Consumer Confidence Index fell to 93.0 in June. Consumers are worried about employment and economic prospects. Although the one-year inflation expectations have fallen, the expectations for rising interest rates have risen, which has weakened the safe-haven demand for gold. In the long run, gold's anti-inflation and safe-haven properties are still there. Global economic uncertainty and a weaker dollar may rekindle demand for gold. Investors need to pay attention to the Fed's policies and the situation in the Middle East and seize the opportunity to allocate.
📊Technical aspects
1. The weekly level switches space around the 10-day moving average. This week has not yet closed, so there is no final conclusion. You can keep it in mind first.
2. The daily line lost the lifeline support area that has been held for a month. The top and bottom are converted to each other. The lifeline position 3355 becomes the resistance range. However, please note that the pattern is closing, which means that the switching space is not the direction. The opening and volume must be opened to guide the direction.
Note that two points are also contradictory points. One is the lifeline 3355 switching space, and the other is that the pattern further closes and accumulates momentum, waiting for the opening to guide the real direction.
3. Five consecutive negatives in four hours, a drop of more than 100 US dollars from 3396 to 3295, and then began to rebound from a low position. This is very embarrassing. If it is a trend, there will be no consecutive positives. action, and will not linger for so long
Then there is only one explanation left, or sweep, pay attention to the lifeline position 3350, the double-line upper rail position 3364, together become the pressure line position of the partial sweep method
There can be a rise in leverage, but it cannot be a breakthrough of continuous rise or steady rise, otherwise the nature will change again
4. The double lines of the hourly chart are close and superimposed in the 3350-3355 area, which coincides with the four-hour lifeline. At the same time, this is also the last rebound to determine the resistance area yesterday afternoon, so as to change the nature
5. The large channel cooperates with the small channel interval. After breaking through yesterday, it further fell in volume. Now the position along the large channel is in the 3340 area. This will be the acceleration point today. Breaking through accelerates the rise, and breaking through accelerates the fall
💰Strategy Package
Short Position:3345-3355,SL:3365,Target: 3300-3290
Long Position:3280-3290,SL:3265,Target: 3340

Bearish direction remains unchanged, wait patiently
Since the sharp drop in gold last Monday (June 16), except for the correction of closing the cross positive line last Tuesday, the daily level has closed five consecutive negative lines since last Wednesday until now, fully demonstrating the weak characteristics of gold prices in recent trading.
From the technical indicators, the 5-day moving average and the 10-day moving average have formed a dead cross, which is an important signal of the weakening of the short-term market trend. The current gold price continues to run below these two moving averages, further verifying the current market situation where the shorts dominate. There is still no big fluctuation in the intraday, short positions are patiently waiting, and the operation still maintains our target of 3310-3305 unchanged.

GBPAUD → Countertrend liquidity captureFX:GBPAUD is forming a countertrend correction within a global uptrend and testing the support level with W1-D1, forming a false breakdown...
Against the backdrop of the dollar's correction, GBP/XXX pairs are strengthening. On the weekly timeframe, GBPAUD is forming a retest of support at 1.067 (false breakdown) within an upward bullish trend.
Unable to continue falling, the price returns above 1.0673 and consolidates in the buying zone. A breakdown of the structure will confirm the bullish sentiment.
Support levels: 2.0673
Resistance levels: 2.0785, 2.0852
If the bulls manage to hold their ground above the 2.067 support level within the current structure, the currency pair will have a good chance of returning to the bullish trend.
Best regards, R. Linda!

Mr. Rusell (Small Cap index) & Altseason go hand in hand. That's right it does.
Why?
Because small businesses employ nearly half of the workforce of the United States.
So when financial conditions exist for confidence to grow at this level of the economy expressed via hiring and expansion of said businesses the ripple effects are huge.
Which can be seen during Altcoin boom's (banana zones)
This cycle especially as one whole Bitcoin is out of reach for the common man. When Retail hot money does return to crypto expect small cap low numerical valued coins to really start outperforming BTC

BTC Consolidates Above Pivot – Bullish Momentum Toward 113,770?BITCOIN OVERVIEW
Crypto Breakout or Crash? Powell's July Message Becomes the Deciding Factor
Federal Reserve Chair Jerome Powell’s testimony on Capitol Hill has intensified the uncertainty surrounding risk assets.
He emphasized that while inflation has eased significantly since mid-2022, it remains “somewhat elevated”, and the Fed is in no rush to shift its policy stance.
This leaves markets with a binary outcome: crypto breakout or macro-driven pullback—and July may be the turning point.
TECHNICAL OUTLOOK – BTC/USD
Bitcoin remains in bullish momentum, having stabilized above the pivot level at 107,750.
The price is currently pushing toward the key resistance zone between 108,950 and 110,360.
A breakout above this zone would likely lead to continuation toward the next ATH target at 113,770.
However, consolidation is expected between 108,950 and 106,320 until a breakout occurs.
Key Levels
Pivot Line: 107,750
Resistance: 108,950 → 110,360 → 113,770
Support: 106,320 → 104,150

USoilLatest news. If the Strait of Hormuz is closed, the restrictions on the import and export of oil and natural gas will increase greatly. Because 20% of the world's oil and natural gas exports come from the Strait of Hormuz. So the trend of geopolitics will affect the closing and opening of this important checkpoint. If the increase in geopolitics really reaches this point, the price of oil may rise to 90$-100$. This is an excellent trading opportunity for investors who like to trade oil. But at present, this is an option for Iran to negotiate. Rather than a real closure, after all, the incident has not developed to this situation. If you like to trade oil. You can also follow me. Get brand new trading opportunities and make profits. Do not trade independently to avoid losses.

GOLD/XAUUSD SellGold price is still bearish in the short term. The US dollar is currently being boosted. There are also geopolitical talks and indirect ceasefires. Therefore, the short-term risk aversion sentiment has declined. The gold price is now quoted at: 3323. We can focus on the lower target of 3300-3290.

Gold rebound is blocked, 3333 line is directly short
After the continuous rebound, the gold price also showed obvious stagflation near 3340. The intraday hourly line went out of a small double top, which can also be said to be a weak rebound. We also said at the opening that 3340 is a short-term key long-short conversion position. At present, the gold price is still under pressure below this, which means that the market is still short. Then the gold price began to fall. There is no problem with our thinking, and our internal strategy also started shorting directly at the 3333 line. The current position is making a profit.
The market is weak, there is no doubt about it. There are only two conditions that can change our thinking. One is that the gold price rises rapidly and sharply to stand at 3340, and the other is that the gold price bottoms out near 3300. However, before any of the conditions are met, the short position will continue.
Specific strategy
Gold 3333 short, stop loss 3343, target 3310

High-Reward GBPUSD Setup: Entry 1.3598, TP 1.3867, SL 1.3478The GBP/USD pair has recently shown a clean bullish breakout from a short-term consolidation zone. Price has decisively moved above the 1.3478–1.3480 support-turned-resistance level, which previously acted as a ceiling within a rising channel. This breakout is meaningful—it comes after a retracement toward the lower boundary of the ascending structure, suggesting that buyers are once again gaining control.
The recent bullish candle has closed strong and full-bodied, indicating momentum. Historically, as you mentioned, GBPUSD tends to follow through for a few sessions once a bullish breakout begins. This is visible in prior moves throughout March and April, where an initial spike was often followed by two or three additional bullish candles. That behavior adds confluence to this setup.
Moreover, there is a clear path for price to move toward the long-term resistance near 1.3867, which aligns well with prior supply zones and the upper boundary of historical price reactions.
📈 Trade Idea
• Entry: 1.3598 (current price after breakout confirmation)
• Stop Loss: 1.3478 (just below the support flip and last swing low)
• Take Profit: 1.3867 (next major resistance level)
• Risk–Reward Ratio: ~2.24:1
This setup offers a clean bullish continuation pattern with room to run. If the pair maintains its current momentum, reaching the target in the next few trading days is entirely plausible. Any daily close above 1.3600 with volume would further validate the trend.

Patanjali Foods: A Potential Reversal Brewing Near Demand Zone?The price has now retraced back into a key value zone between 1,610 - 1,635, which has previously acted as a strong base. This zone also coincides with high volume activity on the visible range volume profile - suggesting accumulation interest.
Technically, the stock is near the 0% Fibonacci extension with multiple confluences of past support and volume, forming a potential base.
If this holds, look for retracement targets:
• First bounce zone: ₹1,687 (50% Fib)
• Further recovery: ₹1,745–₹1,775 (Fib 61.8–78.6%)
Long-term: ₹1,861 (161.8% Fib extension), ₹2,016 (261.8%)
Fundamentals Snapshot:
• Market Cap: ~₹58,000 Cr
• P/E: ~34x | P/B: ~3.8x
• Promoter Holding: 80.82% (No pledging)
• Debt-to-Equity: ~0.25
• ROCE: ~13.2% | ROE: ~10.4%
• FII Holding: 3.6%, DII Holding: 6.3%
Patanjali’s brand strength in edible oils, packaged foods, and growing FMCG integration offers secular demand visibility. The recent correction seems sentiment-driven, not structural.
Keep in Focus:
A decisive close above 1,660 could indicate a short-term reversal.
This chart is for educational use only and not a buy/sell recommendation.

Bitcoin Roadmap: Key Levels to WatchBitcoin( BINANCE:BTCUSDT ) managed to pump as I expected yesterday , of course, the main catalyst could have been the ceasefire announcement between Iran and Israel , which had a major impact on high and medium risk assets in the financial markets .
Bitcoin is once again moving near the Heavy Resistance zone($110,720-$105,820) and the Resistance zone($107,520-$106,100) after breaking the Resistance lines .
In terms of Elliott Wave theory , it seems that given Bitcoin’s bullish momentum , Bitcoin has completed the main wave 3 and is currently completing the main wave 4 on the 1-hour time frame . The corrective wave structure of wave 4 could be a Double Three Correction(WXY) .
I expect Bitcoin to start rising again near the Support zone($104,380-$103,060) , 50_SMA(Daily) , Support lines , and Cumulative Long Liquidation Leverage($104,412-$103,812) to rise at least to the Potential Reversal Zone(PRZ) and Resistance lines .
Note: Stop Loss(SL)= $102,600 = We can expect more dumps.
Please respect each other's ideas and express them politely if you agree or disagree.
Bitcoin Analyze (BTCUSDT), 1-hour time frame.
Be sure to follow the updated ideas.
Do not forget to put a Stop loss for your positions (For every position you want to open).
Please follow your strategy and updates; this is just my Idea, and I will gladly see your ideas in this post.
Please do not forget the ✅' like '✅ button 🙏😊 & Share it with your friends; thanks, and Trade safe.

Gold Slips as Ceasefire Eases SafeHaven Demand Bearish Below3339Gold Drops on Israel-Iran Ceasefire
Gold prices declined as safe-haven demand eased following President Trump’s announcement of a ceasefire between Israel and Iran. Despite the pullback, gold remains up nearly 23% year-to-date, supported by ongoing geopolitical tensions, economic uncertainty driven by Trump’s tariffs, and robust central bank purchases.
Market Focus:
All eyes are now on U.S. Federal Reserve Chair Jerome Powell’s testimony, which may offer fresh insights into potential near-term interest rate cuts.
Technical Outlook:
Gold remains under bearish pressure as long as it trades below the 3329–3339 pivot zone.
A confirmed 4H candle close below 3329, or especially 3309, would further validate downside momentum toward the support range.
Support Levels: 3302, 3281, 3256
Resistance Levels: 3364, 3393
A clear break below 3302–3281 would open the path toward deeper bearish continuation.

SMCI: When a chart says it’s time to reconnect with the AI hypeOn the daily chart, Super Micro Computer Inc. (SMCI) is showing a clean bullish setup. Price broke out of a descending trendline (green dashed), confirmed it with a retest, and is now consolidating above the breakout zone. The golden cross — where the MA50 crossed above the MA200 — confirms a long-term trend reversal.
Volume profile indicates strong accumulation near $41–43. The 0.5 Fibonacci level at $41.84 acted as support. Above the current range, there’s low volume resistance up to $63.57 (0.786), followed by $66.44 and a final extension target at $79.82 (1.272).
Fundamentals: SMCI is a leading server hardware manufacturer. Demand for their systems has soared with the explosion of AI infrastructure. The company maintains solid financials, with rising quarterly revenue and growing presence in the cloud sector. Institutional investors have been actively increasing their positions since late 2023 — a sign of strong long-term conviction.
Tactical plan:
— Entry: market $42–43
— Target 1: $55.91
— Target 2: $63.57
When technicals scream textbook breakout and fundamentals bring AI momentum to the table — it might just be one of the best late entries in the AI wave this summer.

The current price of gold is 3330-3335, go short directly!Gold rebounded after hitting the bottom of 3295. At present, gold is just a rebound, not enough to reverse directly. Gold rebounds and continues to be short. After all, the daily line has fallen continuously, so the short momentum of gold is still there. In the short term, the rebound of gold is just a repair after oversold. Gold is currently priced at 3330-3335 and is directly short.
The 1-hour moving average of gold continues to be arranged in a short position downward. After gold fell below the previous low of 3340 yesterday, gold has not been able to rebound again. In the short term, 3340 has become the key to long and short positions. In the short term, gold rebounds below 3340 and continues to be shorted. If gold breaks through and stabilizes at 3340 again, then gold may start to fluctuate again. Before breaking through 3340, gold is still weak and continues to maintain a short trend.

EURCHF: Bearish Continuation After Breakout 🇪🇺🇨🇭
EURCHF violated a significant horizontal support.
Retesting that, a bearish flag pattern was formed.
Its support violation provides a strong intraday confirmation.
The pair may drop lower at least to 0.9328
❤️Please, support my work with like, thank you!❤️
I am part of Trade Nation's Influencer program and receive a monthly fee for using their TradingView charts in my analysis.

GOLD → Attempt to buy back the fall. Uncertainty factorFX:XAUUSD is falling within our expectations. After breaking through the trigger-level of 3340, the price fell to the liquidity zone of 3306. There is uncertainty in the market...
Gold is rising after a false break of support at 3300-3306, interrupting a three-day decline amid a weakening dollar and ongoing tensions in the Middle East. Investors are cautious due to the unstable truce between Iran and Israel, while the decline in USD/JPY after the Bank of Japan's statements and the rise in PPI in Japan are further supporting demand for gold. Powell's comments on the need for caution in monetary policy only temporarily strengthened the dollar. Now the market is focused on US housing data and the second day of Powell's speech
Technically, the price may consolidate at 3306-3347 for some time and only then show us (against the backdrop of the fundamental sentiment that has formed) which direction it will then take
Resistance levels: 3347, 3364, 3372
Support levels: 3319, 3307
The market is trying to buy back the decline. Tuesday's daily session closed with a long shadow, indicating interest in this price range. A pullback to 3320-3310 is possible before growth to 3340-3347.
Best regards, R. Linda!

XAUUSD 1H Analysis – Golden Point in SightPrice is currently making its way toward the Golden Point zone at 3365.120, aligning with the 0.786 Fibonacci retracement from the recent bearish leg. This area also coincides with a descending trendline, adding confluence for a potential reversal setup.
📍 Key Levels:
🔹 Resistance: 3365.120 (Golden Point / 0.786 Fib)
🔹 Support: 3302.571 (Target zone)
🔹 Swing High: 3393.776
🔹 Swing Low: 3295.200
🎯 Trade Idea:
Watching for a potential rejection from the 3365 zone to catch a short down to the 3302.571 area. Bearish confirmation required around the Golden Point before entry.
📌 This setup follows the HurricaneFx Signature Strategy.

BTCUSD : HUGE FALL AHEAD ? Sell at 106200 or below
Stoplos : 113000
Target : 100000, 90000
BTCUSD struggling hard to make new highs. Retest of 90k level expected.

OIL Bullish BiasCurrently sitting on my hands but closely watching oil, especially after Iran & Israel
Consolidation Protocol active. Need to see external range taken. I will not trade inside this range. Favoring longs.
Think accumulation, manipulation, distribution. Right now its in the accumulation phase. Manipulation phase is next. Preferably sweeping external low first then distribution higher to bsl.
Relative equal highs / LRLR at 114.29 first long term target.
Final target are the inefficiencies at 130 - 150.

Opportunities only come to those who ambush in advanceAfter Trump announced that Israel and Iran had reached a comprehensive ceasefire agreement, the market's risk aversion sentiment cooled significantly, and the price of gold once plummeted by more than $30. Although the stability of the ceasefire agreement is in doubt, the rebound in risk appetite dominates the market trend, with stock markets rebounding, oil prices falling, and demand for safe-haven assets falling. Powell will deliver a semi-annual monetary policy testimony, and the market is paying attention to his statement on the timing of the July rate cut. At present, the internal differences of the Federal Reserve on interest rate cuts have intensified. If Powell sends a signal that the number of interest rate cuts this year is limited, it may strengthen the rebound of the US dollar and suppress gold prices; on the contrary, if the stance is dovish, it may ease the downward pressure on gold prices. In the short term, the fading of geopolitical risks and the warming of risk appetite are the main reasons for the decline in gold prices, but the weakening of the US dollar and the potential dovish tendency of the Federal Reserve still provide support. In the medium and long term, global economic uncertainty, geopolitical risks and expectations of the Federal Reserve's loose policy still constitute structural support for gold.
From a technical perspective, the gold daily moving average system is in an intertwined state, and the forces of bulls and bears are relatively balanced. The current short-term resistance above is around 3320-3333, which is an important psychological level. If an effective breakthrough is achieved or the upside space is opened, the support below will focus on the 3285-3295 line, which is the lower edge of the May oscillation platform. If it falls below, the pressure of the correction may increase. The loss of the middle track in the 4-hour chart further confirms the short-term weak structure and provides technical support for the downward trend. It is recommended to go long on the pullback near 3285-3295. At present, gold continues to fall in line with the trend.

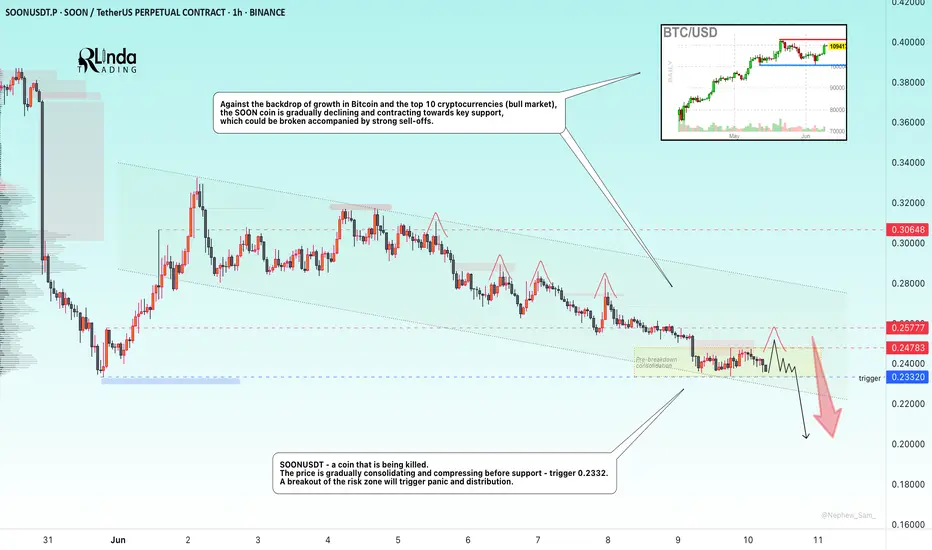
SOONUSDT → The coin that gets killed...BINANCE:SOONUSDT.P is under pressure. The coin looks extremely weak against the backdrop of a bullish market, with key support ahead, separating traders from the panic zone and a sharp decline
This coin is being killed. The price is gradually consolidating and compressing before support - the trigger is 0.2332. Against the backdrop of the overall decline that the market has experienced after a slight impulse from 0.2332, shocks are forming with the aim of capturing liquidity (red check marks). This generally indicates that large players are gathering a bearish position. A breakout of the risk zone will trigger panic and distribution.
Against the backdrop of growth in Bitcoin and the top 10 cryptocurrencies (bull market), the SOON coin is gradually declining and contracting towards key support, which could be broken accompanied by strong sell-offs.
Resistance levels: 0.2478, 0.25777
Support levels: 0.2332
If the coin continues to contract towards the 0.2332 support and form a pre-breakdown consolidation, there will be little chance of survival. In the short and medium term, I expect prices to fall.
Best regards, R. Linda!