Market Hunter’s AUDUSD Roadmap: Patiently Awaited Buy LevelsMy friends, greetings
I have prepared an AUDUSD analysis for you.📊
If AUDUSD falls to the 0.64528 – 0.64363 levels, I will open a BUY position there.
Once AUDUSD reaches my BUY entry point, I will share the targets with you here.⚡
You will be informed when I update this analysis.🔔
My friends, I share these analyses thanks to every single like I receive from you.
Your likes increase my motivation and make me want to support you in this way.🙏
I sincerely thank all my friends who support me with their likes.❤️
Trend Lines

GBPUSD: Bearish Drop to 1.307?FX:GBPUSD is eyeing a strong bearish continuation on the 1-hour chart , with price compressing tightly into a key resistance zone + downward trendline touch, forming a high-probability compression pattern that could trigger sharp selling pressure if sellers break the ongoing consolidation. Perfect short setup after the recent rally exhaustion, targeting lower support cluster with good risk-reward.
Entry between 1.3130–1.3140 for a short position (aggressive entry right here with proper risk management is recommended). Main target at 1.3070 . Set stop loss on any 4H candle close above 1.3160 , delivering a clean risk-reward ratio of ~1:2 (conservative) to 1:3+ (if partials used). Watch for bearish confirmation on lower timeframe break or strong red candle with volume spike.⚡
Fundamentally , pound is losing steam near multi-month highs as markets aggressively price in BoE rate cuts (potentially as soon as December) while the dollar regains strength on sticky US data and reduced Fed cut expectations . Upcoming UK CPI and US PMI this week can act as major catalysts for USD strength – classic risk-off setup for cable shorts.💡
📝 Trade Setup
🎯 Entry (Short):
1.3130 – 1.3140
(Aggressive entry from current levels is possible with strict risk management.)
🎯 Target:
• TP: 1.3070
❌ Stop Loss:
• Any 4H close above 1.3160
⚖️ Risk-to-Reward:
• ~1:2
👇 Share your thoughts below! 👇


NZDCAD NZDCAD going short with 1:2 RR as overall it is in a downtrend with a strong pullback and confirmation to go short.

Bitcoin – Approaching Key Resistance at 90,000Since the recent drop, Bitcoin has been forming higher highs (HH) and higher lows (HL), showing a solid 8–10% recovery. This structure suggests buyers are regaining control, but now price is approaching a major test.
The next key level is the 90,000 resistance zone:
Bullish Scenario:
If BTC breaks above 90,000, momentum could accelerate as more traders add longs. This would open the door for a clean move back toward the 95,000 level.
Bearish Scenario:
If price fails to break 90,000, a rejection would likely send BTC back to the 85,000 support zone.
If 85,000 does not hold, the next liquidity levels lie at 83,000–81,000.
Overall, Bitcoin is recovering well, but the 90,000 level will determine whether the rally continues or a deeper correction begins.
BINANCE:BTCUSDT

XAUUSD – H4 Trend Structure Awaiting BreakoutXAUUSD – H4 Trend Structure Awaiting Breakout
Brian – Strategy to Buy on Pullback in Uptrend Channel
I. Strategy Summary
Gold continues its uptrend on H4, supported by the upward trendline from the 3,880–3,900 region.
The price is testing the resistance zone of 4,133–4,150, coinciding with the H4 supply and descending trendline, making short-term corrections likely.
Main strategy: wait for a pullback to support/FVG to buy with the trend, avoid FOMO buying at resistance.
Key levels to note: closing below 4,000 weakens the uptrend structure; below 3,884 risks shifting to a medium-term downtrend.
II. Macro Context
Unemployment Claims (weekly unemployment benefits):
Forecast: 226K
Previous: 220K
Higher-than-expected figures → indicate a weakening labor market, cooling economy, increasing the likelihood of the Fed easing sooner → real yields decrease, supporting gold.
Better-than-expected figures (lower than forecast) → support USD and bond yields, potentially causing short-term pressure on gold.
Geopolitical:
Trump's statement on easing "deadline" pressure for Russia–Ukraine negotiations ("the deadline will be when the issue is resolved") helps the market worry less about a hard deadline, but conflict risks remain. The demand for gold as a safe haven remains stable, not overly inflated but also unlikely to disappear entirely.
III. Fundamental Picture
Expectations for a rate cut cycle in 2025 continue to support gold as the market gradually prices in lower real interest rates in the medium to long term.
The demand for holding defensive assets persists amid slowing global growth and unresolved geopolitical hotspots.
In the short term, USD and US bond yields remain the two leading variables; any USD recovery can pull gold back to technical support areas, creating opportunities for buy-on-dip strategies.
IV. Technical Structure – H4 Trend Channel & FVG Zone
On H4, the price is moving within an uptrend channel, with the support trendline respected multiple times since the end of last month.
Above is the descending trendline connecting the nearest peaks, creating a price compression zone as the market approaches the 4,133–4,150 area. This is a confluence resistance zone:
The nearest swing high.
H4 supply zone.
Intersection with the descending trendline.
Notable price zones:
Resistance: 4,133–4,150 – a zone that may trigger short-term profit-taking and create a correction.
Near support/FVG: 4,078–4,080 – FVG zone combined with support after the previous breakout.
Psychological support: 4,000 – if H4 closes below this area, the uptrend structure weakens.
Medium-term reversal level: 3,884 – closing below here opens the risk of shifting entirely to a medium-term downtrend.
V. Trading Plan
Scenario 1 – Buy with the Trend (Priority)
Idea: wait for a shallow pullback to near support in the H4 uptrend channel and then buy.
Entry: 4,111–4,114
SL: 4,005
TP: 4,133 – 4,150 – 4,172 – 4,190
Scenario 2 – Buy Deep at FVG Zone
Idea: if a stronger pullback to FVG 4,078–4,080 occurs, take advantage of the good price zone to buy.
Entry: 4,078–4,080
SL: 4,073
TP: 4,100 – 4,115 – 4,142
VI. Risk Management & Notes
Limit opening new orders at the time of Unemployment Claims announcement due to potential volatility and spread widening.
If H4 closes below 4,000, reassess all current buy positions.
If H4/Daily closes below 3,884, consider the medium-term uptrend structure broken; prioritize staying out to observe or wait for a new downtrend scenario instead of continuing to look for buying points.

BITCOIN bounceBitcoin broke down from the long-term rising wedge and now could bounce to around 110k before deciding whether to go higher or enter a new bear market.

Seeking high-probability trading opportunities in gold.Gold Price Trend Analysis: Looking at the 4-hour chart, gold is currently showing a trend of both higher highs and higher lows. However, using a Fibonacci retracement level, gold is facing resistance at the 0.618 Fibonacci retracement level, specifically around 4155, which triggered a decline. However, it found support at the 4110-4100 area, a previous support level, ultimately closing above 4110. Therefore, today we need to pay attention to the support levels at 4110 and the psychological level of 4100. Long positions can be considered. Looking at the MACD indicator, the fast and slow lines were previously converging, but diverged yesterday as expectations of a Fed rate cut increased. This divergence may continue during the US session today. We need to watch for a break above 4155; if it breaks, a move towards 4180-4200 is expected.
The 1-hour moving averages continue to trend upwards, maintaining a bullish alignment. Reviewing the day's gold price movement, the overall trend remains upward, with a short-term pullback from the 4150-4160 area. It's important to note that gold has seen minimal pullbacks throughout its upward breakout. Even the pullback in the European session only tested the 4110 level before resuming its upward climb. The short-term upward trend remains intact. In the US session, consider buying on dips above 4100. The key resistance level is the same as on the 4-hour chart, at 4155. However, today's price action didn't see a pullback to 4100; instead, it fell to 4110 before rebounding. Therefore, it's highly likely that gold will surge upwards in the evening, breaking through 4155. The key level to watch then becomes 4180, which is the resistance of the previous trendline on the daily chart. In summary, today's gold trading strategy is to primarily buy on dips and secondarily sell on rallies. The key resistance level to watch in the short term is 4160-4180, while the key support level is 4110-4100. Please follow the recommendations carefully.

IREN charges up after the pullbackThe price of IREN pulled back to the lower boundary of the expanding channel and touched the 100 period moving average on the 8 hour chart. The 48 zone acted as support earlier and buyers are showing interest there again. A base is forming. A breakout above 62 can activate movement toward 76 and later 100 where the next expansion target sits.
IREN operates large scale data centers and high performance computing infrastructure including bitcoin mining and enterprise hosting. The key advantage of the company is access to low cost renewable energy which keeps hash rate costs low and allows stable scaling.
The fundamental picture on November 26 remains stable. The company continues to expand its data center capacity. Leverage stays low. The bitcoin network maintains strong activity which supports revenue. Hash rate competition increases but operators with cheap energy access like IREN gradually strengthen their market position.
As long as the price stays above the 48 zone and above the 100 period moving average the recovery structure remains valid. A confirmed move above 62 opens the path to 76 and then 100 . A move below 48 will return price to deeper consolidation.
Even miners need a pause to recharge but after such pullbacks energy normally returns very quickly.

How did gold perform after the PPI news?🧭 1. Trendline
Descending trendline (red – dynamic resistance)
Price has clearly broken out above the descending trendline.
Price is currently in a slight retest of this trendline → if it holds above 4,150–4,160, a short-term uptrend is confirmed.
Ascending trendline (hidden in the underlying structure)
Confluence support zone is around 4,107–4,110
→ This is a very strong area for a pullback if it occurs.
🧱 2. Support – Resistance
Key Resistance
4,209–4,212: Strong supply zone, also a confluence with the previous peak area.
4,240–4,242: 1.618 Fibonacci extension + peak in the major supply zone → important target.
Support
4.107 – 4.110: Confluence of:
Fibonacci 0.5 – 0.618
EMA as support
Retest zone breakout
→ This is a priority buy area if the price pulls back.
📐 3. Fibonacci
The 0.5 – 0.618 Fibonacci of the rising wave is right in the green support zone → confirming strong demand.
The 1.618 Fibonacci extension points to 4.240 – 4.245 → most likely the final target of this rising wave.
BUY GOLD: 4107 - 4110
Stop Loss: 4097
Take Profit: 100-300-500 pips
SELL GOLD: 4209 - 4212
Stop Loss: 4222
Take Profit: 100-300-500 pips

NQ on Major Support Target 36,490Nasdaq 100 index is on major support since September. This is the area you want to buy and as it goes up take some profits if you want for a potential check back into support around early 2027 (green path).
There's the alternative scenario (orange path) that we just trend right up to 36,490 resistance and then have a major pullback to the long term trend. This one is less likely, but possible.
Either way if you sell some of your position (like shorter term options) in the middle of the range you're likely to be in a better position than holding the entire time as eventually that lower trend should get hit and that's a lot of time decay to ruin your positions.
Good luck!

Novo bottom is in novo has had a 200% gain without any major correction. we have a 60% retracement that is sitting on a confluence of support.we have bottomed on the macd 15 day and have a positive reversal forming on the smaller time . i feel we have bottomed out and am taking a position accordingly. we also are seeing huge volume and testing support to make a floor and reversal. i am personally backing up the dump truck on this one. as we also see in the news a lot of bullish talk about the medical industry even thou i dont trade on news sociological target 100. and top of channel with a potential 100x gains

GBPUSD SHORTGot this one late "technically" but thank god for that massive wick to touch my buy limit and put me in. Market showed a fake up trend with the BOS up and through but the broke back down and through to make a CHoCH the showing me a clear entry.

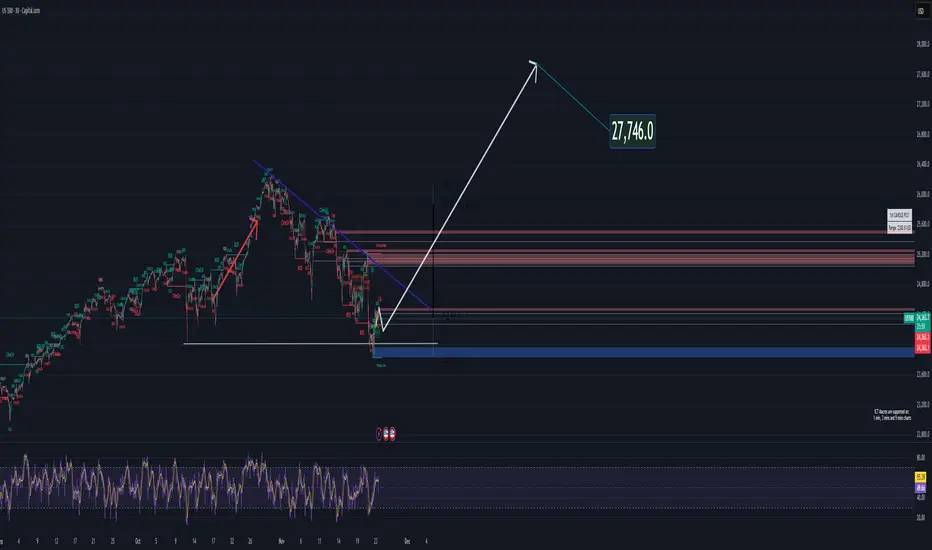
NASDAQ – Bullish Triangle Breakout LoadingI’m currently seeing a bullish ascending triangle forming on the Nasdaq indicating a strong accumulation phase before a potential breakout to the upside price has already started to bounce upward from this compression zone suggesting that buyers are taking control and preparing for a clean bullish continuation
If the breakout confirms, my target is around 27750$ aligns with
The projected target of the ascending triangle
A strong technical resistance zone
A logical extension given the current bullish structure
As long as price stays above the triangle support the bullish scenario remains the primary expectation

Ethereum — Swing Low Locked In - 60% ahead!
ETH has established its swing low, and now it’s all about watching for the next impulse.
Against BTC, the chart is clean. ETH is actively reclaiming the pivotal zone, and as long as it holds above 0.03, this setup screams continuation.
Nothing overly complex here — structure is intact, momentum is stabilizing, and the path of least resistance is up.

Long btcAfter recording a new low, Bitcoin can now follow wave B after making its corrective wave C to the specified Fibo ranges.

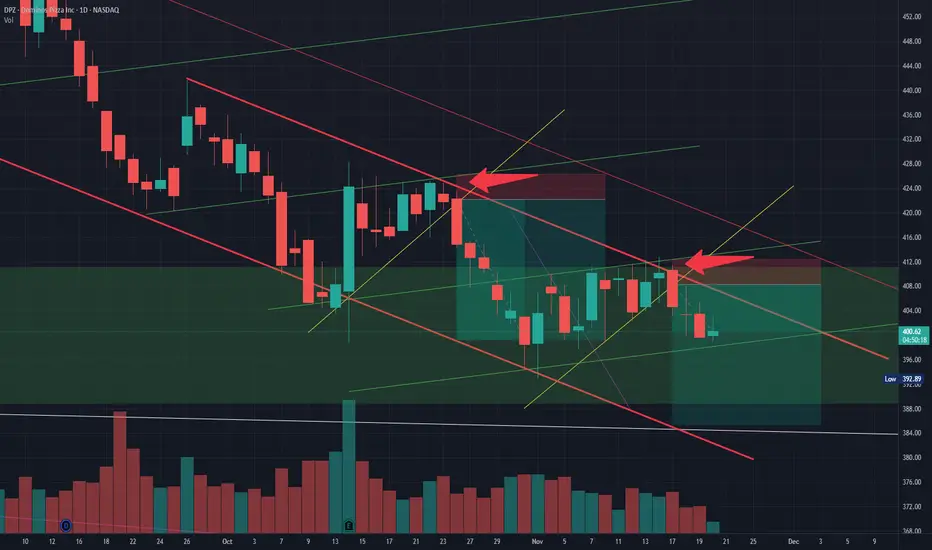
DPZ - Same pattern repeating perfectlyIt's incredible how much information and confirmation we can get from the algorithms. My last DPZ video goes into the HTF chart and the incoming bullish picture.
But in this video, as I did in the last, I am showing you why we're heading lower for the time being and how we're setting up perfectly for continuation.
Where you see two arrows, you see price respecting a green tapered buying (which is a bearish liquidity builder). In addition, we are at the top of our red strong selling channel (which is selling continuation). Since green is there in order to help us continue lower and red is there to do just that, it proves itself over yellow (you see the dump that happens once we fall out of yellow - that's because green proved itself and we're heading down to and bellow green).
We see that exact thing happening again now. The second arrow is where I made the last video discussing the short opportunity down to the $480 level. We have since dropped out of strong yellow and are now proving green. What does that mean? DUMP!
So with the alignment of all these algorithms and most importantly a HTF intentional area below (massive liquidity sitting at $393), we have every reason to want to come down a bit before a larger move upward. And the algorithms are agreeing.
Happy Trading :)
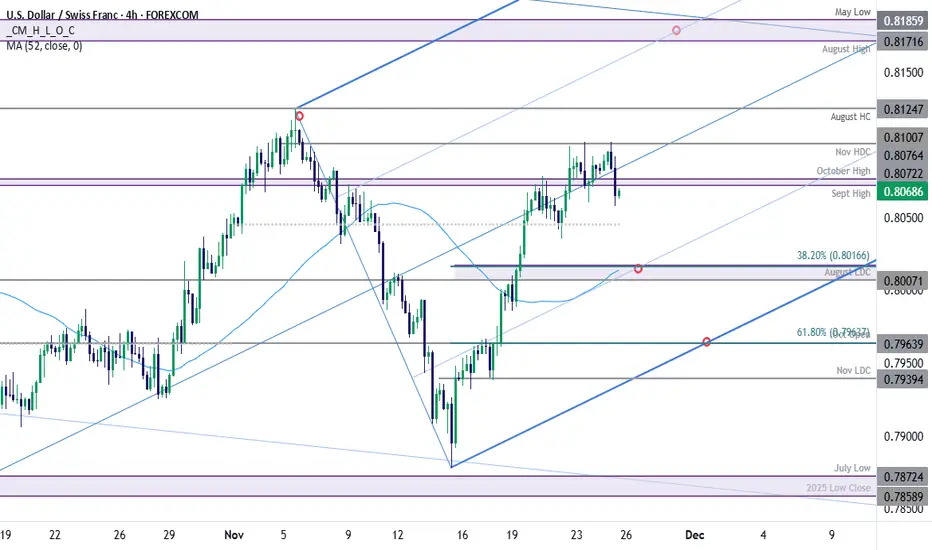
USD/CHF 7-Day Rally Fuels V-shaped Recovery into ResistanceA V-shaped rally has extended more than 2.8% off the monthly lows with price testing resistance at the November high-day close for a third consecutive session. The focus is on this key level in the days ahead with a breach / close above needed to fuel the next leg of the advance.
USD/CHF is trading within the confines of a proposed ascending pitchfork extending off the October / November lows. The weekly opening-range is taking shape and we are looking for a breakout to offer guidance here over the next few days.
Initial support rests with the September and October swing highs at 8072/76 and is backed by 8007/17- a region defined by the August low-day close (LDC) and the 38.2% retracement of the recent advance off the lows. Broader bullish invalidation rests with the lower parallel which converges on the 61.8% retracement at 7964. Ultimately, a close below the November LDC at 7939 would be needed to put the bears in control here.
Initial resistance is eyed at the monthly high-day close (HDC) at 8101 and is backed by the August high-close (HC) at 8125. Strength beyond this pivot zone would be needed to mark resumption of the broader September uptrend with subsequent resistance objectives eyed at the August high and May low at 8172/86- look for a larger reaction there IF reached.
Bottom line: USD/CHF is testing resistance for a third consecutive day with the weekly opening-range taking shape just below- look for the breakout in the days ahead. From a trading standpoint, losses should be limited to 8001 IF price is heading higher on this stretch with a close above 8125 ultimately needed to fuel the next major leg of this advance.
-MB
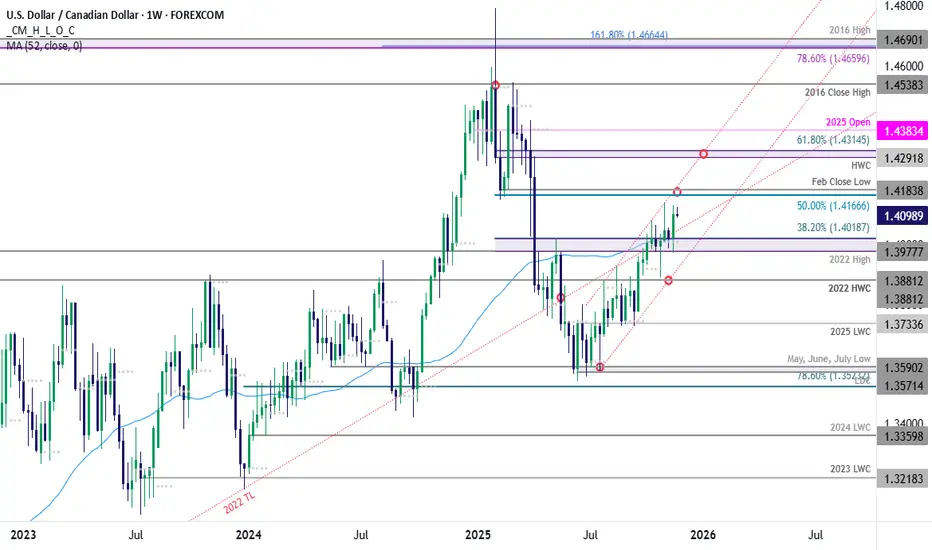
USD/CAD Rally Stalls in November Range as Breakout Risk BuildsA sharp rebound off support triggered an outside-weekly reversal from the monthly low, and focus now shifts to a breakout of last-week’s range for guidance on the next directional move.
Support remains unchanged at 1.3978-1.4019- a region defined by the 2022 swing high, the November open, The May high, the 52-week moving average and the 38.2% retracement of the yearly range. Note that the July channel line converges on this threshold next month and a break / close below would be needed to suggest a more significant high is in place and that a larger trend reversal is underway. Subsequent support seen at the 2022 high-week close (HWC) at 1.3881 and is backed by the 2025 low-week closed (LWC) at 1.3734.
A break above last week’s range exposes the next key technical hurdle at the 50% retracement of the yearly range and the February LWC at 1.4167/84. Note that the channel resistance converges on this zone into the monthly cross and a breach / close above is needed to fuel the next major of the advance. Subsequent resistance is eyed at the 2025 HWC and the 61.8% retracement at 1.4292-1.4315 and the objective yearly open at 1.4383.
Bottom line: USD/CAD has been bound within the November range, just above support. Look for a breakout of last week’s range in the days ahead for guidance. From a trading standpoint, a good zone to reduce portions of long-exposure / raise protective stops – losses should be limited to 1.3978 IF price is heading higher on this stretch with a close above 1.4183 ultimately needed to fuel the next major leg of this advance.
-MB
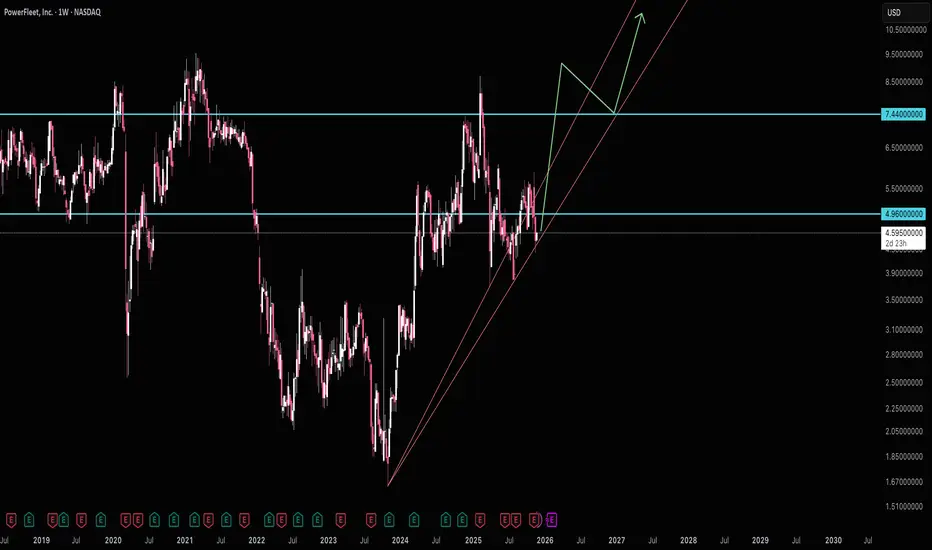
PowerFleet to $7.44Amazing growth with this one that's been a long time coming. Target $7.44, but after holding support there expect it to keep trending higher.
Good luck!
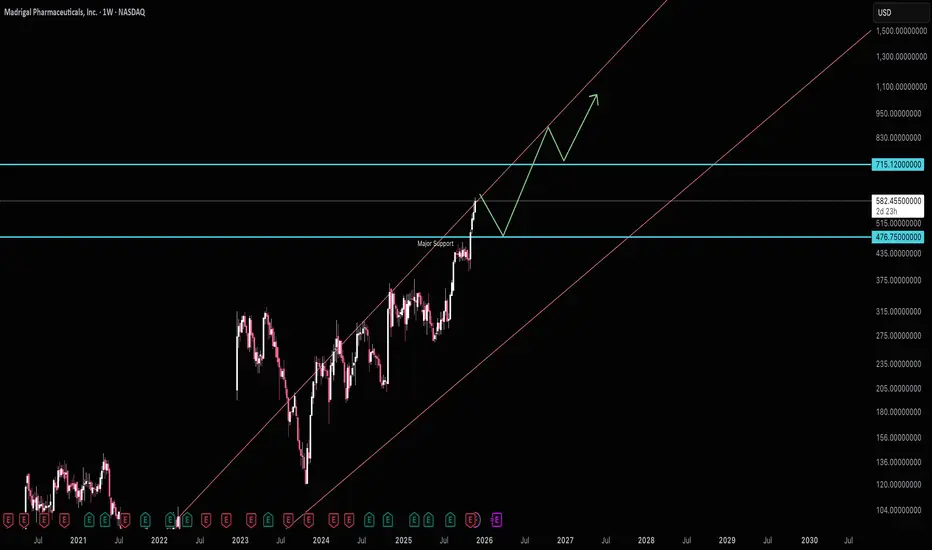
Looking to pickup at $476$476 is the buy area target $715. It's best to wait for support to hit before jumping into this one.
Good luck!