AMGN: the medicine cabinet for your portfolioOn the weekly chart, Amgen (AMGN) trades at $289.56, holding above the key $272–280 support zone, aligned with the 0.705–0.79 Fibo levels. This area forms a clear buy zone, where buyers are likely to step in. The technical structure remains bullish: the uptrend is intact, with targets at $346.85, matching historical highs and the upper boundary of the formation. Price currently sits near the lower part of the range, where volume accumulation could fuel the next upward move.
Fundamentally , Amgen stands as a biotech heavyweight: its drug portfolio remains strong, late-stage pipeline candidates progress steadily, and recent earnings showed stable revenue and profit growth. Investors treat the stock as a defensive asset amid market volatility, with biotechnology demand remaining largely cycle-independent. Additionally, institutional funds have been accumulating positions, providing further support.
Tactically , the $272–280 zone is critical: holding it preserves the bullish scenario. Should the bounce continue, the targets shift to $300 and $346.85. While a retest of support is possible, the broader structure remains upward.
Amgen stays true to its name - when the market is sick, this stock has the cure.
Trend Lines

GOLD – Key Levels Ahead of Jobs Data | Bearish Below 4083GOLD | OVERVIEW
Gold fell more than 1% as a stronger U.S. dollar and reduced expectations for a December Fed rate cut pressured prices.
Traders are now awaiting the delayed U.S. jobs report, which is expected to increase volatility.
Market movement remains choppy, which is typical for this time of year as profit-taking and book-squaring overlap with early positioning ahead of the new year.
Markets now await the delayed U.S. jobs report, which may bring sharp price swings.
🔽 Below 4083: Bearish continuation toward 4054 → 4038 → 4008 → 3982
🔼 Above 4083: Bullish move toward 4104 → 4133 → 4147
Pivot: 4076–4083
Support: 4054 · 4038 · 4008 · 3982
Resistance: 4104 · 4133 · 4147
Gold stays bearish under 4083, but a confirmed 1H close above this level will activate the bullish scenario

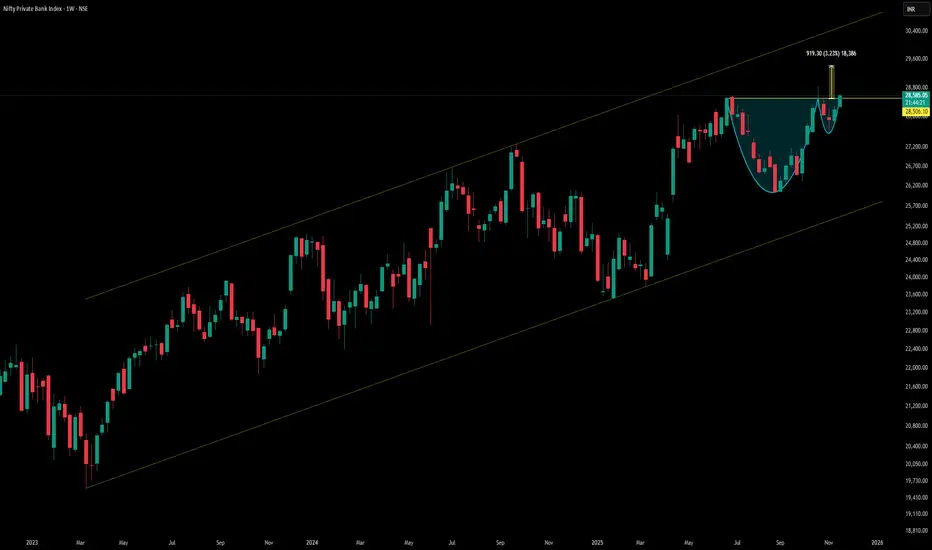
Nifty Private Bank confirms a classic Cup and Handle patternThe Nifty Private Bank chart shows a bullish Cup and Handle breakout — signaling upside in top private banks like HDFC Bank, ICICI Bank, Axis Bank, Kotak Mahindra Bank, and IndusInd Bank. These stocks are likely to lead the rally.
Cup: Rounded bottom formed over weeks/months, showing accumulation.
Handle: Shallow pullback or sideways drift, indicating consolidation before breakout.
Breakout: Above resistance with volume, projecting a 10.31% upside from the breakout level.
This setup is a strong bullish continuation signal, especially when backed by sector-wide momentum.
Top Nifty Private Bank Stocks to Watch
These are the official constituents of the Nifty
HDFC Bank & ICICI Bank: Largecap leaders with strong Q2 earnings and institutional flows.
Axis Bank & Kotak Bank: Showing breakout setups and improving loan growth.
IndusInd & IDFC First: Mid-tier banks with rising ROE and margin expansion.
⚠️ Disclaimer
This analysis is for educational purposes only and does not constitute investment advice. Market conditions can change rapidly, and chart patterns do not guarantee future performance. Please consult your financial advisor before making any investment decisions.
USDCAD rise/fall?USDCAD at a key zone and showing signs of weakness. Some major news coming in less than 2 hours, waiting for liquidations and reactions to jump in on sniper entries.

US30 – Key Levels Ahead of NFP | Bearish Below 46420–46600US30 – Market Outlook | Bearish Below 46420, Bullish Above 46600
US30 is set for high volatility today as traders react to the NFP report.
Below 46420 / 46600: Bearish continuation toward 46250 → 46000 → 45680
Above 46600: Bullish breakout toward 46920 → 47080
Pivot: 46420
Support: 46250 · 46000 · 45680
Resistance: 46600 · 46910 · 47080
US30 stays bearish while below 46420–46600; only a confirmed close above 46600 will shift momentum to the upside.

The timing for bullish entry has been precisely identified!Yesterday, the market experienced significant volatility, with gold prices surging to around 4132, a gain of 1.6%. However, as the US dollar index continued its upward trend and reached a near two-week high, coupled with hawkish signals from the latest Federal Reserve meeting minutes, market sentiment was severely dampened. Gold prices gave back all of the day's gains, ultimately closing only slightly higher at around 4077. Currently, investors' focus has completely shifted to the upcoming US September non-farm payroll report, hoping to find clear clues about future monetary policy and a new direction for gold.
From a technical perspective, on the daily chart, Friday's large bearish candlestick broke through key moving averages, setting the tone for a volatile week. Currently, the 5-day moving average area of $4120-$4130 has become a strong resistance level. If gold prices continue to be constrained by this level, the downside risk will significantly increase. The key support level is around $4050-$4030. If this level is effectively broken, it will confirm the continuation of the short-term correction trend, and gold prices may further test the important psychological level of $4000. However, the current price is still stable above the Bollinger Band's middle line, and the daily chart shows consecutive positive days, indicating that there is still some resilience in the market, and the bulls have not completely given up. Before the release of the key US non-farm payroll data, gold prices are expected to be trapped in a range-bound trading pattern. The subsequent upside potential depends on whether it can successfully break through the $4200 resistance level, while a deeper decline would require new negative fundamental factors to drive it.

NZDUSD: Bearish Trend Continues 🇳🇿🇺🇸
NZDUSD is trading in a bearish trend on a daily.
The market finally completed a correctional movement yesterday,
forming a bearish imbalance candle and setting a new lower low
lower close with a confirmed BoS.
We can expect another wave lower.
Next support will be 0.56.
Look for selling after a completion of a pullback.
❤️Please, support my work with like, thank you!❤️
I am part of Trade Nation's Influencer program and receive a monthly fee for using their TradingView charts in my analysis.

SPX500 – Key Breakout Levels Ahead of NFP | Bearish Below 6734SPX500 | OVERVIEW
Stocks soar on Nvidia earnings relief as the company delivered forecasted quarterly revenue well above Wall Street expectations, easing recent concerns over AI-sector valuations that had contributed to a market pullback.
Markets now shift focus to the U.S. Non-Farm Payrolls (NFP) report, which is expected to generate strong volatility across indices.
Technically:
Stocks rally after Nvidia’s strong earnings forecast, easing some AI-valuation concerns. Markets now await the NFP report, which could fuel major intraday volatility.
Below 6734: Bearish continuation toward 6670 → 6635 → 6610
Above 6754: Bullish breakout toward 6800 → 6844
Pivot: 6734
Support: 6670 · 6635 · 6610
Resistance: 6769 · 6800 · 6844
SPX500 stays bearish under 6734, and only a strong candle close above 6754 will confirm bullish momentum.

Testing the Golden Pocket (Bearish)The pair remains in a clear intraday downtrend. The impulsive move down was sharp, and the current price action resembles a classic "bear flag" or corrective relief rally into supply.We are seeing exhaustion wicks at the 0.5 level (1.30795). Failure to close above 1.3090 confirms bearish control.
Trade Plan:
Entry: Short on rejection of 1.3080 - 1.3088 zone.
Stop Loss: 1.3120 (Just above the 100% Fib / recent structural high).
Target 1: 1.3043 (Retest of swing lows).
Target 2: 1.3000 (Psychological level & potential liquidity sweep).

EURUSD Short: Price Sliding Back Toward 1.1540 SupportHello traders! EURUSD continues to move within a broader bearish trend structure, consistently respecting the descending Trend Line that has acted as a dynamic resistance for several weeks. Each retest of this line has resulted in strong bearish reactions, confirming persistent seller dominance. Throughout the decline, the market formed several pivot points and repeated breakouts, showing how price reacts to key liquidity areas. A notable pattern on the chart is the Rounding Top, which formed near the mid-trend zone and signaled an early shift from bullish correction to renewed bearish pressure. After completing this pattern, EURUSD dropped sharply, breaking down through support and heading toward the demand area. Recently, price attempted a breakout above the descending Trend Line but created a Fake Breakout, indicating that buyers were unable to hold gains above resistance. This rejection occurred inside the Supply Zone around 1.1620, reinforcing the bearish sentiment.
Currently, EURUSD is trading below the trend line once again, showing weakening bullish attempts and maintaining the overall downward trajectory. Price is slowly drifting toward the Demand Zone at 1.15400, which has previously served as a strong reaction area.
My scenario if EURUSD fails to break the descending Trend Line and stays below the Supply Zone, the pair is likely to continue moving lower toward the 1.15400 Demand Zone. This area is the next major support and the most probable target for sellers. However, if buyers defend the current levels and push price back toward resistance, a short-term correction toward the trend line may occur before another bearish impulse. A confirmed break below 1.15400 would open the way for further downside continuation, in line with the broader bearish structure. For now, the bias remains bearish while price trades under the Trend Line and below 1.1620. Manage your risk!

NASDAQNASDAQ Analysis – Possible Early Pullback Before New York Session
The Nasdaq may experience a short-term correction during the London session and pre–New York, especially after yesterday’s explosive 550-point rally driven by Nvidia’s strong earnings.
Price is currently sitting on the 0.786 Fibonacci level, which is acting as a strong support and has been respected multiple times. At the same time, the index is positioned just below the descending trendline formed from the recent highs.
The fractal structure has now been completed, suggesting we could see a small bearish move before the New York session potentially resumes the bullish trend.
If price fails to break below the 0.786 support and instead breaks above the descending trendline, we could see continuation to the upside, targeting 25,300 in the next impulsive leg.

XAUUSD correction?Gold (XAUUSD) Analysis – Correction After Multi-Day Rally
Gold is currently undergoing a correction after two strong bullish days, driven by fading expectations of U.S. rate cuts. As rate-cut optimism weakens, the dollar strengthens and naturally pressures gold lower.
Price has left several long wicks around the mid-channel zone, signaling rejection and suggesting a move toward the lower boundary of the ascending channel, around 4000–4015, during today’s session.
If this zone holds as support, gold should remain inside its bullish channel structure, and we could see a throwback or bullish continuation tomorrow.
However, if price breaks below 4000–4015, the next major support lies near 3960, where liquidity and previous demand converge.

EURUSD: Sellers Target Move Toward 1.1550 Support ZoneHello everyone, here is my breakdown of the current Euro setup.
Market Analysis
EURUSD is currently reacting within a broader corrective structure after failing to break above the major Resistance Area around 1.16500. This zone has repeatedly acted as a strong supply region, where price formed multiple rejection points and false breakouts. Each attempt to move higher was stopped by the descending Resistance Line, confirming continued bearish pressure. Earlier, EURUSD moved inside a wide Range Phase, followed by a breakout that initiated an upward correction inside an Upward Channel. However, bullish momentum weakened once price reached the upper boundary of the channel and the major resistance area. This led to a strong reversal and a bearish breakout below channel support.
Currently, EURUSD is climbing again toward the same Resistance Area near 1.16500, but the structure suggests the move is likely a corrective pullback, not a trend reversal. Price is approaching the intersection of the Resistance Line and the Resistance Zone, creating a confluence area where sellers are expected to regain control.As long as the market trades below this resistance cluster, the overall trend remains bearish. A rejection from the 1.16500 level could trigger a decline toward the Support Zone at 1.15550, which previously acted as a key demand region.
My Scenario & Strategy
I expect EURUSD to complete its pullback soon and resume the bearish trend once price reaches the 1.16500 Resistance Area. This zone remains the strongest supply region in the current structure. Potential short entries become valid once bearish confirmation appears near 1.16500, with the primary target at the 1.15550 Support Zone (TP1).
A clean breakdown below 1.15550 would signal continuation of the downtrend.
Alternatively, if EURUSD successfully breaks above 1.16500 and stays above the descending resistance line, bullish momentum may develop — but for now, this scenario remains secondary. Market bias stays bearish as long as price trades below resistance.
That's the setup I'm tracking. Thank you for your attention, and always manage your risk.

GBPUSD: Breakout & Important Supply Zone 🇬🇧🇺🇸
GBPUSD broke and closed below a key horizontal support.
The broken structure and a falling trend line compose a significant
supply zone now.
I will look for selling from there, expecting a bearish movement
to 1.3024 support.
❤️Please, support my work with like, thank you!❤️
I am part of Trade Nation's Influencer program and receive a monthly fee for using their TradingView charts in my analysis.

BITCOIN (BTC/USD): Classic Bullish Pattern: Bulls Eye 96kBitcoin recently approached a significant horizontal support level.
Following this, the price formed a bullish imbalance and broke above the resistance line of a falling parallel channel, closing above it on a 4-hour timeframe.
We may anticipate further growth in the Bitcoin price, with a potential goal of 96,000.

CHF/JPY: Important Breakout Confirmed📈CHFJPY has completed a correctional movement within a bullish flag pattern.
A confirmed violation of its resistance line, with a 4-hour candle closing above it, suggests a highly probable bullish continuation.
The next strong resistance is at 196.00.
This will be the next goal for buyers.

GBPUSD is expected to fall below 1.300.On the daily chart, GBPUSD has been trending downwards after forming a double top pattern, with the bears in control. Currently, the price is trading below the downtrend line. Short-term support is around 1.300; a break below this level could lead to a move towards support around 1.270. Intraday, look for opportunities to short on rallies in the 1.309-1.313 range.

Forex Major Pairs Trading (EUR/USD, USD/JPY, GBP/USD)1. EUR/USD – The Euro vs. the US Dollar
The EUR/USD is the most traded currency pair globally, representing the economies of the Eurozone and the United States. Its daily trading volume is massive, providing excellent liquidity and tight spreads.
Key Characteristics
High liquidity and low transaction cost
Moderate volatility, making it suitable for beginners and professionals
Strongly influenced by monetary policy divergence between the European Central Bank (ECB) and the Federal Reserve (Fed)
Factors Influencing EUR/USD
Interest Rate Decisions
When the Federal Reserve increases interest rates, USD strengthens, causing EUR/USD to fall, and vice versa. The same logic applies to ECB policy moves.
Economic Data Releases
Important indicators include:
US Non-Farm Payrolls (NFP)
Eurozone CPI (Inflation)
US GDP, PMIs, and Retail Sales
These reports can cause sharp intraday movements.
Risk Sentiment
In risk-off scenarios (fear in markets), USD strengthens as a safe-haven asset.
In risk-on environments (market optimism), EUR may strengthen.
Geopolitical events
Political instability in Europe, US policy changes, or global crises can greatly influence the pair.
Trading Strategies for EUR/USD
Trend following using moving averages
Breakout trading during major economic announcements
Range trading during low-volatility sessions (especially Asian session)
EUR/USD typically reacts cleanly to technical levels due to its high liquidity.
2. USD/JPY – The US Dollar vs. the Japanese Yen
The USD/JPY pair is the second most traded major pair. It is known for its sensitivity to interest rates, risk sentiment, and carry trade strategies.
Key Characteristics
Yen is considered a safe-haven currency
USD/JPY reacts strongly to bond market movements, especially US Treasury yields
Volatile during risk events (war, market crash, recession fears)
Factors Influencing USD/JPY
US Treasury Yield Movements
The Japanese Yen is highly sensitive to bond yields.
Rising US yields → USD strengthens → USD/JPY rises
Falling yields → JPY strengthens → USD/JPY falls
Bank of Japan (BOJ) Policies
Historically, the BOJ has maintained ultra-loose monetary policy, causing long-term yen weakness. When BOJ hints at tightening, the pair may fall sharply.
Global Risk Sentiment
In risk-off situations, investors shift to JPY, leading to USD/JPY decline.
In risk-on environments, JPY weakens, and the pair rises.
Government Intervention
Japan sometimes intervenes directly in forex markets when the yen becomes extremely weak or volatile. Such interventions cause sudden, sharp movements.
Trading Strategies for USD/JPY
Yield-driven trading: following bond yield trends
Safe-haven trading: buying JPY during risk-off events
Breakout strategies during Tokyo and London overlap
Carry trade strategy (borrowing yen at low rates to invest in higher-yield currencies)
USD/JPY often moves in clear directional waves, making trend trading effective.
3. GBP/USD – The British Pound vs. the US Dollar (‘Cable’)
Known as Cable, the GBP/USD pair is one of the most volatile major pairs. It represents the economies of the United Kingdom and the United States.
Key Characteristics
Higher volatility compared to EUR/USD
Influenced heavily by UK political events, BOE policy, and economic data
Provides good opportunities for short-term traders due to fast movements
Factors Influencing GBP/USD
Bank of England (BOE) Monetary Policy
Changes in interest rates, forward guidance, and inflation control measures significantly affect GBP.
UK Economic Data
High-impact indicators include:
CPI inflation
Wage growth
GDP data
Manufacturing & Services PMIs
Political Events
GBP/USD is sensitive to political developments such as:
Brexit negotiations
UK general elections
Government budget announcements
Risk Sentiment and Global Flows
During global uncertainty, USD strengthens, causing GBP/USD to fall.
Trading Strategies for GBP/USD
Volatility-based strategies (like Bollinger Bands)
News trading, especially during UK economic releases
Breakout strategies due to frequent sharp movements
Swing trading because the pair forms strong medium-term trends
GBP/USD is ideal for traders who can handle higher volatility and sharp reversals.
General Tips for Trading Major Currency Pairs
Follow Central Banks Closely
Policies from Fed, ECB, BOE, and BOJ shape the market direction.
Use Proper Risk Management
Volatility varies by pair; set stop-loss levels accordingly.
Watch Global Risk Sentiment
Safe-haven currencies like JPY behave differently from risk-on currencies like GBP.
Monitor Economic Calendars
High-impact events such as NFP, CPI, interest rate decisions, and geopolitical news greatly influence major pairs.
Combine Technical and Fundamental Analysis
Major pairs respond strongly to both analysis methods.
Conclusion
Trading major currency pairs like EUR/USD, USD/JPY, and GBP/USD provides opportunities for traders of all levels due to their high liquidity, consistent volatility, and predictable responses to economic data and central bank policies. Each pair has unique characteristics: EUR/USD is stable and technically clean, USD/JPY reacts strongly to yields and risk sentiment, and GBP/USD offers high volatility with rich trading opportunities for experienced traders. Understanding the factors driving these pairs and applying disciplined risk management is essential for long-term success in the forex market.

Don't miss this excellent opportunity to buy gold at low prices.In the current gold market, the price action is becoming clearer, with key support and resistance levels emerging. The 4050-4030 support zone deserves particular attention, as it offers strong support. If the price retraces to this level and successfully stabilizes, it would be an excellent entry point for long positions, potentially allowing bulls to launch an upward attack. Resistance is seen around 4110-4120. When the price first touches this area, it may face pullback pressure due to technical factors. However, if the price can consolidate and effectively hold above 4120, the possibility of further upward movement towards the 4150 target this week will significantly increase. Based on the current overall performance of gold, the market can be considered to be trading within the 4030-4120 range. The trading strategy should focus on buying on dips, taking advantage of rebounds from support levels to generate profits. At the same time, strict position control is crucial, as market conditions are constantly changing. Furthermore, it is essential to closely monitor real-time data and market dynamics to flexibly adjust trading strategies.
Gold trading recommendation: Buy gold in batches around the 4050-4030 range, with a target of 4080-4100.

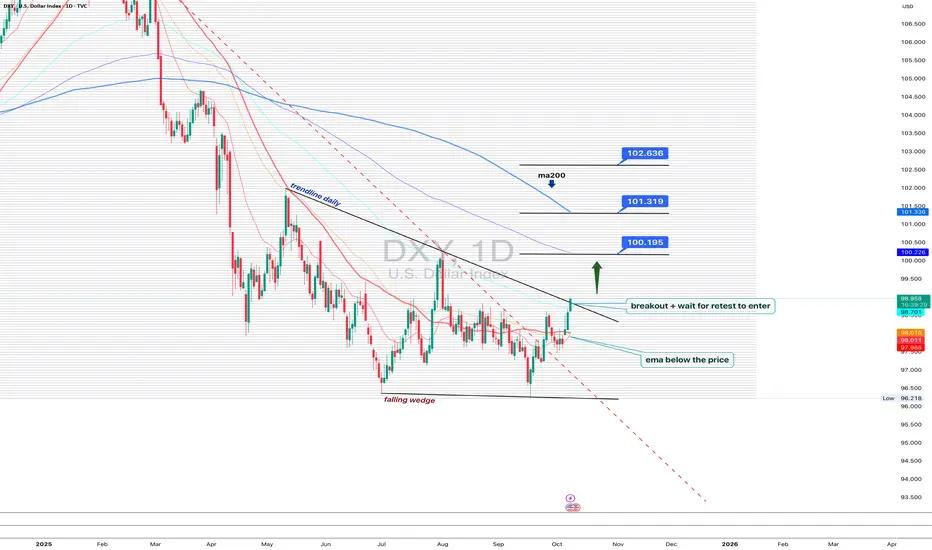
DXY 1D - dollar waking up, but patience is keyOn the daily chart, the US Dollar Index is showing the first signs of recovery: a falling wedge breakout and trendline breach hint that bulls are slowly reclaiming control. Price has moved above the EMA, a short-term bullish signal.
Still, MA200 remains above, reminding us that the broader trend is not yet flipped. The ideal play here - wait for a retest of the breakout trendline to confirm buyers’ strength before jumping in.
If price holds above 99.70, the next upside targets sit around 100.19, 101.31, and 102.63.
But keep in mind - DXY loves to test patience. False breakouts are its favorite sport.
Right now, the dollar looks ready to wake up, but maybe hit the snooze button one last time before the real move begins.
BHEL possible 17 years breakout candidateBharat Heavy Electricals Ltd. (BHEL) (currently trading near ₹260.40) – Overview BHEL, headquartered in New Delhi, is India’s largest engineering and manufacturing enterprise in the energy and infrastructure sector. Established in 1964, it designs, manufactures, and services a wide range of products including power generation equipment, transmission systems, renewable energy solutions, defense equipment, and industrial systems. BHEL operates across India with 16 manufacturing units, 2 repair units, and 4 regional offices, serving both domestic and international markets.
FY22–FY25 Snapshot • Sales – ₹21,210 Cr → ₹23,450 Cr → ₹25,800 Cr → ₹28,200 Cr Growth driven by power sector revival, renewable energy projects, and defense contracts
• Net Profit – ₹410 Cr → ₹520 Cr → ₹640 Cr → ₹780 Cr Earnings supported by cost optimization, higher execution, and diversification into defense and renewables
• Operating Performance – Moderate → Strong → Strong → Very Strong EBITDA margins improving with better order execution and higher share of non-power business
• Dividend Yield (%) – 1.20% → 1.30% → 1.40% → 1.50% Consistent payouts alongside reinvestment into modernization and R&D
• Equity Capital – ₹348 Cr (constant) Government of India remains the majority shareholder
• Total Debt – ₹1,200 Cr → ₹1,100 Cr → ₹1,000 Cr → ₹950 Cr Gradual deleveraging supported by strong operating cash flows
• Fixed Assets – ₹12,500 Cr → ₹12,700 Cr → ₹12,900 Cr → ₹13,100 Cr Capex focused on renewable energy, defense manufacturing, and modernization of plants

GBPUSD Fractals ( Cable )Great Britain Pound Major Movments
inside And Small Fractals
For Fractal Academy
By Sina Sadeghi

Gold bulls launch a strong counterattack!After a prolonged period of narrow-range fluctuations, gold reached a high of around 4120 before pulling back. Currently, the overall structure remains bullish. Market conditions are constantly changing, and stubbornness is the worst thing in trading. Neither die-hard bulls nor die-hard bears can last in the face of the market. We should follow the trend; this is the fundamental logic of professional trading. Don't fight the market; just follow the trend. Currently, the bulls still hold the initiative in gold. Short-term pullbacks are more about consolidation than a trend reversal. As long as the upward momentum continues, pullbacks are opportunities, not risks. The key focus going forward is the pullback performance in the 4090-4070 area. As long as it holds, this area remains a good place to buy on dips. The market always punishes those who defy it. Hitting a wall is a lesson; understanding the direction is growth. Following the trend is the easiest and most stable way to trade. Continue to follow the rhythm; opportunities are for those who choose the right direction.
