XAUUSD Bearish Signal | Technical + Custom AlgoSmart Trend Signal | Technical Analysis + Custom Algorithm
This signal is the result of a combination of classic technical trend analysis and a proprietary software I personally developed.
Trend Lines

Skeptic | Gold (XAU/USD): Breakout Triggers Set to Pop?Hey everyone, Skeptic here! Let’s fire up this Thursday morning with a fresh Gold (XAU/USD) analysis! 😊 We’re diving into the Daily Timeframe to spot the trend, then zooming into the 4-Hour Timeframe for juicy long and short triggers. Stay with me—let’s get to it! 📊
Daily Timeframe: The Big Picture
Gold’s been on a tear, climbing to a high of 3416.19 (it went higher, but I’m using the candle close for faster triggers when we hit those levels :)). Now, we’re in a correction phase, forming a downward channel . This correction has been solid, dropping to the 0.5% Fibonacci retracement. What’s cool about this channel is how cleanly it’s reacting to the ceiling, floor, and midline, making it super valid for us. A break of either the ceiling or floor could give us some killer triggers. But since we’re in a correction, it’s smart to dial back risk on all positions. Lowering risk can mean taking profits quicker, shrinking position sizes, tighter stop losses, or a mix of these to keep your account safe.
4-Hour Timeframe: Long & Short Setups
Now, let’s get to the 4-hour chart for our long and short triggers.
📈 For longs, we’ve got two setups. The first is a bit risky since we haven’t confirmed the downward channel breakout yet—it’s a preemptive move. You can go long after breaking the resistance at 3366.71 . Our main long trigger, though, is a break above 3416.19 , which also cracks the channel’s ceiling and sets us up for new all-time highs. If you catch this one, don’t rush to take profits too fast—let it run!
📉 For shorts, a break below support at 3249.68 opens the door, with RSI hitting oversold as a solid confirmation. But since this goes against the major uptrend, it’s risky—take profits early and keep position sizes small to stay safe. :)
💬 Let’s Talk!
If this analysis sparked some ideas, give it a quick boost—it means a lot! 😊 Got a pair or setup you want me to dive into next? Drop it in the comments, and I’ll tackle it. Thanks for joining me—see you in the next one. Keep trading smart! ✌️

Gold shocks extreme pull, US market layout🗞News side:
1. Musk issued the "strongest" condemnation of Trump
2. Trump and Netanyahu failed to reach an agreement, and the US-Iran negotiations may be "disrupted" by Israel
📈Technical aspects:
The trading strategy we have given is still valid. The current gold price trend on the hourly chart shows a standard descending flag pattern. If this pattern continues to be effective, there is a high possibility that the gold price will fall below 3285-3280. Once it falls below this range, as we gave in the strategy this morning, it may fall to the 3260-3250 line. However, the premise for this expectation to be established is that the gold price cannot break through and stabilize on the upper track of the consolidation channel, otherwise the descending flag pattern will be invalid. Therefore, for US market operations, short positions can be arranged around the upper rail of 3325, paying attention to the suppression effect; for the lower rail, first pay attention to the support effect of 3300.
sell 3325-3330
TP 3310-3300
buy 3290-3280
TP 3310-3320
If you agree with this view, or have a better idea, please leave a message in the comment area. I look forward to hearing different voices.
FOREXCOM:XAUUSD FXOPEN:XAUUSD TVC:GOLD FX:XAUUSD OANDA:XAUUSD

Skeptic | SPX 500 Update: Bullish Breakout Brewing?Hey everyone, Skeptic here! It’s been a while since we’ve checked in on the SPX 500 , but the market’s now flashing a killer long opportunity with a high R/R—don’t miss this one! 😊 Stay with me to the end for the full breakdown. Let’s dive into the Daily Timeframe to set the stage. 📊
Daily Timeframe: The Big Picture
The SPX 500 pulled off a deep correction , dropping from a high of 6154.64 to lows around 4810.39 with some wild shadows that caught everyone off guard. But now, it’s firing up with fresh momentum, carving out higher highs and higher lows that scream bullish strength. The corrections in this new uptrend are super shallow and flow with the trend—exactly what we want to see! After hitting resistance at 5961.82 , we’ve had a slight pullback, but it looks like this correction is wrapping up, and we’re on the verge of the next big uptrend leg. Let’s zoom into the 4-Hour Timeframe to hunt for long and short triggers.
4-Hour Timeframe: Long & Short Setups
On the 4-hour chart, the correction shaped up as a descending trendline . We broke it, pulled back, and now we’re primed to crack 5895.39. A breakout above this level is our main long trigger. To get more precise, let’s check the 1-Hour Timeframe.
For the long setup , a clean break above 5896.34 gets us in the game. This move also busts through P.P. Level 1, giving us solid confirmation, and we could ride the wave up to P.P. Levels 3 or 4, targeting 5930.83 to 5956.97 . Those are prime spots to lock in some profits, but don’t close the whole position—since we’re trading with the trend, we can hold for more upside. For shorts, I’ve got nothing. Going against this bullish momentum would be pure madness! I’d wait for a sharp drop below support at 5849.67 before even considering short triggers, but right now, there’s zilch.
💬 Let’s Talk!
If this update sparked some ideas, give it a quick boost—it means a lot! 😊 Got a pair or setup you want me to tackle next? Drop it in the comments. Thanks for hanging out— let’s grow together and remember: Weathermen forecast. We trade! :))) ✌️


IREDAThis stock is showing signs of a potential reversal on the weekly timeframe, based on Fibonacci retracement levels, and may move upwards.

XAUUSD June 2025 forecastI'm seing XAUUSD consolidating before FED announces their decision on interest rates which would decide the direction of gold.

GBPUSD InsightHello to all our subscribers.
Please feel free to share your personal opinions in the comments. Don’t forget to like and subscribe!
Key Points
- NVIDIA’s Q1 earnings exceeded expectations. Despite export restrictions to China under the Trump administration, NVIDIA performed strongly, boosting risk appetite in the markets.
- The May FOMC meeting minutes confirmed that Fed officials will maintain a wait-and-see approach in conducting future monetary policy.
- A U.S. federal court ruled that the Trump administration’s “reciprocal tariffs” are invalid, stating, “The tariff order is nullified and permanently prohibited,” and ordered a cancellation of all tariffs collected thus far.
This Week’s Key Economic Events
+ May 29: U.S. Q1 GDP
+ May 30: U.S. April Personal Consumption Expenditures (PCE) Price Index
GBPUSD Chart Analysis
As anticipated, a peak formed around the 1.35500 level, followed by a downward trend. A mid- to short-term downtrend is likely from the current range, with the next potential low expected near the 1.32000 level.
However, if the price unexpectedly breaks above the 1.36000 level, the high could extend toward the 1.40000 level, indicating a shift toward a bullish trend.

Crude oil rebounds after encountering 60 support
📊Technical aspects
Due to concerns that global supply growth may exceed demand growth, WTI prices fell slightly and rebounded slightly after hitting the 60 mark.
From the daily chart level, the medium-term trend moving average system suppresses the rebound of oil prices, and the medium-term objective trend direction is downward. After the oil price hit the low of 55.20, the frequent alternation of long and short formed, and the embryonic form of the falling flag relay appeared from the shape. Pay attention to the strength of the oil price testing the upper edge of the flag. It is expected that after the medium-term trend fluctuates, it will still rise to the 64 position.
The short-term (1H) trend of crude oil fell and touched the key support of 60, then rose slightly. The moving average system turned to divergent upward arrangement, and the short-term objective trend direction was upward. The MACD indicator fast and slow lines crossed the zero axis, and the bullish momentum was sufficient. It is expected that the trend of crude oil will continue to rise during the day, and the probability of breaking through the 63 resistance and moving upward is relatively high.
💰 Strategy Package
Long Position: 60.5-61.5

Gold price shorts stabilize, continuing to fall
💡Message Strategy
Gold prices fell into a weak consolidation pattern as the U.S. dollar continued to rebound and market risk appetite increased, suppressing safe-haven demand. Although it rebounded slightly, it failed to stand firm at $3,300, indicating that the upper resistance is still strong.
From a fundamental perspective, the recently released US durable goods orders and consumer confidence index performed better than expected, providing support for the US dollar.
Specific data showed that US durable goods orders fell 6.3% in April, better than the expected -7.9%, although far lower than the revised value of 7.6% last month; core orders (excluding transportation) recorded an increase of 0.2%. In addition, the US consumer confidence index rebounded sharply to 98 in May, the largest monthly increase in nearly four years, reflecting the improvement of economic and employment prospects.
Trump's postponement of the 50% tariff on the European Union until July 9 has strengthened risk appetite in the short term and weakened the safe-haven demand for gold. However, there are still major uncertainties in trade policy, coupled with the continued deterioration of the US fiscal situation and continued geopolitical risks, which provide some support for gold prices.
In addition, the market generally expects the Federal Reserve to cut interest rates twice in 2025, and this prospect is gradually being factored into gold prices. In particular, if the "Beauty Act" is passed, it will aggravate the fiscal deficit, which may put medium-term pressure on the US dollar and provide long-term support for non-yielding gold.
📊Technical aspects
On the technical level, gold prices fell below the short-term rising trend line on Tuesday and then fell further. It is currently testing the $3,300 level where the 200-period moving average of the 4-hour chart is located. Once the moving average is clearly broken and a valid close is formed, the short-term downward trend may be confirmed.
The initial support level below is in the $3,250-3,245 area. This range has formed a consolidation platform in the past few trading days. Once it falls below or triggers more stop-loss selling, the target will point to the $3,200 integer mark.
Therefore, for the next gold, the best way is to suppress the decline at 3320, break through 3285 (expand the range to find 3275), and successfully break through the downward switching space range of about 30-40 US dollars. If the price breaks through 3320, it will be treated as a sweep, waiting for the upper side to determine the higher resistance of 3330-3325, and then look down to 3285 (expand the range to find 3275), breaking through the switching space
💰 Strategy Package
Short Position:3320-3330,3340-3350

With Bullish bias into new Week - 2025/05/26Last week, I published my idea for a whole week with daily updates for the first time. You can read about it here:
🎯 The target of $3348 was reached on Friday due to the announcement of new tariffs against the European Union.
💡 Here is my idea for the week from May 26-30, 2025.
First things first, the Friday session last week ended with bullish momentum. Even though the gold price consolidated more at the $3366 mark, it was obviously to allow time to pass and calm down stressed values like EMA or MACD. This is a very good sign for the start of the week because if the Asia timezone takes the invite, the gold price has a good chance to rise. My expectation is a bullish GAP right at the beginning; if so, it's a clear sign for the rest of the day, in my opinion. These thoughts would support my goal from above $3500 during the week.
📰 Geopolitical News Landscape
India / Pakistan
The ceasefire from May 10 remains tense but intact. Both sides claim victory, while Pakistan strengthens ties with China. Cross-border attacks have ceased, but mutual distrust persists.
➡️ Situation remains fragile; renewed escalation is possible.
Gaza Conflict
Israel intensifies "Gideon’s Chariot" with ground forces in Khan Younis. Mass evacuations and high civilian casualties worsen the humanitarian crisis. Peace talks have stalled as the offensive continues.
➡️ No relief in sight; humanitarian conditions are deteriorating further.
Russia / Ukraine
On May 24, Russia launched its largest air assault yet with 367 missiles and drones—13 civilians were killed. Just before, both sides exchanged 1,000 prisoners. Peace talks remain suspended.
➡️ Violence is escalating; a ceasefire remains out of reach.
U.S.–China Trade War
The 90-day tariff pause triggered a rush to import from China. Shipping bottlenecks and high freight rates are straining businesses. Structural issues remain unresolved.
➡️ Short-term easing; long-term tensions persist.
Trade War on global view
The global trade war has escalated in May 2025, with the U.S. imposing a 50% tariff on EU imports and a 25% levy on foreign-made smartphones, citing trade imbalances. The EU has condemned these moves, warning of potential retaliation. In response to U.S. tariffs, China has restricted rare earth exports, impacting global supply chains. ASEAN nations, heavily affected by U.S. tariffs ranging from 10% to 49%, are urging deeper regional integration to mitigate economic disruptions. The IMF has downgraded global growth forecasts to 2.8% for 2025, citing trade tensions and policy uncertainty. Supply chains are being restructured, with companies shifting production to countries like Vietnam and Mexico. Financial markets are volatile, with increased inflationary pressures and investor anxiety.
➡️ Emerging markets face currency volatility and economic instability due to the ongoing trade conflicts.
⚖️Trump vs. Powell
President Trump increases pressure on Fed Chair Powell to cut rates. The Fed holds interest rates at 4.25–4.5% and warns of inflation. A 10% staff reduction is planned to boost efficiency.
➡️Political interference is increasingly destabilizing markets.
U.S. Inflation – April 2025
Inflation dropped to 2.3%, the lowest since February 2021. However, consumer inflation expectations remain high at 7.3%. The University of Michigan Consumer Sentiment Index fell to 50.8—a historic low.
➡️A clear gap is emerging between official data and public perception.
🔋 Technical Analysis – Short-Term
📊 Analysis: May 19–24, 2025
Weekly Low: $3,204 (May 20)
Weekly High: $3,366 (May 23)
Weekly Close (May 23): approx. $3,358
Total Gain: +5%
🟢 Trend: A clear uptrend is evident. After hitting a low of $3,204 on May 20, gold experienced a strong rally, forming consistently higher highs and higher lows. A brief pullback on May 22 was quickly bought up.
📈 Structure: A series of bullish flag patterns developed, each resolving to the upside. The high at $3,366 currently marks the most significant resistance level.
🔮 Outlook from May 26, 2025
Resistance: $3,366 (recent high)
Support: $3,310 (last local low), below that $3,280 (breakout zone)
Bias: Bullish as long as price holds above $3,310
📌 Scenario 1 – Bullish Breakout: A sustained breakout above $3,366 could unlock further upside potential toward the $3,390–$3,410 area. When Asia session starting with bull GAP the Scenario is the one i preffer.
📌 Scenario 2 – Pullback: A retracement to the $3,310–$3,280 zone would be a healthy correction within the trend, provided this zone holds.
🧭 Conclusion:
Gold remains in a steady uptrend. As long as support levels hold, a continuation toward $3,500 is likely. RSI may be overbought on higher timeframes, so short-term consolidations are possible, but structurally the setup remains bullish.
Anything to ad? Feel free to tell your thoughts.
-------------------------------------------------------------------------
This is just my personal market idea and not financial advice! 📢 Trading gold and other financial instruments carries risks – only invest what you can afford to lose. Always do your own analysis, use solid risk management, and trade responsibly.
Good luck and safe trading! 🚀📊

EUR/GBP Weekly Breakout With Potential Retest Toward 0.85On the weekly timeframe, EUR/GBP has broken above a long-standing descending trendline that has acted as dynamic resistance since late 2022. This trendline has been respected multiple times, as shown by the repeated rejections near the line, indicating strong selling pressure in previous attempts. However, the recent bullish breakout marks a potential shift in the market structure.
After a clean break above the descending trendline, price has started to retrace toward the breakout zone. This behavior is typical and aligns with classical technical analysis, where previous resistance often turns into new support. The region around the broken trendline, particularly near the psychological level of 0.8500, now becomes a key area to watch for a retest and potential bounce.
A successful retest around 0.835–0.84 could signal continuation of the bullish breakout, with 0.8500 serving as the next key resistance and potential short-term target. A rejection from this area, combined with bullish candlestick confirmation, could offer a favorable long entry opportunity. However, if the retest fails and price falls back below the trendline, it would invalidate the breakout structure and could indicate a false breakout scenario.
Trade Plan:
Retest Entry Zone: 0.8350–0.8400 (look for bullish confirmation)
Target: 0.8500 (psychological resistance)
Stop-Loss: Below 0.8300 (to invalidate trendline support)
This setup reflects a textbook breakout-and-retest structure, offering a clear technical roadmap supported by trendline theory and psychological level behavior. Traders should wait for confirmation before committing to a position.
Disclaimer: This analysis is part of a trading plan and does not constitute trading advice. Always apply proper risk management in every trading decision.

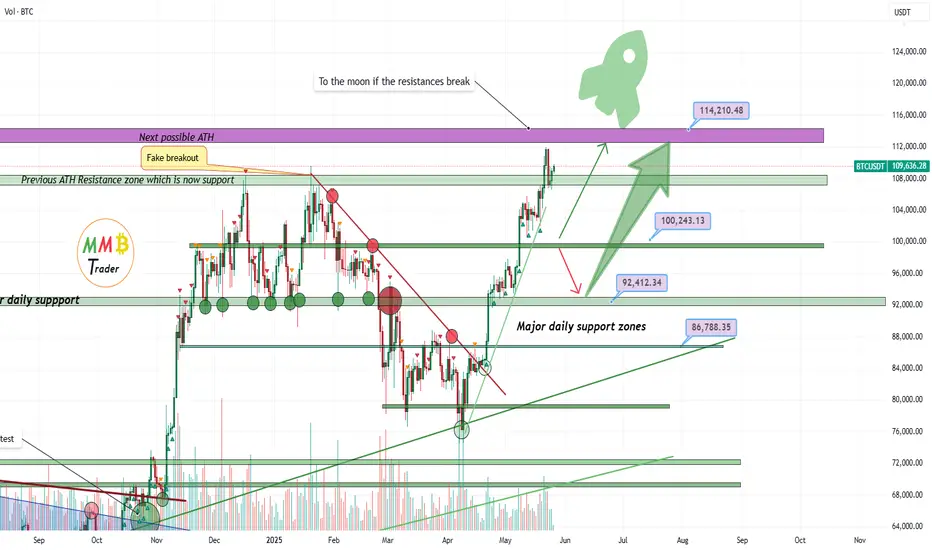
Bitcoin soon above 114K and market there would be nonstop pumpAs we can see price is near our possible ATH resistance zone which soon can break and any breakout there cause a bullish market which Alts will pump hard after a years of sleep.
Major supports are also mentioned on the chart too and previous ATH resistance zone now is strong support which retest also completed.
DISCLAIMER: ((trade based on your own decision))
<<press like👍 if you enjoy💚
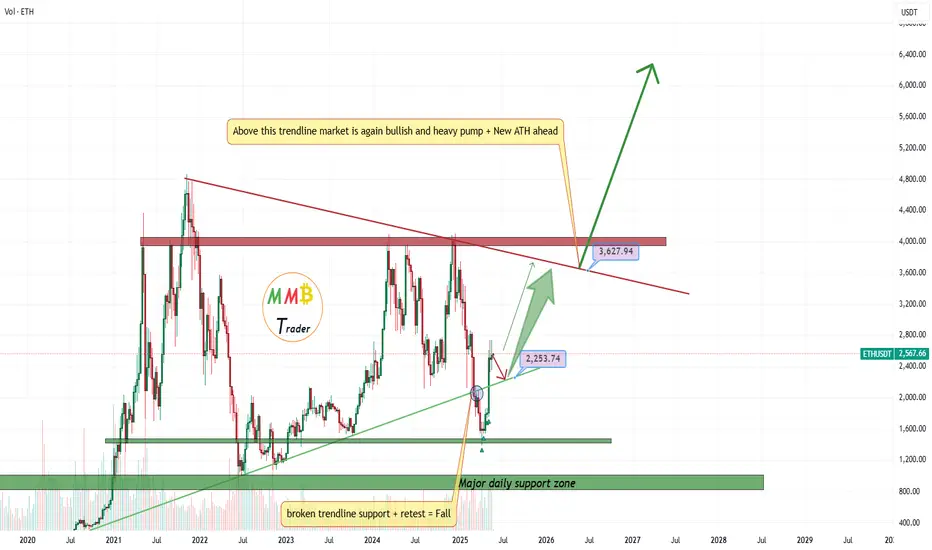
ETHUSDT still sleep but soon will break the NewsETHUSDT this time will touch new ATH with Bitcoin pump not like previous time sleep price is still weak but first resistance is broken and soon will pump above 3000$ and the journey will start there and huge pump will lead ASAP.
DISCLAIMER: ((trade based on your own decision))
<<press like👍 if you enjoy💚
Bitcoin is Nearing a Key Support Level!!!Hey Traders, in today's trading session we are monitoring BTCUSDT for a buying opportunity around 107,000 zone, Bitcoin is trading in an uptrend and currently is in a correction phase in which it is approaching the trend at 107,000 support and resistance area.
Trade safe, Joe.

GBPJPY is Holding above the SupportHello Traders
In This Chart GBPJPY HOURLY Forex Forecast By FOREX PLANET
today GBPJPY analysis 👆
🟢This Chart includes_ (GBPJPY market update)
🟢What is The Next Opportunity on GBPJPY Market
🟢how to Enter to the Valid Entry With Assurance Profit
This CHART is For Trader's that Want to Improve Their Technical Analysis Skills and Their Trading By Understanding How To Analyze The Market Using Multiple Timeframes and Understanding The Bigger Picture on the Charts

GBPNZD Pushing itself in a buy directionHello Traders
In This Chart GBPNZD 4 HOURLY Forex Forecast By FOREX PLANET
today GBPNZD analysis 👆
🟢This Chart includes GBPNZD market update)
🟢What is The Next Opportunity on EURNZD Market
🟢how to Enter to the Valid Entry With Assurance Profit
This CHART is For Trader's that Want to Improve Their Technical Analysis Skills and Their Trading By Understanding How To Analyze The Market Using Multiple Timeframes and Understanding The Bigger Picture on the Charts

Will EURCAD rise from a strong Support LevelHello Traders
In This Chart EURCAD HOURLY Forex Forecast By FOREX PLANET
today Gold analysis 👆
🟢This Chart includes_ (EURCAD market update)
🟢What is The Next Opportunity on EURCAD Market
🟢how to Enter to the Valid Entry With Assurance Profit
This CHART is For Trader's that Want to Improve Their Technical Analysis Skills and Their Trading By Understanding How To Analyze The Market Using Multiple Timeframes and Understanding The Bigger Picture on the Charts

Gold is in the bullish direction after correcting the supportHello Traders
In This Chart GOLD HOURLY Forex Forecast By FOREX PLANET
today Gold analysis 👆
🟢This Chart includes_ (GOLD market update)
🟢What is The Next Opportunity on GOLD Market
🟢how to Enter to the Valid Entry With Assurance Profit
This CHART is For Trader's that Want to Improve Their Technical Analysis Skills and Their Trading By Understanding How To Analyze The Market Using Multiple Timeframes and Understanding The Bigger Picture on the Charts
BTC - the trendline no-one is watchingDaily TF / logarithmic chart
A trendline has been in play since September 2023 where Bitcoin has found support on multiple occasions (thick white line). With a brief breakthrough in April.
Currently looking a bearish div. on 4H chart which would signify a move down. Using the fib chart, a break below said trendline could take us to the 618 which is also a liquidity-rich zone (around 66-68K price range).
The trendline could begin to act as resistance if this scenario plays out.
Based on previous Bitcoin halving cycles the "peak" always occurs in Nov-Dec of the year following the halving event 2013 / 2017 / 2021... 2025?

Oil Buy analysis/ideaThis trade is based on the Daily and 4-hour timeframes and executed using reversal trading and trend formation. Complete explanation in the video!

Trendline Breakout - SPARCCurrent Price: ₹169.82
Technical Analysis:
Trendline Breakout Pattern: This is a bullish technical signal. A breakout from a trendline, especially if it was a resistance trendline, suggests that the stock has overcome a significant hurdle and is likely to move higher. For confirmation, it's ideal to see the breakout accompanied by strong trading volume.
Immediate Target: ₹233
Time Frame: 3 to 6 months (This suggests a medium-term horizon for achieving the target).
Fundamental Analysis:
Company Overview: SPARC is a pharmaceutical company engaged in research and development. It's important to note that R&D-focused companies often have different financial profiles compared to established, revenue-generating pharmaceutical companies. They typically have lower or even negative profits in the short term as they invest heavily in developing new drugs and technologies.
Quarterly Results (Q4 FY25 - ended March 31, 2025):
SPARC often reports losses due to its R&D heavy nature. For Q4 FY25, the company reported a consolidated net loss of ₹90.3 crore, higher than the loss of ₹60.8 crore in Q4 FY24.
Revenue from operations also declined to ₹40.5 crore in Q4 FY25 from ₹51.4 crore in Q4 FY24.
Yearly Results (FY25 - ended March 31, 2025):
For the full fiscal year FY25, SPARC reported a consolidated net loss of ₹363.8 crore, significantly higher than the loss of ₹237.3 crore in FY24.
Revenue from operations for FY25 also decreased to ₹182.2 crore from ₹236.8 crore in FY24.
P/E Ratio: Given that SPARC often reports losses, its P/E ratio is typically not applicable (N/A) or negative, as a P/E ratio requires positive earnings. Investors usually evaluate such companies based on factors like pipeline progress, clinical trial results, regulatory approvals, and potential market size of their innovations rather than traditional profitability metrics.
EPS Comparison: As the company is often in a loss-making phase due to R&D expenses, the EPS is typically negative. Comparing negative EPS values can be less insightful than tracking the progress of their drug pipeline.
Corporate Actions:
Dividend: SPARC typically does not pay dividends given its R&D phase and often negative profitability.
Funding/Partnerships: Key corporate actions for SPARC would include fundraising rounds, strategic partnerships for drug development or commercialization, and announcements related to regulatory approvals or clinical trial successes.
Company Order Book:
SPARC, being an R&D company, generally does not have a traditional "order book" like manufacturing or infrastructure companies. Its future revenue visibility depends on successful drug development, licensing agreements, or commercialization of its patented products.
Latest News:
Q4 and FY25 Results: The latest news would likely focus on the company's increased losses and decreased revenue, along with management commentary on the progress of their various drug candidates in clinical trials.
Clinical Trial Updates: Any announcements regarding the phases of clinical trials (Phase I, II, III), interim results, or regulatory submissions for its drug pipeline would be significant news.
Research & Development: Updates on new research areas or technological advancements.
Overall Assessment:
SPARC presents a challenging fundamental picture with consistent losses and declining revenue, typical of an R&D-heavy pharmaceutical firm. Investors in SPARC are essentially betting on the future success of its drug pipeline.
The Trendline Breakout pattern identified in your technical analysis suggests that the stock might be building momentum. If the market is anticipating a positive development (e.g., successful trial results, regulatory approval) that could fundamentally change its profitability, then the technical breakout might be a leading indicator. The immediate target of ₹233 would represent a significant upside.
However, it is crucial to understand that for a company like SPARC, technical breakouts can be highly speculative without a corresponding positive fundamental catalyst related to its drug development pipeline. The stock's movement is heavily dependent on news flow regarding its R&D projects.
Key Factors to Monitor:
Confirmation of Technical Breakout: Ensure the breakout is sustained with strong volume.
R&D Pipeline Progress: This is paramount. Track updates on their drug candidates, clinical trial results, and regulatory milestones.
Cash Burn Rate: Given its losses, monitor the company's cash position and burn rate.
Strategic Partnerships: Any new collaborations could provide funding and validation for its research.
Disclaimer: This analysis is for informational purposes only and does not constitute investment advice. Investing in R&D-focused pharmaceutical companies like SPARC carries inherently high risks due to the uncertainty of drug development and regulatory approvals. Always conduct your own thorough research, understand the company's drug pipeline, assess your risk tolerance, and consult with a qualified financial advisor before making any investment decisions.

MercadoLibre Inc Stock Quote | Chart & Forecast SummaryKey Indicators On Trade Set Up In General
1. Push Set Up
2. Range Set up
3. Break & Retest Set Up
Notes On Session
# MercadoLibre Inc Stock Quote
- Double Formation
* (Upper Band)) #1 - *4% Settings Condition | Completed Survey
* Entry & Retest At 0.5 Retracement Area | Subdivision 1
- Triple Formation
* (EMA Settings))
* 100 EMA - *Support & Resistance | Subdivision 2
* (TP1) | Subdivision 3
* Daily Time Frame | Trend Settings Condition
- (Hypothesis On Entry Bias)) | Indexed To 100
- Position On A 1.5RR
* Stop Loss At 156.00 USD
* Entry At 165.00 USD
* Take Profit At 180.00 USD
* (Ranging Argument)) & No Pattern Confirmation
* Ongoing Entry & (Neutral Area))
Active Sessions On Relevant Range & Elemented Probabilities;
European-Session(Upwards) - East Coast-Session(Downwards) - Asian-Session(Ranging)
Conclusion | Trade Plan Execution & Risk Management On Demand;
Overall Consensus | Buy
