AU LongD: Uptrend, price broke trendline, LL and LH
4H: Uptrend, HH and HL, price retraced 61.8% and hit -27 so far
1H: Uptrend, price retraced 50% so far, breaking above minor trendline.
Minor structure, broke and retested resistance as support, with double bottom
CURRENTLY: I'm looking for price to go long to 1H support/resistance zone and continue long to -27 on 1H FIB
Trend Lines

How to seize reliable trading opportunities?Gold rebounded at the opening as expected before declining, successfully breaking through the 3330 support level and hitting a low near 3323. Bulls and bears are locked in a stalemate at this level, and the market awaits the outcome of the upcoming Trump-Putin summit for market direction. Technically, gold remains in a weak, volatile, and downward trend, with limited rebound momentum. At the beginning of this week, market focus was on the latest developments in the Russia-Ukraine negotiations. If Ukraine compromises and reaches a ceasefire agreement, gold's decline could accelerate once the situation becomes clear. Gold prices saw a tentative decline at the opening before quickly rebounding to around 3358, but the upward momentum has not been sustained, remaining range-bound. Avoid blindly chasing highs in such a rally; it's better to wait for a correction before entering the market near the resistance level.
On the gold operation strategy: focus on the 3335-3320 area on the downside. If it falls back and stabilizes, consider long positions with the target at 3350-3360. If it touches the 3360-3375 area for the first time and encounters resistance but does not break through, try short-selling strategies.

Can anyone help me charting VET?Can anyone help me with charting VET. I am trading at the Daily. Daily stock heading to the bottom. Still in A phase. 50/200MA cross about to come. I want to sort out my TP. The yellow dotted lines are resistances. I took a Fib from ATH at dec 2021 to the bottom (yellow circles). Did I draw the Fib right? I am planning my trade ahead. Already inn for a good price. I think my next TP on the Daily will be between 0.048 (last high) and 0.069 (Fib 0.236) or can I look at the next Fib 0.382 because the 0.236 was already hit in dec 2024? another question, did I draw the trendlines correct?

Memecoin DailyView | The Web3 Power of Memeland💀 Hey , how's it going ? Come over here — Satoshi got something for you !
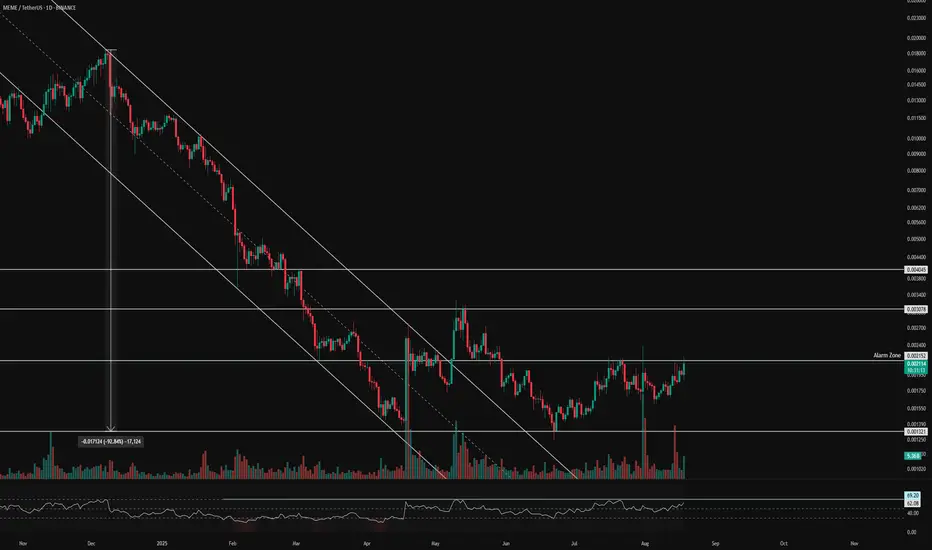
⏰ We’re analyzing Meme on the 1-Day timeframe .
👀 On the daily timeframe of Memecoin, we can see that after a deep 93% correction, MEME broke out of its descending channel. It then faced another pullback on lower timeframes. A very strong bottom was formed around 0.001321, and from this level, with increasing volume and trades, MEME moved upward towards the resistance at 0.002152. Currently, it is trying to break this resistance, which has previously acted as the top of the box and caused rejections .
⚙️ The key RSI level is at 69.20–70. If this level is broken, increased buying momentum could push MEME into the Overbought zone, attracting more buyers .
🕯 Today, the number of long trades has increased, and the size of today’s daily candle looks strong so far. With more buying volume, MEME could break this resistance and aim for higher price levels .
💡 This coin was created by the 9GAG team, who are active in the memecoin sector. The project is a new form of internet money inspired by meme culture. It currently ranks #337 on CoinMarketCap. The project is fully decentralized and operates as a DAO, where NFT holders take part in governance and decision-making .
🔔 The Alert zone is at 0.002152. If this level breaks and confirms, it could provide a good entry for long trades. The short position alert zone is below the daily bottom, but personally, I would avoid shorting this coin .
❤️ Disclaimer : This analysis is purely based on my personal opinion and I only trade if the stated triggers are activated .
EURUSD | Testing Support Levels Under Geopolitical PressureEURUSD Overview
The geopolitical backdrop continues to weigh on EURUSD, keeping traders cautious.
Technical Outlook:
The pair maintains a bearish bias while below 1.1684, with downside targets at 1.1627 and 1.1557.
However, a break above the pivot zone around 1.1780 would shift momentum bullish, opening the way toward 1.1882.
Pivot: 1.1684
Support: 1.1627, 1.1556, 1.1450
Resistance: 1.1751, 1.1882

EURGBP: Up Move From Support Confirmed 🇪🇺🇬🇧
Odds are high that EURGBP will continue rising
after a test of a major daily support cluster.
The price violated a resistance line of an expanding wedge pattern
on an hourly time frame, indicating a strong intraday bullish sentiment.
Goal - 0.865
❤️Please, support my work with like, thank you!❤️
I am part of Trade Nation's Influencer program and receive a monthly fee for using their TradingView charts in my analysis.

Gold | Safe-Haven Demand Rises Ahead of Trump–Zelensky Talks XAU/USD: Gold Prices Jump as Traders Shift Focus to Trump–Zelensky Meeting
Backed by European leaders, Ukraine’s President Volodymyr Zelensky will meet Donald Trump on Monday in Washington in a high-stakes attempt to secure a permanent ceasefire and binding security guarantees. The geopolitical backdrop remains tense, with Trump’s comments suggesting Zelensky could end the war “immediately” — framing that complicates the talks.
For markets, the stakes are equally high. Gold, as a classic safe-haven asset, is benefiting from risk aversion. Traders see the fragile peace outlook and ongoing uncertainty as fuel for sustained demand in bullion.
Technical Outlook:
Gold remains highly sensitive to geopolitical developments:
Stability above 3343 supports a bullish move toward 3356, and a break higher could extend gains to 3383 and 3401.
A 1H candle close below 3343 would turn the outlook bearish, with downside targets at 3332, 3320, and potentially 3284.
Pivot: 3343
Support: 3332, 3320, 3285
Resistance: 3356, 3366, 3401

AXIX BANKAxis Bank Ltd. (currently trading at ₹1082) is India’s third-largest private sector bank, offering a full suite of financial services across retail banking, corporate banking, treasury, and wealth management. With over 5,000 branches and 15,000 ATMs, the bank serves more than 30 million customers. It has a strong digital footprint, strategic partnerships, and a growing presence in semi-urban and rural markets.
Axis Bank Ltd. – FY22–FY25 Snapshot
Net Interest Income – ₹33,132 Cr → ₹42,946 Cr → ₹52,120 Cr → ₹58,340 Cr Growth driven by loan book expansion and margin improvement
Net Profit – ₹14,119 Cr → ₹15,037 Cr → ₹20,152 Cr → ₹23,480 Cr Earnings surge from operating leverage and lower credit costs
Operating Performance – Moderate → Strong → Strong → Strong Improved cost-to-income ratio and stable asset quality
Dividend Yield (%) – 0.00% → 0.45% → 0.60% → 0.75% Payouts initiated post sustained profitability
Equity Capital – ₹613.00 Cr (constant) No dilution; stable capital structure
Total Debt (Borrowings) – ₹1.25 Lakh Cr → ₹1.32 Lakh Cr → ₹1.38 Lakh Cr → ₹1.45 Lakh Cr Aligned with deposit growth and treasury operations
Fixed Assets – ₹9,850 Cr → ₹10,210 Cr → ₹10,580 Cr → ₹10,950 Cr Capex focused on branch expansion and digital infrastructure
Institutional Interest & Ownership Trends
Promoter holding is nil; Axis Bank is widely held by FIIs, DIIs, and retail investors. FIIs hold ~45%, with strong participation from global funds focused on Indian financials. Delivery volumes reflect long-term accumulation by pension funds, sovereign wealth funds, and banking sector ETFs.
Business Growth Verdict
Axis Bank is scaling efficiently across retail, SME, and corporate segments Margins remain strong due to CASA mix and digital lending Asset quality has improved with declining GNPA and NNPA ratios Capex supports long-term digital transformation and branch network expansion
Management Con Call
Management highlighted strong traction in unsecured retail loans, credit cards, and SME lending. Digital origination now contributes over 70% of new retail accounts. Axis Mutual Fund and Axis Securities continue to scale as fee income drivers. FY26 outlook includes mid-teen loan growth, stable NIMs, and further improvement in cost ratios. Focus remains on cross-sell, digital onboarding, and expanding rural reach.
Final Investment Verdict
Axis Bank Ltd. offers a high-quality private banking story with strong fundamentals, digital leadership, and diversified growth engines. Its improving profitability, stable asset quality, and expanding retail footprint make it suitable for accumulation by investors seeking exposure to India’s financial services sector. With disciplined execution and rising fee income, Axis Bank remains a durable compounder.

My view on oil is not positive for the next 3 years.In my observation, the last 2 months of the 2nd quarter of the year according to the cycle is the breakout level to determine the trend. Oh, and one more thing, it needs a monthly candle to sink down in the next 2 months to be more consolidated and can be considered a sufficient condition to legitimize this investment idea.

BTC 1H Analysis – Key Triggers Ahead | Day 14💀 Hey , how's it going ? Come over here — Satoshi got something for you !
⏰ We’re analyzing BTC on the 1-hour timeframe timeframe , we can see that Bitcoin is building a range above the $117,000 support level while trading with reduced volume.
👀 After breaking through the $118,000 zone (which acted as the midline of the range), Bitcoin has formed a consolidation just above $117,000. At the moment, it is ranging with a slight upward bias in the short term.
🕯 Trading volume and the number of transactions have decreased due to the weekend/holidays.
⚙️ On the RSI, the key resistance zone is 65.63. A breakout above this level could increase the probability of moving into overbought territory. On the other hand, losing the support zone around 37.82 could trigger selling pressure and push RSI into oversold territory.
🔔 Our alarm zones are set at $119,000 and $117,000. Breaking either of these levels could provide a trading signal. Monitoring price action around these zones will give clearer entries.
💵 Looking at USDT.D , we can see a 1-hour box range structure. It recently broke down from the bottom of the box. Now, the question is whether this decline will continue or if it will return inside the range.
🖥 Summary: Bitcoin is currently consolidating in a range with a slightly upward slope. However, due to the weekend, trading volume has dropped significantly, so any breakout needs confirmation with stronger liquidity.
❤️ Disclaimer : This analysis is purely based on my personal opinion and I only trade if the stated triggers are activated .


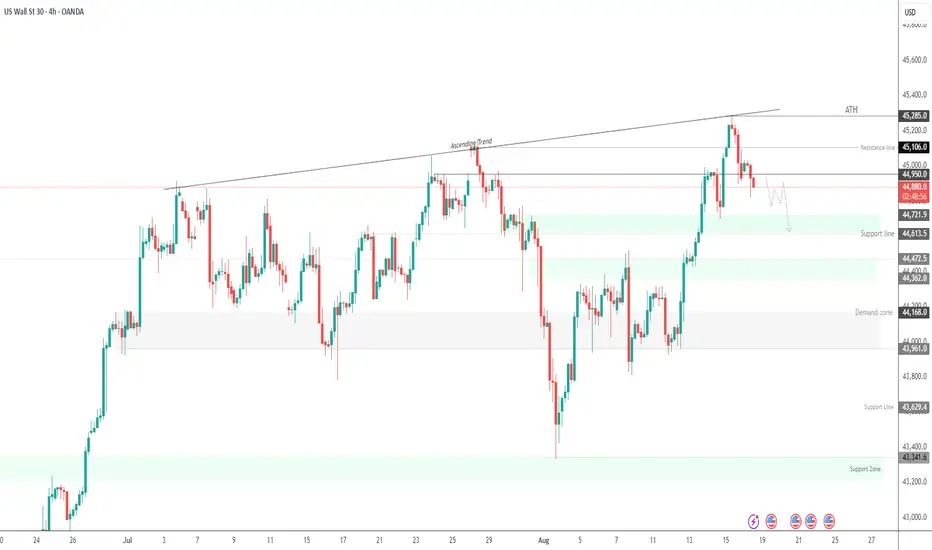
US30 | Geopolitics in Focus – Key Pivot at 44950US30 Overview
Geopolitics dominates before the Fed takes the stage.
Putin’s position remains that Ukraine should cede all territory Russia has occupied — and even areas it has failed to capture in more than three years of fighting. This has been firmly rejected by Zelenskiy and European leaders, who will be alongside him in Washington when he meets Trump later today.
Technical Outlook:
The price holds bearish momentum toward 44720 and 44610 as long as it trades below 44950.
A 4H close above 44950 would shift the bias bullish toward 45100 and 45285.
Support: 44720, 44610, 44470
Resistance: 45100, 45285

Gold (XAU/USD) 15m Chart AnalysisGold is currently holding above the 3,345 support zone, aligned with the 200 EMA (blue line). Price tested this support area and showed a bullish reaction, indicating potential demand.
🔑 Key Levels:
Support: 3,344 – 3,345 zone
Resistance: 3,357
📈 Bias:
If price sustains above the highlighted demand zone, we may see a bullish continuation toward the 3,357 resistance level. The projection suggests a possible pullback before continuing higher.
⚠️ Watch out:
A clean break below 3,344 could invalidate this setup and open the way for further downside.

Wait for pre-meeting guidance, focus on 3343-3330#XAUUSD
The current market focus is mainly on the upcoming talks.🤝 As expected, the news of the meeting between Trump and Putin was leaked over the weekend. 💻We still need to wait and see the news in the next two days to see whether the Russia-Ukraine war issue can be effectively resolved. 💠
If peace talks between the two sides can be effectively facilitated and risk aversion is reduced, gold will remain weak.🐻 Conversely, if the talks fail, a retaliatory bullish rally is highly likely.📈
Last Friday, gold prices fluctuated very narrowly, failing to find a valid trading point. ⚖️The early morning opening at a new low not only effectively allowed short sellers to exit their positions,😝 but also allowed market makers to reap the profits of last week's long traders😩.
Since the short sellers have all taken profits in the early trading session, there must be greedy people and traders seeking revenge in the market who will take over and short sell at low levels,📊 otherwise gold would not have risen so quickly. 📈
So, theoretically speaking, before the talks are concluded, I think the market will definitely eliminate the traders who shorted at the low level this morning.🐂
The overall hourly line is still under pressure at the high resistance line of 3358.💥 We will first see whether it can fall below 3343 in the European session. 🐂Only after it breaks will it test the small support of 3330. Otherwise, the bulls will still have to counterattack at a low position. Today, we will mainly go long at a low level.📈
🚀 BUY 3343-3330
🚀 TP 3355-3365-3370

GBPJPY – Critical Zone Between 199 and 200Last week, I mentioned that I was watching both GBPJPY and EURJPY closely, as a strong drop could be just around the corner.
Given its higher volatility, I chose to open a short on GBPJPY, which I closed Friday with a negligible profit after the pair reversed once more from just under 199.
Despite that, my overall outlook hasn’t changed – in fact, it has been reinforced by yet another failed attempt to conquer the 200 zone.
📌 Trading Plan:
- I’m looking to re-enter short on GBPJPY.
- My initial target remains the 195 zone.
- Confirmation: A daily close under 199 would signal that a top is likely in place.
- Negation: If the market stabilizes above 200, this bearish scenario is off the table.
In other words, GBPJPY is at a critical juncture – either it confirms the top and accelerates lower, or the 200 level finally gives way.
That being said, I’m prepared for the short side. 🚀
Disclosure: I am part of TradeNation's Influencer program and receive a monthly fee for using their TradingView charts in my analyses and educational articles.

PX500 | Fed in Focus as Geopolitics Drive VolatilitySPX500 Overview
Geopolitics dominates before the Fed takes the stage.
Putin’s stance appears to be that Ukraine should give up not only the territory Russia has taken, but also areas it has failed to capture after more than three years of fighting. This has been repeatedly rejected by Zelenskiy and European leaders, who will stand alongside him in Washington when he meets Trump later today.
Technical Outlook:
The price is expected to test 6425. A 1H close below this level would extend the bearish move toward 6389 and 6366.
To resume the bullish trend, the price must close a 4H candle above 6468, opening the way to higher resistance levels.
Support: 6425, 6389, 6366
Resistance: 6468, 6488, 6528

How can the gold market seize real certain opportunities?Gold closed with a bearish doji at a low level on Friday. Gold opened slightly lower on Monday, falling to around 3323 before rising. The wedge pattern is gradually converging, and the overall pattern is top oscillation. In the 4H cycle, consecutive big suns broke through and stabilized on the middle track, and the short-term trend turned from weak to strong, but the current pressure of 3360-3375 is not broken, and it is still in a downward correction channel. In terms of operation, the rebound can be shorted at this position, and the support below should pay attention to the 3335-3320 area. If it is not broken, consider taking a long position.
Gold operation suggestion: short around 3360-3375, target 3345-3335.

Bitcoin - Will Bitcoin Continue to Rise?!Bitcoin is below the EMA50 and EMA200 on the four-hour timeframe and is in its long-term ascending channel. If it moves upwards, we can look for a short-term position to sell Bitcoin from the specified supply zone.
It should be noted that there is a possibility of heavy fluctuations and shadows due to the movement of whales in the market and compliance with capital management in the cryptocurrency market will be more important. If the downward trend continues, we can buy within the demand range.
Momentum in the digital assets market continues to accelerate, with Ethereum leading the charge. The cryptocurrency has surged from $1,500 in April to $4,300, marking its highest level since December 2021 and standing only 12.5% below its all-time high of $4,800. Historically, Ethereum has served as a leading indicator for the broader altcoin market, and its recent strength has fueled speculative activity across other higher-risk assets.
This capital rotation is also reflected in the Bitcoin Dominance index, which measures Bitcoin’s share of the overall crypto market. Over the past two months, Bitcoin’s dominance has fallen from 65% to 59%, signaling a continued flow of capital into riskier assets.
Last week, Scott Bessent, U.S. Treasury Secretary, announced that Bitcoin seized by the federal government would form the core of the nation’s strategic Bitcoin reserves, established under President Trump’s March executive order. He further noted that the Treasury is exploring budget-neutral options to acquire additional Bitcoin, aligning with the administration’s commitment to making the United States the “world’s Bitcoin superpower.” He clarified that no new cryptocurrencies would be purchased, as the reserves will rely solely on confiscated assets.
Meanwhile, the balance held by Accumulator wallets—addresses that exclusively buy Bitcoin and never sell—has reached 308,150 BTC, the highest level ever recorded. Continued accumulation by these wallets implies a tightening supply in circulation and is often seen as the beginning of a new bullish phase in the market.
In parallel, Bit Digital, a Nasdaq-listed company, reported a net profit in Q2 of this year despite a decline in overall revenue. This shift came as the company focused on its new treasury and Ethereum-based staking strategy.
According to its quarterly report, Bit Digital generated $25.7 million in total revenue during the period, representing an 11.7% year-over-year decline. The company attributed the decrease primarily to reduced income from digital asset mining, as operations shifted toward treasury and Ethereum staking initiatives, though part of the drop was offset by growth in other business segments.
During the same quarter, Bit Digital posted $14.9 million in net profit, equal to $0.07 per share, compared to a net loss of $12 million in the same period last year. CEO Sam Tabar described the quarter as “the beginning of the company’s transformation into a specialized Ethereum treasury and staking platform.” In June, Bit Digital formally announced its Ethereum strategy and began the gradual phase-out of its Bitcoin mining operations.
According to Yahoo Finance data, Bit Digital’s stock fell 0.63% on Thursday to $3.19. However, despite the daily decline, the stock has risen 8.1% over the past five days and is up 8.9% year-to-date.

NAS100 - Stock Market Waiting for Jackson Hole Leak!The index is above the EMA200 and EMA50 on the 4-hour timeframe and is trading in its ascending channel. If the index corrects downwards towards the specified demand zones, you can buy Nasdaq with appropriate reward and risk.
According to a recent report from JPMorgan, the new U.S. tariffs could have significant repercussions for the American economy. The bank projects that these tariffs may reduce U.S. GDP by as much as 1% while simultaneously pushing inflation higher by up to 1.5%.
This year’s tariff hikes represent the largest increase since World War II, with the effective tariff rate rising to nearly 18%. With the expiration of tariff exemptions on imports under $800, consumer goods prices are expected to climb further.
JPMorgan has warned that both consumers and businesses may struggle to absorb these additional costs, raising the risk of stagflation. Meanwhile, monthly inflation has remained within the 0.3% to 0.5% range, suggesting that the Fed’s preferred inflation gauge could rise toward 3% to 3.5%.
As U.S. tariffs have surged to their highest levels in decades, revenues from these duties hit a record $28 billion in July. According to estimates by the Tax Foundation, tariff revenues could total about $2.2 trillion by the end of this decade. However, this is also expected to trim GDP by around 0.9%.
Research conducted by Yale University indicates that tariff policies could reduce annual household income by approximately $2,400, since part of these tariff costs are passed on to consumers by companies.
At the same time, Berkshire Hathaway, led by Warren Buffett, has made notable adjustments to its investment portfolio:
• It purchased 6.6 million shares of steelmaker Nucor.
• It added 5 million shares of healthcare insurer UnitedHealth.
• It fully divested its holdings in T-Mobile US.
• It trimmed its stake in Apple by 6.7%, reducing its position to 280 million shares.
Meanwhile, Goldman Sachs reiterated its outlook that the Federal Reserve will cut interest rates three times before the end of 2025. The projected reductions include three 25-basis-point cuts in September, October, and December. Additionally, two further cuts are expected in 2026, bringing the terminal rate down to the 3%–3.25% range. Markets have already increased their bets on a September rate cut. Recent weakness in inflation and employment data has paved the way for such accommodative policy measures.
Federal Reserve Chair Jerome Powell is scheduled to deliver a speech at the Jackson Hole Symposium on August 22, 2025—an event that has become an unofficial policy-setting platform. Analysts at Morgan Stanley expect Powell will attempt to temper market expectations for a 50-basis-point cut in September. Given the political pressures and mixed economic signals, Powell may only endorse a 25-basis-point cut, or potentially push back against easing altogether.
Any of these outcomes could disappoint markets, especially if Powell fails to deliver clear guidance. His speech may therefore play a decisive role in shaping U.S. monetary policy for the remainder of the year and could drive heightened volatility across markets.
Although this week’s economic calendar features several important housing and manufacturing reports, the spotlight will remain firmly on the Fed. On Tuesday, July housing starts and building permits data will be released. Wednesday brings the FOMC’s July meeting minutes, speeches from key Fed officials Waller and Bostic, and the official kickoff of the annual Jackson Hole Symposium.
On Thursday, markets will digest a packed set of data, including the Philadelphia Fed manufacturing index, weekly jobless claims, the preliminary August S&P Global PMI, and July existing home sales.
The highlight of the week will be Friday, when all eyes turn to Jerome Powell. His annual Jackson Hole speech is expected to provide fresh clues about the Fed’s policy trajectory—guidance that could strongly influence market direction in the weeks ahead.

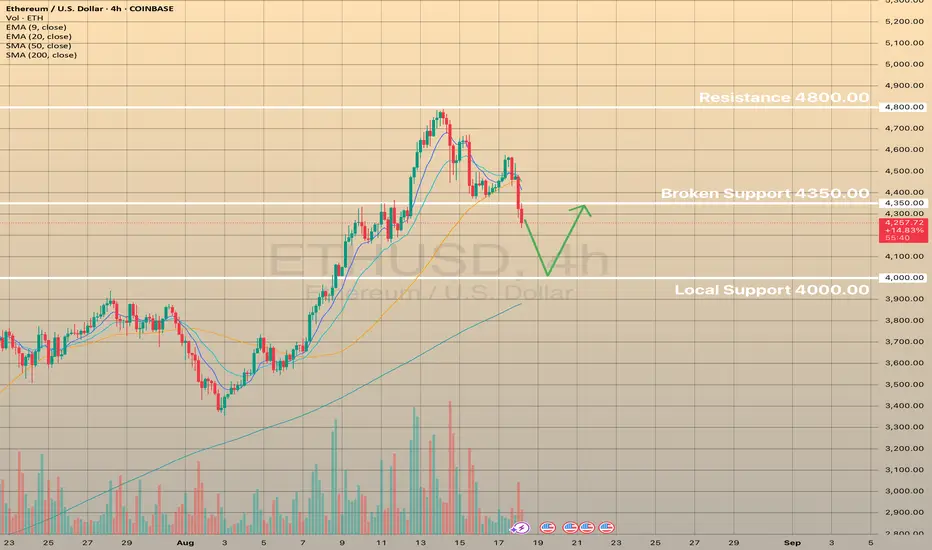
ETHUSD falls on fears of hawkish key rate policyETHUSD falls on fears of hawkish key rate policy
Ether fell by 4% to $4,296.50 on August 18, pressured by last week’s higher-than-expected U.S. macro data. The drop reflects reduced investor confidence amid elevated inflation, with July’s PPI at 3.3% year-over-year, lowering expectations for a Fed rate cut. Spot ether ETF flows dipped modestly, but institutional engagement remains strong, with funds rotating to lower-cost products like BlackRock’s IBIT. Analysts see the Fed’s Jackson Hole Symposium and August 21 jobless claims as key upcoming factors.
ETHUSD broke below the support of 4,350.00. The price is heading towards local support of 4,000.00 in order to retest this crucial level with possible rebound from SMA200 on 4-h chart.
BTCUSD falls on inflation fearsBTCUSD falls on inflation fears
Bitcoin dropped by 2% on August 18 to 115,500.00, hitting a low of 115,040. This is a 7.5% drop from its all-time high of $124,350.00 The drop came after hotter-than-expected US inflation data, with the July PPI at 3.3%. This reduced hopes for a Fed rate cut in September. The decision by US Treasury Secretary Scott Bessent to not add Bitcoin to strategic reserves also dented confidence. Support levels are at 115.000.00 and 112,500.00. A break below these levels could risk a drop to 110,000.00. The Fed's Jackson Hole Symposium and the August 21st jobless claims report will be the major drivers for this week.
High chances that the asset will rebound from 115,000.00 support level and support trendline towards 120,000.00 at least. The asset is still in a bullish trend. Additionally, there are still not so many institutional investors in the asset, which gives a potential for a long-term bullish market in the future.


BTCUSD:The meeting will likely impact further declines.Amidst uncertain news, BTCUSD is less favored than XAUUSD. After the Asian market opened, BTCUSD experienced a significant drop, exceeding 3000p. Assuming the meeting has not concluded, uncertainty will cause BTCUSD to fall further. Short-term short selling is likely to continue.
