SPX: Trend Analysis + Key Points to Watch From Here.• The SPX is trading inside an Ascending Channel in the 1h chart. Today it is losing momentum, indicating that it could seek the bottom of this channel;
• Yesterday, the index failed in breaking the 4k, which is its most important key point. By breaking the 4k, we would see a bullish pivot point in the 1h chart, indicating that we could seek the higher line of this channel;
• If it loses this channel downwards, then it is very likely that it’ll seek its support at 3,808, which we mentioned in our previous analysis (the link to it is below this post, as usual).
• The problem is that in the daily chart, the trend is still bearish. There’s a purple trend line connecting the previous tops, and it seems it worked again yesterday;
• As long as the index remains under this purple line, the SPX won’t do any meaningful bullish reversal pattern;
• What’s more, there’s no clear bullish reversal structure in the daily chart yet. Yes, there’s a bottom at 3,909, which is higher than the previous one at 3,808, but without a higher high, the trend will remain bearish;
• Therefore, it is very important to watch how the index is going to react now that it just hit its major resistance in the daily chart, and if it’ll break its pivot point in the 1h chart;
• This is a defining moment for the SPX, and I’ll keep you updated on this, as usual.
Remember to follow me to keep in touch with my daily analysis!
Trendlineanalysis

XAUUSD UPDATE: WATCHING THE BEARISH PIN BAR IN THE H4Hello there again, I'm here to shed more light on this pair, XAUUSD, It's like someone is getting me wrong here! In my past analysis, I told you that this is a strong bullish trend and that you should be extra careful selling this pair. Meanwhile, we have already seen a bearish pin bar formed at the key psych level, meaning there could be a nice opportunity for the bears to ride the market to the downside, but they should be extremely careful, as the Gold could head back up. But, currently, the sell signal is still intact, most especially for short-term traders.
If you are selling, make sure you set your take profit close to the entry price to take advantage of the short bearish move of the market.

SPX: Dangerous Top Sign Under a Major Resistance Level.• The SPX did a top sign yesterday, just after it hit its resistance at the purple trend line, which is connecting the previous tops;
• What’s more, the index lost the 21 ema. It seems Futures are stabilizing, but the situation is still problematic;
• In theory, if we don’t see a very strong bullish reaction, as soon as possible, the index would just keep correcting to the next support level, the 3,808;
• There was a gap (yellow square), which was filled yesterday, making this a possible Exhaustion Gap after the quick rally that started on Mar 13;
• So far, we don’t see any meaningful bullish reaction indicating that it will reverse, or at least reject the bearish sentiment;
• In order to avoid a bearish continuation, the index would have to react and reject yesterday’s candlestick, breaking the purple trend line in process. It all depends on how it’ll react today. I’ll keep you updated on this.
Remember to follow me to keep in touch with my daily analysis!

Follow the trendJust make sure to follow the trend. With a weekly that is bullish, and a visible daily trend-line, the best thing to do is wait for price to come to that trend-line. A good trade if we see rejection occurring on a lower time-frame.

Confluence on GBPCHFWeekly bearish, and a formation of SHS on daily TF. Simple!!! If and only if price is going to break and come for a retest to the neckline of the pattern then a good short opportunity presents itself
This is not a financial advice, make sure to make good use of risk management!!!

What will a major (Daily) look like!?Weekly, Daily bearish, daily trendline. On the 4hoursm there is an impulse move. And it is normal that after an impulse there is a retracement. there is a confluence of the 78.6 fibs and trendline. If price can retrace to that area that will be a trade to take.


NZD/CHF analysis H4Price touched the trendline multiple times, will it continue downwards? Or will there be a change in direction?

GBPUSD :Moving Average Trading strategyOANDA:GBPUSD
Gbpusd is trading in Bullish pattern now
After breakout from channel down , Market retested the channel line
Now market is making higher high
breakout of current resistance level will make it more bullish
Our target will be buying dip's
Target 1.2285
❤️ Please, support my work with follow ,share and like, thank you! ❤️

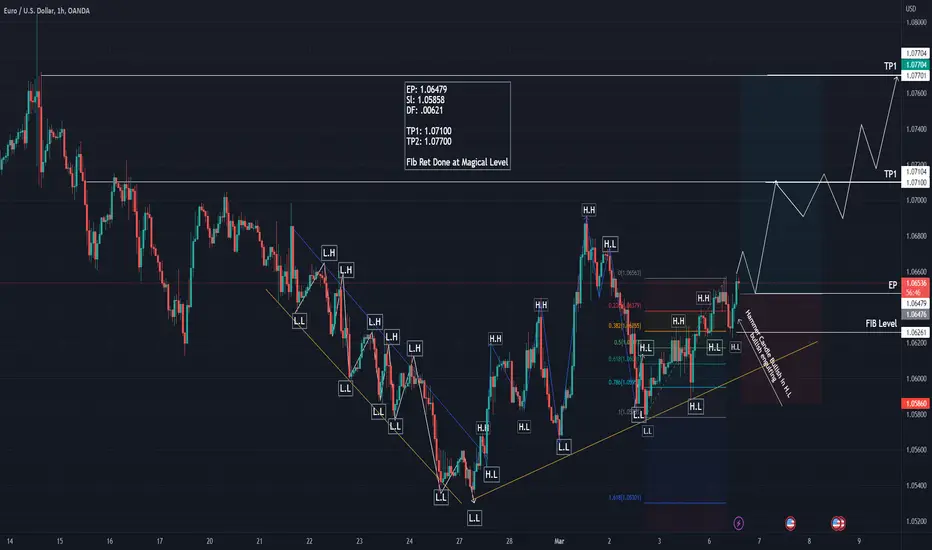
EUR USD Bullish Trend in 1 HR TF OANDA:EURUSD In the 1 Hr TF, we see the Bullish Trend starting. The Hammer and Bullish engulfing candle shows on charts that is good sign for go Upside movement. Or break the previous H.H more confirmation to the Upside.
AUD/USD BullishWe can see the intersection between a Dynamic support trendline and the fall trendline, this level its very good entry to take a good deal ,good luck

GBPUSD Long Term Analysis (Daily Chart)Technical Analysis Summary
GBP/USD
TREND ANALYSIS
We have 2 Downtrend in red color (Long Term and Short Term)
Be careful trends need to be modified when broken to the new peaks(Downtrend) and lows (Uptrend).
FUTURE PREDICTIONS
We have many resistance and support levels that I have mentioned above.
I use thickness as an indicator of strength of levels (ONLY FOR VISUALS).
Daily Level (In White) We have been respecting if we broken we will have a big drop downward toward the support levels.
White Levels are stop losses or levels and trends that were respected from the past.
Good luck everyone, stay safe!
If you need help don't hesitate to send me a message or comment
If you find this content beneficial please don't forget to LIKE and FOLLOW
Trading Involves High Risk
Not Financial Advice
Exercise Proper Risk Management

My outlook on GBPUSDPrice is in a ranging market and currently at the resistance zone, also creating a falling wedge pattern. Looking to go long after break and retest of trendline and that minor zone.

BTC / USDT - WeeklyParallel Channels, Elliott Wave Count & Cypher Harmonic Pattern in BTC/USDT Weekly Chart.


GBPUSD Long Term Analysis (Daily Chart)Technical Analysis Summary
GBP/USD
TREND ANALYSIS
We have 2 Downtrend in red color (Long Term and Short Term)
Be careful trends need to be modified when broken to the new peaks(Downtrend) and lows (Uptrend).
FUTURE PREDICTIONS
We have many resistance and support levels that I have mentioned above.
I use thickness as an indicator of strength of levels (ONLY FOR VISUALS).
White Levels are stop losses or levels and trends that were respected from the past.
Good luck everyone, stay safe!
If you need help don't hesitate to send me a message or comment
If you find this content beneficial please don't forget to LIKE and FOLLOW
Trading Involves High Risk
Not Financial Advice
Exercise Proper Risk Management

Technical Analysis on the EUR/USD and what to look forward toFX:EURUSD
We take a look at what the EUR/USD may do going forward and how the current short positions unfolded.
We have made a nice and steady decline into the main Pivotal zone and the question now is, do we stay short or watch for buyers to come back into the market and swing momentum back to the upside. In this Video, I describe the thought process and outlook on what price action may be showing us next.
Hope you enjoy the video and analysis.

BTCUSDT - Pennant and Possible Flag4hr chart. UTC+1
Using Fractiles to get lows and highs.
Fib fan drawn from low Wed 18 Jan 17:00 to high Thurs 16 Jan 17:00. Levels seem to have confluence with price action.
Support lines building up to initial Pennant.
- Draw a trend line from low Sat 11 Feb 17:00 to low 17 Feb 01:00 and change setting to Extend the right line.
- Draw a trend line from high Thurs 16 Feb 17:00 to high Fri 17 Feb 21:00 and change setting to Extend the right line.
The intersecting point create a Pennant formation which can be seen highlighted. 24,400 seems like a hidden daily which interests me as it has not been tested much. It seems the initial breakout was a fakeout. I Interesting to see if the price can breakout again.
Yellow line above for reference is vWap. In case you are wondering about the yellow line.
Note: * When in an uptrend, above 0.382 Fib is bullish.

📍 The 5 Step Process1️⃣ MARKET STRUCTURE
The market structure has a significant impact on the formation of prices, dissemination of information, and execution of transactions. In the context of stock trading, market structure can also refer to the pattern of price movements in a downtrend, characterized by lower highs and lower lows. This pattern indicates that prices are consistently decreasing over time and that selling pressure is outweighing buying pressure. The market structure in a downtrend can provide important information to traders and investors about the overall sentiment in the market and can inform their decision-making process.
2️⃣ PSYCHOLOGICAL LEVEL
A psychological price level in trading refers to a price point that is believed to have a significant impact on market participants' behavior and decision making. These price levels are usually round numbers, such as $50 or $100, or important milestones, such as all-time highs or lows, and are often used as reference points in trading. Market participants often view psychological price levels as significant barriers that need to be breached or defended in order to signal a change in market sentiment.
3️⃣ FIBONACCI
Fibonacci retracement is a technical analysis tool used in stock trading to identify potential levels of support and resistance. It is based on the idea that prices will tend to retrace a predictable portion of a move, after which they will continue to move in the original direction. The tool is used by drawing a trendline between two extreme points and then dividing the vertical distance by the key Fibonacci ratios of 23.6%, 38.2%, 50%, 61.8% and 100%.
4️⃣ TRENDLINE
A trendline in trading is a straight line drawn on a price chart to identify a current trend in the market. The trendline is drawn by connecting two or more price points and is used to identify the direction of the trend, either up, down, or sideways. If the trendline is sloping upwards, it is considered an uptrend, and if it is sloping downwards, it is considered a downtrend.
5️⃣ CANDLESTICK
A twizzer bottom is formed when a long green candle is followed by a red candle that closes below the midpoint of the first candle. This pattern indicates that the buying pressure that was present in the first candle is being replaced by selling pressure, and suggests a potential reversal from an uptrend to a downtrend. It's important to note that a twizzer candlestick pattern is just one piece of information and should not be relied upon solely when making trading decisions. It is often used in conjunction with other technical analysis tools and indicators to form a more comprehensive view of market conditions.
👤 @AlgoBuddy
📅 Daily Ideas about market update, psychology & indicators
❤️ If you appreciate our work, please like, comment and follow ❤️


YASSINEIOS GOLD M15Please respect the analysis. Today is a beautiful day, a golden opportunity. Just a little patience and diligence, we will be the best Happy holiday Any questions about the transaction are welcome
