LINKUSDT map for a potential downtrendThat's my ultimate speculative map for a potential downtrend anatomy for LINKUSDT. We have a reversal Head and Shoulders top in formation, which a pullback to neckline can occurs in a retest of broken dynamic trendline. If the price remains bearish, a test of the volume point of control POC can be expected. Then a potential downtrend in a parallel channel formation can be expected w/ lower highs retesting the dynamic trendline / resistance. The final target is the D point from prior Butterfly pattern.
Trendlineanalysis

$BNB - Will it Break the Trendline ?Hello my Fellow TraderZ,
Most of the #ALTS presently coming to the Dynamic Trendline RESISTANCE and one such is $BNB, native token of BINANCE exchange.
As you can see $BNB has approached the Trendline Resistance Zone for the 5th time. On previous occassions it has rejected from this Resistance Zone. Will this time be different? May or may not be.
Currently holding the $260 Support Zone incredibly well on DTF. I'm expecting here a move upside to the $300 or $330 in the short term if Breakout occurrs.
I'm little bit inclined towards breakout as #bnb is making its ALL TIME HIGH against Bitcoin, see below :
So we may see that upside move but again only if breaks and gives a Daily candle close above the Trendline.
Interesting to see how it acts further. Till then Happy Trading FAM.
CHEERS!!!

⭕️SELL AUDCAD at the best place and time 😉 ❗️🔰You can see the analysis of the Australian dollar to the Canadian dollar in the 30-minute time frame (AUDCAD_ 30min)🔍💣
💥Taking into account the price drop from the SUPPLY zone, if the price returns to this zone (supply zone), we can expect the price drop to the upward trend line (black🖤 color)🔻If the black upward trend line🖤 is broken and then the price pullback❗ to it, we can expect another collapse of the price to the specified DEMAND zone🔻🔻🧐
Do you think this analysis can be profitable❓
I hope the analysis was useful for you🤍🌹
📌Please introduce the channel to your friends 🙏🏻
__________📈TRADER STREET📉___________

ETH / USDT 4HChart - Targets And StopLossHello everyone, let's take a look at the 4H ETH to USDT chart as you can see the price is moving above the local downtrend channel.
Let's start by setting goals for the near future that we can consider:
T1 = $ 1,351
T2 = $ 1,368
T3 = $ 1,382
T4 = $ 1,396
and
T5 = $ 1,416
Now let's move on to the stop loss in case of further market declines:
SL1 = $ 1,304
SL2 = $ 1,284
SL3 = $ 1267
SL4 = $ 1,251
and
SL5 = $ 1,227
Looking at the CHOP indicator, we can see that in the 4H range some energy was used, while the MACD indicator shows a local upward trend.

BTCUSDT pullback to triangle trendlineThere's no reason for bullish bias. The price action shows an engulfing bearish after a pullback to triangle upper trendline, healthy 30% retrace and retest. Supports broken. Price below daily volume point of control -rejected from POC. Expecting lower lows aiming 14.6% as seen on chart. 17K is possible in a next swing downward. Plus hidden bearish sign from Chaikin Oscillator. Fibonacci retracement applied w/ 88.6% and 14.6% key levels. Bearish 2-D swing to complete the major Head and Shoulders correction @ all retracement expected.

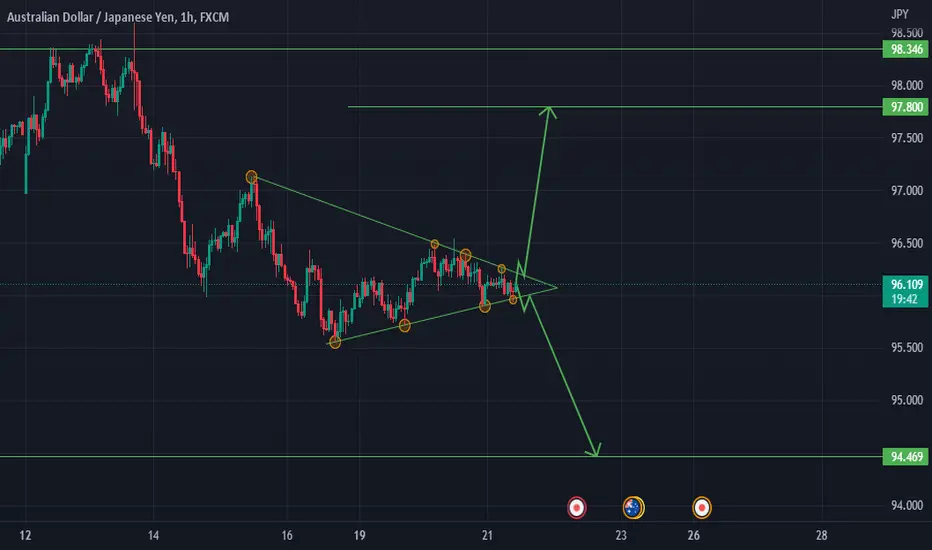
AUDJPY SYMMETRICAL PATTERN...A symmetrical triangle pattern has been formed on the AUDJPY...
breakout will give a good move on it...
ETHEREUM IS GETTING READY FOR A BULLISH MOVE...A triangle pattern has been formed on ETHUSDT...
breakout can give a good movement in it...
according to my view it will be good if it gives a upside breakout...
if it gives a downside breakout then I will leave it...

USOIL IS READY TO SHOOT UP...ascending triangle pattern has been formed on crude oil..
a good bullish move can be caught on it...

$ETHEREUM - Do or Die !!Hello my Fellow TraderZ,
Yesterday we had a big event in the world of #CRYPTO. Say the Queen of #Crypto - $ETHEREUM was shifted from the Proof-of-Work to Proof-of-Stake. This is itself a big news for $ETH as in future this will make $ETH more scarce.
Many were eyeing on the value Post Merge and it was expected that price would see a sharp rise or atleast lead to the previous local High, but nothing happened rather price decided to visit South.
Now price is near the Confluence Zone(Yellow Circle) and I m expecting a bounce here. Funding Rate is decreasing which means more and more late SHORTS are opened which could be #SQUEEZED

Reversion? That's just meanThe rising trendline from June's lows is the likely target for this decline. No idea what happens there, and I won't be buying it on the first touch.
Knives should be picked up off the floor, not caught!
If this is helpful to you, let me know in the comments and follow to get charts immediately.

AUDCHF 30 MIN PROJECTIONAUDCHF Has Taken Out The Multiple Low Liquidity , And it has A huge Trendline Liquidity Pool Above, so that's why we are expecting The Market to Go long From Here

Incoming $XTZ BreakoutAs we can see on 1H TF, both RSI and STDev are converging which suggest the dip might be in. Furthermore, its trading ranges maintained inside an ascending channel which suggest a bullish continuation. If breakout from $2 resistance zone takes place, we could possibly see a rally up to 161% fib retracement.

EURUSD | Interested AreaEURUSD in a down channel.
I expect that the price will be touch 1.04000 or D areas (fresh supply zone and resistance trendline). But the question is, where will the price start from?
Here are some interesting areas that I have marked.
A = 0.99894 - 1.00092
B = 1.01192 - 1.01434
C = 1.02359 - 1.02788

Buy Rune/USDTHello, Rune/Usdt is hovering Near Trend Line Support.You Can buy it And Make Profit. Also it is Fundamentally Good Coin 😇

TRENDLINE TRADING | Advanced trading lesson Hello traders 👋
Today im sharing my trading strategy with trendlines. It's my first education post, so maybe a lot of mistakes. Please don't take it the wrong way, thank you.
Let's talk about lesson
What are Trend lines?
Trend lines are diagonal lines that are drawn on charts in the financial markets trading. Trend lines are used to highlight , visualize , and make price action easier to analyze on different instruments and assets in the financial market.
How to trade And Use Trend Lines + basic supports.
1. Wait for touch ⌛
When drawing a trendline, the first thing price is check the three times or more. If the price is not checked three times or less, can't draw trendline.
2. Draw ✏️
To draw a trend line, you must choose a time frame. I'm use always bigger than 1 hour timeframe . This is because you want to find the price action for a longer period and not just some light movement.
3. The Basics of Support and Resistance + key levels ✔️
When trading with trend lines, the concept is applied in order to maximise the chances of winning trades.
4. Looking for entry + risk management 💰
Always wait for confirm example; trend line break + price making lower low + pullback + add indicators
🤲 If you like my strategy, Please like and comments. 🤲
Thank you!

HOW TO USE TRENDLINE FOR ENTRYIn this video i showed you how to use Trendline for entry in the easiest and simple way.
What do you think about this?
I would like to hear your view, drop your comment.

XTIUSD | BuyEntry parameter ;
1. Fibo 61.8
2. Right Shoulder of Inverted HnS (Expected)
3. Demand Area of Rally Base Rally
4. OB H4
Entry Buy = 93.00
SL = 91.15
TP1 = 102.50
TP2 = 108.50
RR1 = 1 : 5.14
RR2 = 1 : 8.38

ETHBTCThe price is out of the diagonal pattern, it seems to have a downward range in the range of 0.055110. When this range becomes engulfed, the high MPL range becomes valuable.
It should be seen that the price reacts in the reverse motion on the FTB range (significant range) or on the MPL range.

OGNUSDTHi dear friends
The price has been very nice in its movement, respecting the previous ranges, and until the orange uptrend line is broken to the bottom, I have no mentality for a downtrend.
In my opinion, there is a high possibility of forming an upward trend from the $0.2458 or $0.2348 price range.
The yellow range ($0.3454) is not so valid and probably there are no special orders in this range!!!
If the uptrend line doesn't break down, the longer term downtrend line is more likely to break, isn't it!?!?

CVS Descending Channel on Weekly Chart
The "Decending Channel" pattern was identified on the weekly chart.
A "Double Bottom" pattern was identified on the daily timeframe, however, price failed to go higher. A closer look at recent price action and we have confirmation of resistance becoming support (see level 93.62). Though this is true, it is best to wait for a break of structure before placing a trade to the upside.
On a final note, the 21 MA crossed up the 9MA on Friday, July 8, 2022. Also, the RSI and volume indicator made higher lows and higher highs on the same timeframe.
Personally, I will enter a swing position lightly at the break of the trendline. I will also consider a secondary play action to include a break above 95 or 96.
Thanks for reading,
MrALtrades00

XAG/USD TECHNICAL ANALYSISOn the monthly and weekly analysis of silver, you can see the price has formed a double top pattern and broke the neckline. I expect the price to decline back to the area where covid started and that will be in confluence with the target of the double top pattern which is the 14.20 area unless any unpredictable events occur in the time being. This is a medium-term analysis so keep in mind prices can move up and down in the short term, rely on a lower time frame analysis for better entry prices.

Gbpusd trendlineGbpusd h1 trendline + support and resistance.if break a bearishline then upside move.
