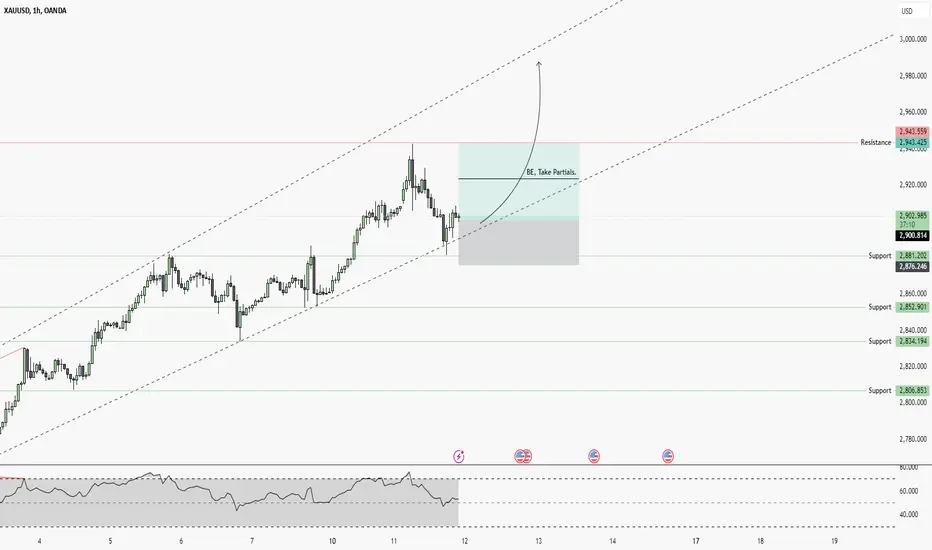
XAUUSD H1: What is happening to GOLD?Technical analysis:
The price line is still showing a continued uptrend, important levels are broken and ready for a new ETH GOLD peak! 2 important price zones in the current uptrend are 2934, 2942.
Gold investors all see that gold has a strong upward trend, reaching 2940 USD/oz from October 2023 to present, surpassing the resistance of 2000 USD, showing a strong upward trend. However, if we consider the movements, gold has increased 4 times per week and there is a high possibility that there will be an adjustment in this sensitive area.
If we consider the cycle, gold in the monthly frame is still in the same upward phase as the quarterly frame, but currently we see that gold has increased for 27 months, corresponding to enough time for a monthly increase phase.
Fundamental Analysis
Gold prices were flat in the first session of the week as investors awaited further details on US President Donald Trump's tariff plans, which could escalate global trade tensions.
Senior Trump administration officials will begin peace talks with Russia and Ukraine in Saudi Arabia in the coming days, which is news that many investors are interested in. Gold has been seen as a safe haven asset during the recent period when geopolitical tensions have escalated.
Trendlineanalysis

GBP/USD: Selling into the reboundThe setup is similar in EUR/USD & GBP/USD - because of the dollar in both major pairs!
The GBP price is testing the broken uptrend line on the weekly- and could break above it.
On the daily chart, a downtrend line has already broken and so has critical resistance at 1.25, suggesting a break above the weekly uptrend line
Should the breakout follow-through it faces resistance at 1.28 from the December high and 30 week (150 day) moving average.
However, should the breakout fail - it sets up a likely continuation of the longer term downtrend.

Gold - Trend continuation after deep correctionParallel Channel: A clear upward-trending channel indicating long-term bullish movement.
Consolidation Pattern: A triangular consolidation phase before a breakout.
Strong Support Level: Marked around 2,861.843, serving as a key price level.
Price Projections: Two significant measured moves showing price increases of 14.10% and 12.27%, with the latest target reaching approximately 3,037.055.
Current Price Action: The price is around 2,882.482, experiencing a slight pullback (-1.57%).
Key Elements of the Chart:
1. Overall Trend: Bullish Momentum
The chart showcases an upward trend in gold prices over the past several months.
A parallel ascending channel is drawn, marking higher highs and higher lows, indicating a sustained bullish trajectory.
2. Parallel Channel Formation
A parallel channel (black trendlines) has been plotted, highlighting a structured uptrend.
The price has consistently moved within this channel, bouncing off support and resistance levels.
3. Consolidation & Breakout Phase
A green triangular pattern is visible in the middle section of the chart.
This pattern represents a period of price consolidation, where gold traded in a tightening range before a breakout.
After breaking out of this consolidation phase, the price resumed its uptrend, confirming a bullish breakout.
4. Support and Resistance Levels
A strong support level is identified at 2,861.843, providing a key price floor.
The price has recently retraced and is testing this support zone around 2,882.482.
Resistance lies near the upper boundary of the parallel channel, with a target projection of 3,037.055.
5. Measured Price Moves (Projection Targets)
The chart includes two price projections using vertical arrows:
First measured move: A rally of 333.699 points (14.10%), suggesting a significant bullish leg.
Second measured move: Another 331.092 points (12.27%), confirming continued bullish strength.
The next target price level is around 3,037.055 USD, indicating further upside potential.
6. Current Market Conditions
The current price is around 2,882.482, reflecting a -1.57% daily decline.
The recent pullback suggests either a minor correction or a potential support test before the next leg upward.
Technical Summary:
Trend: Strong bullish uptrend within a well-defined parallel channel.
Support Level: 2,861.843 (marked as a strong area of buying interest).
Resistance Level: Around 3,037.055.
Breakout Confirmation: After a consolidation phase, gold has resumed its uptrend.
Market Outlook: The chart indicates the potential for further upside, but short-term corrections may occur.
The price remains within the parallel channel, gold could continue its upward trajectory, with 3,037.055 USD as the next key resistance level. However, if the support level (2,861.843) fails, a deeper correction may follow.

XAUUSD - Technical Analysis [Long Setup]🔹 XAUUSD Analysis on 1H chart
- The current Trend is BULLISH
- There is no divergences
- Continuation pattern is present which is bullish flag
🔹 Trade Plan For 1HR
- Entry Level = 20386.3
- Stop Loss = 20312.7
- TP1 = 20458.6
🔹 Risk Management
- First TP is 1:1
- Second TP 1:2
- BE @ TP1
🔹 How to Take Trade?
- Only risk 1% of your portfolio
Like and subscribe to never miss a new idea! ✌🏼
BTCUSD: Short for Delta-Neutrality after buying Spot @ Range-LowLike i mentioned in my previous analysis, BTCUSD is in a range and it might be ignored by the majority that there's no clear knowledge of the range spread. Noone knows, me included.
I just stick to my plan. Check my previous analysis if you want to know the reasons for this idea. Now it's more concrete and it's still worth a try, but if you are a retail trader, you should ignore it because of the leverage being used as well as the lack of experience with delta-neutral trading.
Also it is completely different from a typical HODL- or DCA-strategy. Trend-Followers and Breakout-Traders in general should wait for a more directional BIAS elsewhere because my analysis and trade idea results in a non-directional BIAS.

GOLD DAILY CHART ANALYSIS MID/LONG TERM UPDATEGOLD Daily Chart Update
Hello Everyone,
Here’s the latest update on the GOLD daily chart we’ve been closely monitoring and trading. Below is a breakdown of recent movements and what’s next:
Previous Chart Review
* Key Resistance: We identified 2,790 as a critical resistance level and anticipated a potential reversal.
* Buy Signal: Recommended waiting for EMA5 to cross and hold above the ENTRY LEVEL (2,744) as a signal for a bullish move toward TP1 (2,807).
* Dynamic Support: Highlighted the FVG zone (2,720–2,740) as a key support area.
Outcome:
* EMA5 crossed above KEY LEVEL (2,744).
* Resistance at 2,790 was broken.
* TP1 (2,807) was successfully achieved, confirming the accuracy of our analysis.
What’s Next for GOLD?
* Candle Behavior: The daily candle didn’t close above TP1, suggesting a short-term reversal may occur.
Key Levels:
* Support: Strong support likely from the FVG zone and Gold Turn Levels (2,744 and 2,686).
* Downside Risks: If EMA5 crosses and locks below 2,744, the target shifts toward 2,686.
* Bullish Path: A bounce from support could retest TP1 (2,807) and further extend to TP2 (2,870.8) and TP3 (2,933.93).
Recommendations
Short-Term Trades:
* Use smaller timeframes (1H, 4H) to capitalize on dips at the Gold Turn Levels for 30–40 pips per trade.
* Focus on shorter positions in this range-bound market to avoid getting caught in volatility.
Long-Term Bias:
* We remain bullish and view pullbacks as opportunities to accumulate.
* Buying dips from our marked levels enables us to manage swings safely, rather than chasing tops.
Final Note:
Trade confidently and safely. Our precise analysis ensures you’re equipped to navigate the market effectively. Stay tuned for daily updates and insights across all timeframes.
Best regards,
The Quantum Trading Mastery

XAUUSD NEW ATH (WILL IT CONTINUE TO MAKE NEW HIGHS?)Gold market is now stuck in no trade zone
2814-2830 we mark our support and resistance zone over here and wait for any candle to break and close above or below our rage
if it break through our range then we target previous 3 supports as our Tps
so Tp1= 2794.96
TP2 = 2786.77
TP3= 2774.34
And if breaks through our resistance zone which is also new ATH then we can mark our new ATH by follow trend line
Tp1= 2840
Tp2= 2850
BEST OF LUCK!

NAS100USD: Bearish Continuation Likely After Gap FillGreetings Traders,
In today’s analysis on NAS100USD, we observe that the market remains bearish overall, and our focus is on taking advantage of selling opportunities in line with this prevailing trend.
Market Context:
Gap Fill Complete:
The week began with a significant downside gap, creating a price inefficiency. The market has since retraced upward to fill this gap, signaling a potential continuation of the bearish trend.
Premium Price Zone:
Price is currently in a premium range, where smart money institutions are likely to initiate sell positions. We’ve taken out premium liquidity resting above an engineered resistance zone—a classic setup where smart money manipulates retail traders into entering positions, only to reverse the market and pair sell orders against their stop losses and pending orders.
Bearish Order Block:
Price is currently reacting at a bearish order block, a key institutional resistance zone. This provides a strong area to seek confirmation entries for short positions.
Trading Plan:
Entry Strategy : Look for confirmation within the bearish order block for short opportunities.
Targets: Focus on discount liquidity pools at the lows, where institutions are likely to scale out and book profits.
For a detailed explanation of my strategy, check out the first video of my 2025 ICT Mentorship lectures linked below:
Foundations of Mastery: 2025 Mentorship Begins!
Kind Regards,
The Architect

GOLD → Sellers taking interest for retesting in goldHello Traders!
As we all know that last week gold has made ATH with red candle and also did a retest to 2799 but this retest is not enough for continuation of bullish trend here i have shared my analysis about gold
Currently gold is trading on 2799 at gold support level as next week is going to start in 3 hours so gold can do a gap down opening with strong volume candle and we can see 2774 in gold because gold is in strong bullish trend so it should touch 2774 which is golden zone of fib to continue its bullish trend.
Support Level: 2758-2767
Resistance Level: 2815-2819
Fib Golden Zone: 2773-2763
Liquidity Zone: 2730 (also strong low)
As gold is trading in a ascending channel so our target would be the trendline of ascending trendline but our entry should be at golden zone of fib.
Do not take entry at ATH that is the first of technical analysis so here our entry for buy would be very risky so we will wait for retest.
For Now we can take sell trade for scalping but always use SL because SL is better than liquidation so i am in for sell till 2763
If you like my analysis kindly boost my idea and follow me for more analysis
Analysis By: PIPsOptimizer
Have a nice day thank you!

GBP/USD Symmetrical Triangle Setup: Bullish Breakout?Here's an analysis based on the chart:
Key Observations :
1. **Bullish Triangle Pattern:**
- A symmetrical triangle or wedge is forming, suggesting potential consolidation before a breakout.
- The upward trendline indicates possible bullish momentum as price approaches a breakout point.
2. **Price Levels:**
- Resistance: 1.24860 (shown as the 1.13 Fibonacci extension level).
- Support: Around 1.24100, where price is currently hovering near the trendline.
3. **RSI (Relative Strength Index):**
- The RSI is above 50, which leans toward bullish momentum.
- Divergence may be forming as price action creates higher lows while RSI doesn't show the same strength.
4. **Candlestick Patterns:**
- Multiple rejections around support suggest buying pressure near the trendline.
Trading Implications:
1. **Bullish Breakout Setup:**
- If price breaks above 1.24860, it could signify a continuation to higher levels, potentially targeting a Fibonacci extension level beyond 1.25.
2. **Reversal or Bearish Setup:**
- If price fails to hold the ascending trendline, expect a move downward, potentially testing 1.23900 or lower.

USDCHF Break and Retest of the Failed SwingHello All!
Been waiting patiently on the reversal with this pair. I liked the break and retest of the failed swing line, CHOCH on the 4HR, break of consolidation with a retest to that CHOCH area. With that, it was able to set up nicely giving an entry at 0.90900. My first target is around 0.91300, then possible 0.91500.

Dow Jones - Trading 2025 Is Pretty Clear!Dow Jones ( TVC:DJI ) will create another green year:
Click chart above to see the detailed analysis👆🏻
For the past 15 years, the Dow Jones has been respecting two significant rising trendlines. With each of the previous cycles being around +80% and corrections always starting with the new year, everything is pointing towards another phenomenal stock market year.
Levels to watch: $50.000
Keep your long term vision,
Philip (BasicTrading)

EURUSDHey Traders, what you think of this trade?
Price has broken the bearish channel.
Price retraced to yesterday low demand zone and bouncing to this week high to test or break.
Thank you

ETHUSD Prepares for Expansion with Targets at $4,689 and $6,279
BITSTAMP:ETHUSD remains bullish, with the EMA ribbon confirming its upward trajectory. The price is currently holding above the critical $3,000 support, which has acted as a rebound level multiple times. Previously, a hidden bullish divergence formed on the Stochastic indicator. A hidden bullish divergence occurs when the price makes a higher low while the oscillator forms a lower low, signaling the continuation of the prevailing uptrend. This divergence is often considered a key signal for bullish continuation. The Stochastic has recently crossed above the zero level, indicating momentum with room to reach the overbought zones.
The Signal Builder tool has previously provided bullish signals, aligning with the current analysis. Entry opportunities could be around $2,927, upon the breakout of the descending trendline, or following the breach of a prior swing high during this pullback phase. Using Fibonacci projections of the last impulse, targets are identified at $4,689 (100%) and $6,279 (161.8%). The stop-loss is positioned below the last swing low before the $3,000 support break, around $2,116.
👨🏻💻💭 Does this analysis align with your perspective on BITSTAMP:ETHUSD ? Share your thoughts below!
__
The information and publications within the 3Commas TradingView account are not meant to be and do not constitute financial, investment, trading, or other types of advice or recommendations supplied or endorsed by 3Commas and any of the parties acting on behalf of 3Commas, including its employees, contractors, ambassadors, etc.

12H GOLD CHART ANALYSIS ROUTE MAPHello Traders,
Here’s our 12H chart analysis and target updates, which we’ve been tracking closely. To provide a comprehensive view, we also have 15M, 1H, 4H, 12H, and Daily chart analyses.
We utilize smaller timeframes (15M, 1H, and 4H) to buy dips from the weighed levels, targeting clean 30–40 pip moves. Ranging markets are ideal for this strategy, as they allow for consistent gains without the risk of getting caught in the swings associated with holding longer positions.
Previously, after the EMA5 crossed and locked above 2655, opening 2695, we consistently bought dips into 2686, completing this gap. We then noted that a candle body close above 2695 opened TAKE PROFIT 1, with further confirmation required from the EMA5 lock. This played out perfectly, and TAKE PROFIT 1 (2735) has now been achieved.
To reach TAKE PROFIT 2, the candle body must close above 2735, with the EMA5 locking above this level for confirmation. This would open the path to our next target at TAKE PROFIT 2 (2774).
To simplify your trades, we’ve added entry levels and take profit targets (TP1, TP2, TP3). These levels are aligned with the EMA5 crossing and holding above each, determining the subsequent targets.
For example, when the EMA5 crosses and locks above the ENTRY level, you can take a bullish position and aim for TAKE PROFIT 1 (TP1). If EMA5 fails to lock above TP1, the price may reverse and retest the bottom level, presenting another opportunity to buy dips. Conversely, if EMA5 crosses and locks below the bottom level, it’s best to wait for confirmation, as this could signal a shift in direction.
Our long-term bias remains bullish, and we view price drops as opportunities to leverage smaller timeframes for dip-buying using our defined levels and setups.
Buying dips allows for safer trade management by capitalizing on swings without chasing the bullish momentum from higher levels.
Please do support us by hitting the like button, leaving a comment, and giving us a follow. We’ve been doing this for a long time now providing traders with in-depth free analysis on Gold, so your likes and comments are very much appreciated.
As always, trade safe.
TheQuantumTraders

JKCEMENTJKCEMENT given trendline breakout. It has posted v decent result above street's expectations. There is high probability that market may turn its trend which is in favor of new trend. Keep it on radar.

Nvidia's Largest Single-Day Decline and Its ImplicationsNvidia Experienced Its Largest Single-Day Decline on 27th Jan, tumbled 17%, erasing USD589B from its market capitalisation, it was the biggest in the US stock market history.
What will be the implications?
Last month, we discussed how the Nasdaq reached and responded well to the upper band of its parallel channel.
Nvidia being one of the largest market cap stocks in Nasdaq. What will be Nasdaq’s performance like for the rest of the year?
Let’s explore how we can include fundamental analysis to make sense of the situation.
Micro E-Mini Nasdaq-100 Index Futures & Options
Ticker: MNQ
Minimum fluctuation:
0.25 index points = $0.50
Disclaimer:
• What presented here is not a recommendation, please consult your licensed broker.
• Our mission is to create lateral thinking skills for every investor and trader, knowing when to take a calculated risk with market uncertainty and a bolder risk when opportunity arises.
CME Real-time Market Data help identify trading set-ups in real-time and express my market views. If you have futures in your trading portfolio, you can check out on CME Group data plans available that suit your trading needs www.tradingview.com

GBP/JPY SELL IDEA (R:R=12.3)Selling GBP/JPY once market opens. A beautiful Crab and Butterfly just formed on 15 min chart. Overall direction is down on DAILY timeframe. Daily D ext. is projected at 185.000
Stop Loss is: 194.800
1st Target: 193.712
2nd Target: 193.390
3rd Target: 193.084
4th Target: 192.054
Hope everyone has a great week trading!

inj midterm buy"🌟 Welcome to Golden Candle! 🌟
We're a team of 📈 passionate traders 📉 who love sharing our 🔍 technical analysis insights 🔎 with the TradingView community. 🌎
Our goal is to provide 💡 valuable perspectives 💡 on market trends and patterns, but 🚫 please note that our analyses are not intended as buy or sell recommendations. 🚫
Instead, they reflect our own 💭 personal attitudes and thoughts. 💭
Follow along and 📚 learn 📚 from our analyses! 📊💡"

ADBE near Confluence Support - 33% ROI PossibleNASDAQ:ADBE is currently nearing a confluence support (an area where multiple support elements are combined) at around $410-$420. Nevertheless, opening a first position right now is already an option given the attractive valuation and the horizontal support (blue zone). In addition there are two big daily gaps (red zones) above the current price giving us some potential pulling factor towards $580. The trendline you can see is very weak and has only two real re-tests in October 2022. So, take that with a grain of salt and try to concentrate more on the horizontal support and the $410-$420 area (61.8 fib).
Looking at fundamentals (I know most of you are not really interested in such things, but they do help with swing trades) we can see a price-to-sales ratio of 9.xx suggesting upside of 50% when comparing it to the long-term average of 14.xx. ARR increased 23% YoY to $3.48B. In terms of AI, firefly generated more than 16 billion assets so far, and FY24 revenue increased by a little more than 11% to $21.51B. Current PE ratio is just short of 22.
So, adding here and more towards that $410 will give us a huge potential ROI over the next couple of months.
Support Zones
$440
$410-420
Targe Zones
$540
$580-600

The Great Trump Pump Continues We successfully hit the ExoFade predicted target. Now a new peak has formed and the new peak is the new predicted target of $86
Its a mix of Fear and Excitement.. We all know what happens when anything goes up too fast in record time, a dump is always around the corner. So i can't stress enough how cautious we need to be extremely careful and practice smart risk management, especially since we haven't seen any serious pullback yet.
Until then we'll continue trading each cycle. Take profit when price reaches each peak or at least take some profit. After securing profit re-enter when price pulls back and re-claims the ExoFade line. There are some other indicators that help me with the re-entry that i cannot mention in this post due to house rules, so you can use whatever pull-back re-entry strategy you currently use or reach out to me if you want access. As for the ExoFade, just search for exofade in the tradingview indicators library so you can follow me as i am executing these trades.

The Great Trump PumpThe Exofade indicator is predicting a price target of 52.47 for $TRUMP on m15 chart. This is one of the ways i use the ExoFade, is for setting price targets . After a rally in one direction, you get a curve or peak, whatever you like to call it. This signifies the end of that rally, when can be temporary in the case where it turns out to be a pullback Or permanent in the case where it becomes a trend reversal. After the pullback or reversal the peaks formed by the ExoFade acts like a price magnet whenever price resumes that trend. The prediction ability is based on Volume & Linear Regression calculations.
Even though it's super obvious the $trump coin is ridiculously overvalued at the current price. Meme degens don't care about stats or technicals . This a emotionally driven niche in the crypto market when absolutely can and will happen.
Also keep in mind the technical accuracy of this analysis is can be skewed because this is a brand new launch and just had its first 24hrs so there is almost non existent historic price data for indicators to give best results..So this is just for fun to see if we do hit the price target set by the ExoFade

2 Points Risk 12 Points RewardsNSE:SOUTHBANK trade at 26. Stocks may touch its upper trendline at 36-40 with take a stoploss of 22-24.
