EURUSD TRADEIts been a while, here is my trade, see the charts for your stops and target.
this is only my trade for this week on this pair.
Trade at your own risk. if the stops and target hits, I follow up next idea.
This is not a financial advice.
Follow for more.
Trendpattern

IDEA GBP/USDThis basic analysis is based primarily on strong market areas where we should expect a reaction; I believe there is a high probability.

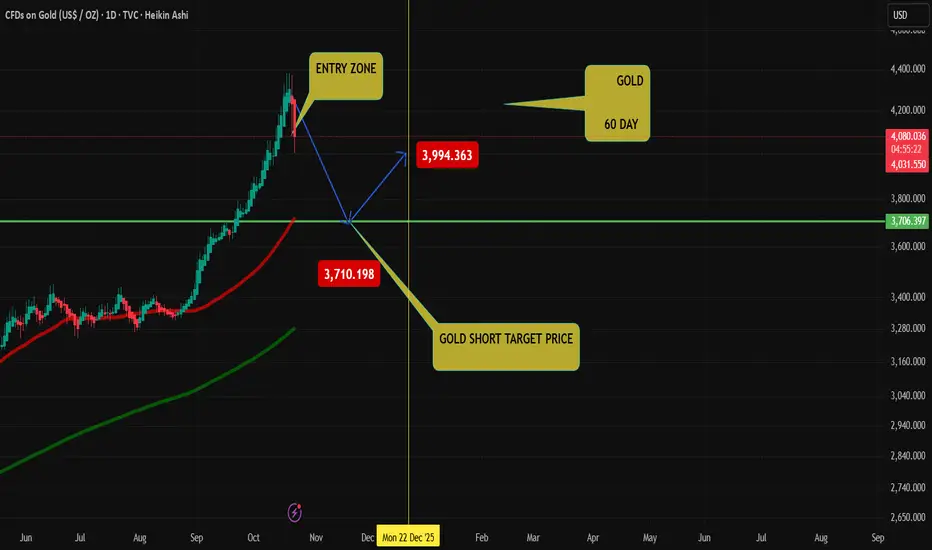
Gold Is Entering a Danger Zone—A Sharp Drop May Hit Before....📌 SETUP SIGNAL (GOLD – 4H)
Strategy: Sell the Downward Channel – Follow the Correction
1️⃣ Sell Setup
Entry: 4188–4175 (after a confirmed 4H close below 4188)
Stop-Loss: 4240
Take Profit:
TP1: 4120
TP2: 4050
Main Target: 4000–3990
Reason:
- Price is moving cleanly inside a descending correction channel.
- Repeated sell-offs + weak bullish reactions show sellers are still in control.
- Breaking 4188 confirms continuation toward the lower liquidity zone.
2️⃣ Alternative Scenario (Low Probability)
Bullish invalidation: Only if price breaks above 4280 (4H close).
→ Then the market may shift upward toward 4365–4370 liquidity.
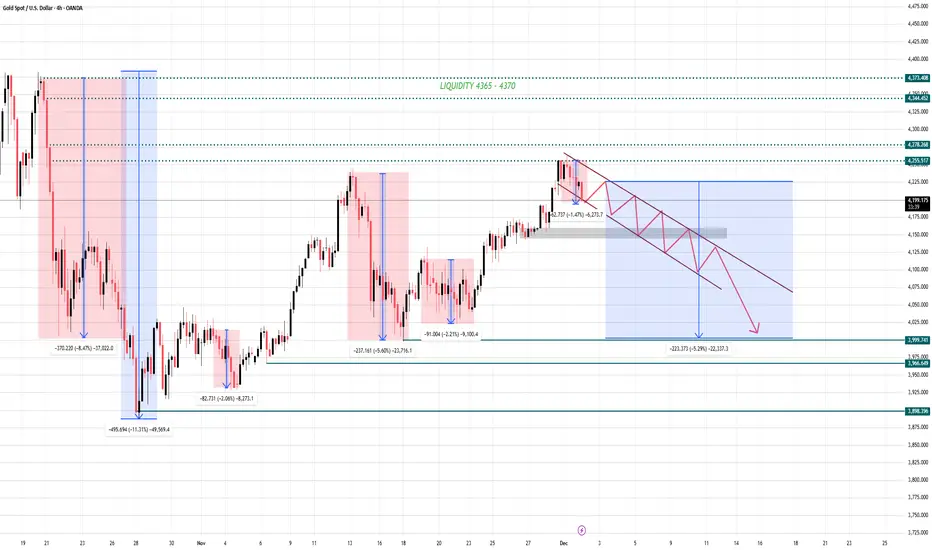
📉 QUICK MARKET OUTLOOK – GOLD 4H (Rejection + Bearish Channel Forming)
Based on the current 4H structure, Gold is showing a clear pattern of repeating deep corrections every time it reaches major resistance/liquidity zones.
The latest price action continues to repeat this same behavior:
Key Observations
- Price has once again rejected strongly from the 4270–4280 zone (same rejection region as previous drops).
- A descending bearish channel is forming → indicating controlled distribution.
- The recent downward legs are consistent with past moves:
-8.47%, -11.31%, -5.60%, -2.21% → the market has a clear history of sharp sell-offs.
- Current structure suggests a continuing corrective wave until deeper support.
📌 Bearish Scenario (High Probability)
Price continues moving inside the descending channel and breaks the short-term support.
Targets → 4120 → 4050 → 4000
Major liquidity & demand zone sits at 3990 – 3980
→ where large buyers historically step in.
If panic selling accelerates, price may extend toward: → 3888 – 3900
📌 Bullish Scenario (Low Probability)
Only activated if Gold breaks OUTSIDE the descending channel and reclaims: → 4280
This invalidates the bearish outlook and reopens the path to 4365 – 4370 liquidity.
🎯 FINAL CONCLUSION
Gold is currently in a corrective downtrend, moving exactly within a well-defined bearish channel.
Unless buyers break the structure, the market is likely heading for deeper retracement toward the 4000 zone before any meaningful bullish continuation.
"Stay patient. Stay disciplined. Let the market come to your levels."
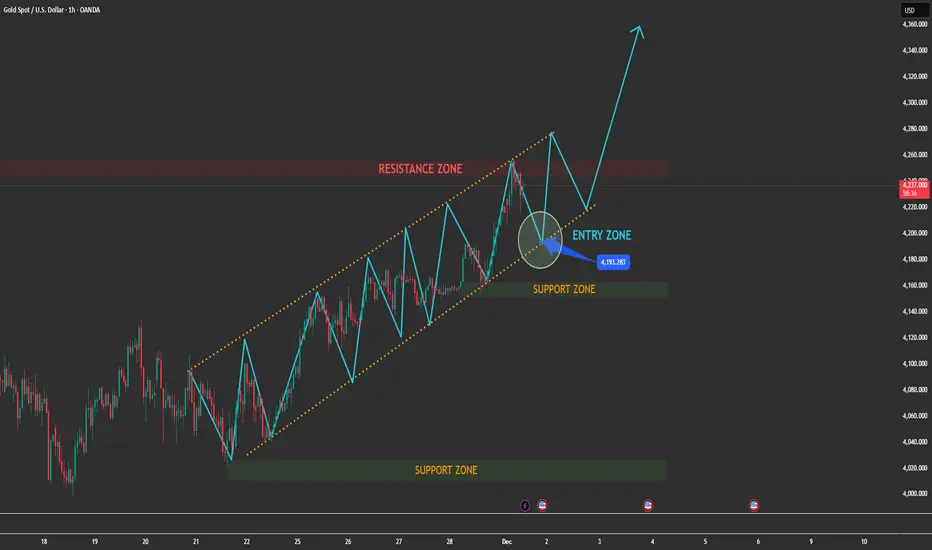
Still Watching the Market Move Without You? Fix That Today.1. Current Market Structure
- Gold is moving inside a well-defined ascending channel, respecting each swing high and swing low with precision — a clear sign that the bullish structure is still intact.
- Key observations:
+ Price has just rejected from the resistance zone at the top of the channel.
+ The current correction is healthy and normal within an uptrend, not a reversal signal.
+ Buyers are still defending the structure as long as price stays above the mid-channel + support zone.
+ Momentum remains bullish — any pullback into the highlighted ENTRY ZONE becomes a high-probability continuation setup.
This is exactly how a strong trending market behaves before its next leg up.
2. MAIN TRADING SCENARIO (HIGH PROBABILITY) – LOOK FOR LONG
➤ Scenario: Price pulls back into the ENTRY ZONE (channel bottom + support zone)
Expectations:
Price retests the lower boundary of the ascending channel
Buyers step in at the confluence area (trendline + structure)
A bullish rejection pattern → strong confirmation for LONG entries
Reasons this setup is high probability:
✓ Confluence of trendline support + horizontal support zone
✓ Clear bullish market structure (higher highs – higher lows)
✓ Retracement after hitting channel resistance is expected
✓ No sign of bearish reversal structure at the moment
Upside Target:
Once price bounces from the entry zone:
TP1: Retest of the resistance zone
TP2: Breakout of the channel → continuation to higher highs (as marked on the chart)
3. Alternative Scenario (Low Probability)
If price breaks below the channel and closes under the support zone:
Market shifts into a corrective phase
Wait for structure to rebuild
No aggressive sells — only reassess when major levels break decisively
But at the moment, the bullish structure remains strong.
4. Conclusion
Gold is still respecting its bullish channel perfectly.
The upcoming pullback is NOT weakness — it is an opportunity.
→ Priority: LOOK FOR LONG in the ENTRY ZONE.
→ Target: A new bullish impulse wave forming toward higher highs.
The Market Doesn’t Lie — But It Always Tests Your Nerve📈 NZD/USD TECHNICAL OUTLOOK — BUY FROM SUPPORT, TARGET THE BREAKOUT
1. Market Structure Overview
NZD/USD is currently correcting inside a descending pullback after a strong bullish impulse.
The structure is forming:
- A higher–low sequence, showing buyers are still in control
- A clear Support Zone where price previously reacted strongly
- A Resistance Zone above acting as the obstacle before a bullish breakout
Current price action is simply a retracement phase, not a bearish reversal.
2. Key Zone to Watch — LOOK FOR LONG
Your chart correctly marks the Entry Zone at the Support Zone.
Here’s why it’s high probability:
✓ Confluence for BUY
- Previous demand reacted sharply
- Market is forming a potential double-bottom or liquidity sweep
- Price is approaching the end of its corrective wave
- Momentum loss on the bearish leg
This area is where institutions typically accumulate long orders.
3. Main Scenario (High Probability)
[/b ]BUY FROM SUPPORT → BREAKOUT → FULL BULLISH CONTINUATION
When price taps the Support Zone:
-Look for rejection
- Look for a higher low
- Enter LONG on confirmation
- Stop loss below structure (as marked)
Take-Profit Levels:
- TP1: Mid-range / mini resistance
- TP2: Major Resistance Zone
- TP3: Full extension (your highest TP zone)
This matches your drawn black path:
Dip → higher low → breakout → strong bullish continuation.
4. Secondary Scenario (Lower Probability)
Price consolidates at Support but does not break higher immediately.
Even if so — this still favors accumulation, not selling.
As long as price stays above the Support Zone → the bias remains bullish.
5. Intraday Bias: BULLISH
- Structure: Uptrend
- Current move: Healthy pullback
- Key reaction zone: Support
- Best trade: BUY on rejection
- Risk management: SL below the liquidity sweep zone
This is a clean, textbook continuation setup.

TAKE PROFIT HIT EURYENEurjpy has wonderfully done as expected and we we able to get into a trade and hit take profit , there’s still more to come too , from this structure so can expect more opportunities

GBP/USD – 4H Technical OutlookMarket Bias:
Range (buyers holding support, sellers defending resistance)
Key Levels:
• Resistance: Major 4H zone where sellers are consistently active
• Support: Strong 4H demand + order block recently respected
• Market Structure: Price has already formed a higher high, signaling bullish intentions
Reasoning:
Price is currently trapped between a strong resistance above and a strong support/order block below.
Buyers successfully defended the support, creating a higher high — a sign of bullish strength.
However, sellers are still aggressively positioned at the resistance zone, creating a tug-of-war scenario.
Trade Idea:
Look for bullish continuation only if support continues to hold and price rejects the zone with strength.
Potential Entry:
• At/near the 4H support or after a clean bullish rejection candle
Stop Loss:
• Below the order block / support structure

Bitcoin Reversal Setup Toward 96K TargetBitcoin is currently trading within a corrective structure after breaking down from the central zone. The chart highlights a fair value gap (FVG), a support level below, and a potential short-term bullish push toward the 96,000 target before any deeper move. The market remains in a ranging phase with key levels marked for possible reactions.

CHN ready to runCHN has demonstrated encouraging developments after emerging from a descending wedge pattern, bolstered by a bullish RSI divergence and the formation of a bull flag on the hourly chart. Furthermore, the daily chart reveals hidden bullish divergence, complemented by support from a trendline established in July and a .05 Fibonacci retracement level. A decisive move above $2 would serve as a strong indicator of a structural shift, potentially paving the way for a more substantial upward trend. Good luck and happy trading! 🍀

Bitcoin Rebound from Support Toward Key Resistance TargetsBitcoin is showing a potential rebound from the support zone near $103,200. Price may target the $104,800 (Target 1) and $105,400 (Target 2) resistance levels if bullish momentum continues. The Fair Value Gap (FVG) suggests possible upward movement after recent correction.

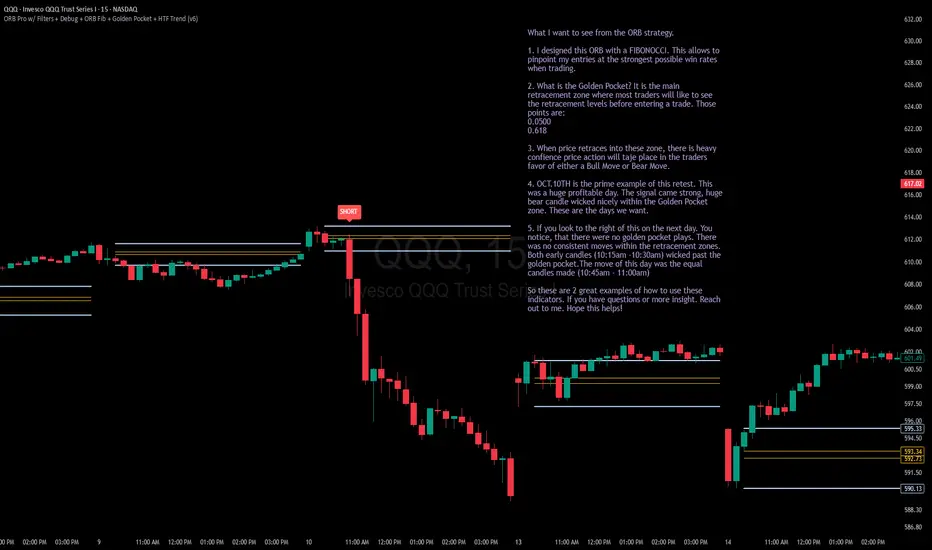
Some notes to reflect on. A little how to for the indicatorHey everyone,
Hope you guys & gals are doing well using these indicators. I'm publishing a chart that I wrote some notes for. Notes are offering some insight on what look for when using this indicator. If you have any questions, let me know. I am planning to get videos up soon when I get some extra free time.
Thank you again for the support!
GOLD on the RISE!XAUUSD moved as we analyzed. Now waiting for BreakOut from RESISTANCE to see if it will retesting and continue flying UP todsy or when markets reopen next week.

GOLD US SHORTGOLD 60 DAY Target point
You try! Easy Money,
The gold Only long position after!!!
check my profile gold / play button
XAUUSD: Prioritize Buying, Is the $5000 Target Still Distant?XAUUSD: "No More Gold to Sell" - Prioritize Buying, Is the $5000 Target Still Distant?
Hello trading community,
The Gold market (XAUUSD) is in a state of "extreme euphoria," continuously setting new highs. The upward momentum is driven not only by technical charts but also by extremely strong macroeconomic factors.
This article will analyze why the strategy "Prioritize Buying on Dips" is optimal, and the $4400 level, though seemingly high, might not be the final stop.
📰 Macro Analysis: "No More Gold to Sell!"
The market is witnessing a physical supply shock that cannot be ignored:
Supply Shock: Japan's largest gold retailer has temporarily halted gold bar sales due to overwhelming buying demand. This is a clear signal that physical gold demand is far outstripping available supply. When physical gold is scarce, paper market prices must rise to reflect true value.
Falling Bond Yields: The 10-year German government bond yield (representing Europe) has dropped to its lowest level since June. Lower yields make Gold (a non-yielding asset) significantly more attractive compared to holding bonds.
Both factors are creating a "perfect storm" supporting the price rise of XAUUSD.
📊 Technical Analysis
The M30/H1 chart shows a very sustainable parabolic uptrend:
Trend: The uptrend is undeniable. Prices are moving in a steep upward channel, with all selling efforts quickly absorbed by buyers.
Fibonacci Extension: Fibonacci extension levels are acting as the next price targets:
Zone $4382 (Fib 2.273): Conquered.
Zone $4407 - $4410 (Fib 2.407): This is a potential "Sell Scalping" zone, where a short correction might occur.
Zone $4480 - $4483 (Fib 2.618): This is a strong resistance "Sell Zone," the next target for buyers.
Volume Profile (VPVR):
"Buy Retest" Support ($4290 - $4300): This is an extremely important liquidity zone, a former peak that has been broken and also an area with large accumulated trading volume. Buyers will strongly defend this zone.
🎯 Detailed Trading Strategy
The main trend is Buying. Any Sell orders at this time carry high risk and should only be considered for short-term scalping to catch corrections.
Scenario 1: Buy the Dip 📈
Entry Zone: Wait for price to correct to the "Buy retest" zone $4290.
Stop Loss: $4280.
Take Profit: $4312 - $4334 - $4372 - $4390.
Scenario 2: Sell Scalping ⚡️
Entry Zone: Look to sell at the Fibo $4410 zone.
Stop Loss: $4420.
Take Profit: $4393 - $4380 - $4370. (Note: Counter-trend order, use small volume and take quick profits).
Scenario 3: Sell at Strong Resistance Zone 📉
Entry Zone: $4480.
Stop Loss: $4490.
Take Profit: $4463 - $4442 - $4410.
Summary
The combination of a strong technical uptrend and a fundamental supply shock is pushing Gold into a new price cycle. The $4400 level has been conquered, and with this momentum, the long-term target of $5000 is no longer a fantasy.
The wisest strategy is to "go with the flow," looking to Buy at key support zones.
Wishing traders a successful week!

Gold Eyes New All-Time High
You said:
btcusd rinning 600+ pips in my direction . translate into german
ChatGPT said:
BTC/USD läuft mit über 600 Pips in meine Richtung.
You said:
translate it into spanish
ChatGPT said:
BTC/USD va con más de 600 pips a mi favor.
You said:
translate into russian
ChatGPT said:
BTC/USD движется в мою сторону более чем на 600 пунктов.
You said:
Ethusdt gone 350+bin my direction after touching fvg, nake ut professionals
ChatGPT said:
ETH/USDT moved 350+ pips in my direction after touching the FVG — a clean and professional move.
You said:
translate it into german
ChatGPT said:
ETH/USDT lief über 350 Pips in meine Richtung, nachdem es die FVG berührt hatte – eine saubere und professionelle Bewegung.
You said:
translate into russian
ChatGPT said:
ETH/USDT прошёл более 350 пунктов в мою сторону после касания зоны FVG — чёткое и профессиональное движение.
You said:
translate into spanish
ChatGPT said:
ETH/USDT se movió más de 350 pips a mi favor después de tocar la zona FVG — un movimiento limpio y profesional.
You said:
Uploaded image
analyze this chart describly and give suitable title
ChatGPT said:
🟡 Chart Analysis: Gold (XAU/USD) — Daily Timeframe
Overview:
This chart presents a bullish continuation setup for Gold (XAU/USD) on the daily timeframe. The market has recently shown strong upward momentum, forming several large bullish candles after a period of consolidation.
Key Observations:
Recent Momentum:
A strong bullish rally has pushed the price upward, indicating renewed buyer interest and institutional activity.
Retracement Zone:
The highlighted green area represents a potential retracement or re-entry zone. Price is expected to pull back into this area before resuming its upward trajectory.
Stop Loss Placement:
The red zone beneath the retracement area marks the stop-loss level around $4,026, strategically placed below recent swing lows for risk management.
Target Level:
The target zone is aligned with the All-Time High (ATH) around $4,200, which serves as a key psychological and technical resistance level.
Projection Path:
The chart’s white and black arrows illustrate an expected bullish impulse–retracement–continuation pattern, suggesting the price may briefly correct before surging to new highs.

BTC Trend Continuation Trading with Fibonacci and Price Action📹 In this video, I break down a powerful trend continuation strategy as we look at a BTC Bitcoin chart designed to help you identify high-probability trading setups 🎯.
📊 We’ll dive nto using the Fibonacci retracement tool alongside consistent, repeatable price action patterns that tend to appear in strong trends. When a specific setup reveals itself, that’s when we look to take advantage of the opportunity.
📈 The focus is on recognizing higher highs and higher lows in a bullish market structure, understanding how to align with momentum, and building confidence in trading the continuation of trend direction 🚀.
⚠️ Disclaimer: This content is for educational purposes only and not financial advice. Always manage your risk and trade responsibly.

XAGUSD SILVER📈 Silver (XAGUSD) – Long Setup (4H)
Technical View
Price has broken out of a rectangle consolidation on the 4H chart.
Breakout is supported by bullish momentum candles.
Market structure showing higher highs (HHs) and higher lows
Trading Plan
Entry: On successful breakout retest / bullish confirmation candle.
Targets:
🎯 TP1:
🎯 TP2:
🎯 TP3:
Risk Management Rule
Once TP1 is hit, immediately move SL to entry (break-even).
Partial profits can be booked at TP1; let the rest run toward TP2 and TP3.

War is a Racket | DFEN | Long at $28.00The war machine keeps turning. Profits will reign. Direxion Aerospace and Defense 3x AMEX:DFEN never fully recovered from pandemic lows, but world peace is (unfortunately) far from reach. The uptrend in the chart has commenced. Personal entry point at $28.00.
Target #1 = $37.00
Target #2 = $50.00
Target #3 = $64.00

EURUSD to return bullish as it gets closer to 1.17000EURUSD is revising the bullish trendline level and is expected to continue its bullish move from there onwards.
DXY also remain bearish despite the heavy correction.
Please watch the video and let me know your thoughts.

GBPUSD1H Short Call
GBPUSD
Support Break (which earlier was stong resistance now was acting as support on confirmation
Short trade Is valid)
Manage your risk and rewards
📊 Key Data Just Released: US UN-Employement Claims
FUNDAMENTALS:
Unemployment Claims: 231K (better than forecast 241K, and much better than 264K prior) → labor market stronger.
Philly Fed Manufacturing: 23.2 (blowout vs 1.7 forecast, -0.3 prior) → economic activity hotter.
👉 This means:
Labor market is not weak, economy looks stronger than expected.
So the 25 bps cut last night will be seen as normal easing, not aggressive.
Aggressive cut scenario is off the table for now, unless Fed signals future cuts.

LTTS: Turnaround Play for 30% Upside Potential⚡ Price Analysis:
1️⃣ Price is starting to form a higher low base formation.
2️⃣ Good strong candle formation is needed for further upside move.
3️⃣ Volume: If accompanied by rising volume, this price move confirms genuine bullish interest and possible institutional participation.
4️⃣ The marked blue zone should act as a demand zone.
✨ Key Observations:
➡️ Retest Opportunity: Retest of the ₹4,500 level can serve as an accumulation zone for bullish continuation trades.
➡️ Trade Expectation: As long as price remains above support with strong candle closes, positive bias maintained. Watch for follow-through volume and avoid chasing if there’s low volume on further breakouts.
⚠️ Disclaimer: This is NOT a buy/sell recommendation and is for educational purposes only. Please do your own due diligence before trading or investing! ⚠️
💬 Share your thoughts and insights below!
🔥 Trade Safe! ✅🚀

Double Bottom Reversal likely for GBPAUDPrice has been moving in a clear downtrend inside a descending channel. After this recent fall, notice how price seems to have formed a double bottom. This particular pattern often shows up after a big decline like so.
The neckline, is a key level to watch now, and price is starting to break above it. A strong breakout candle can confirm this pattern, but the safer play is to wait for price to come back and retest the neckline. If the old resistance now holds as support, that’s the ideal spot to join the move.
The projected target comes from measuring the height of the double bottom and adding it to the neckline. In this case, the upside target points towards the 2.0539. A stop loss can be placed either below the neckline after retest, or more conservatively below the second bottom.
The one-hour double bottom can be reliable too, but its reliability is more dependent on volatility, unexpected events, and overall market conditions. For now, if the neckline holds on a retest, and shows good rejection, there's a high probability price will be pushing higher.
