CADCHF technical based analysis
OANDA:CADCHF pushing bullish in this week, after events and based on technicalls we can expect here higher bullish continuation.
SUP zone: 0.57300
RES zone: 0.58000, 0.58250
Trendtrading

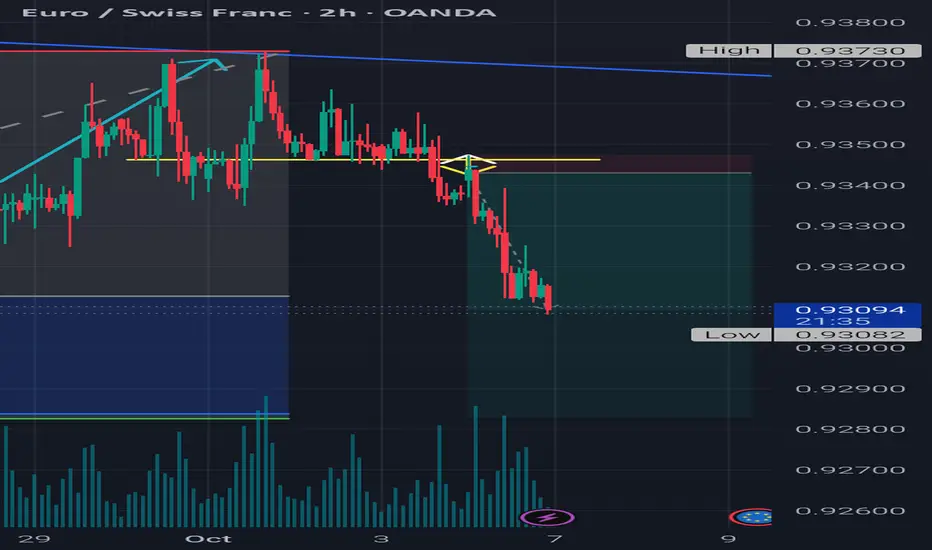
EURGBP higher bearish expecting
OANDA:EURGBP price is make bearish push in week before, currently bouncing on zone and from here expecting one more bearish push.
SUP zone: 0.87050
RES zone: 0.86200, 0.85900

USDJPY: Waiting for bullish pullback signals on the 4h timeframeTo better understand my current outlook on USDJPY, please refer to my previous higher-timeframe and fundamental analyses:
* Trend: assessed using at least three trend indicators, with market structure as the primary guide.
** Weak or Reversal Signals: Assessed based on one of our criteria for trend reversal signals.
*** Support/Resistance: Selected from multiple factors – static (Swing High, Swing Low, etc.), dynamic (EMA, MA, etc.), psychological (Fibonacci, RSI, etc.) – and determined based on the trader’s discretion.
**** Our advice takes into account all factors, including both fundamental and technical analysis. It is not intended as a profit target. We hope it can serve as a reference to help you trade more effectively. This advice is for informational purposes only and we assume no responsibility for any trading results based on it.
Please like and comment below to support our traders. Your reactions will motivate us to do more analysis in the future 🙏✨
George Vann @ ZuperView

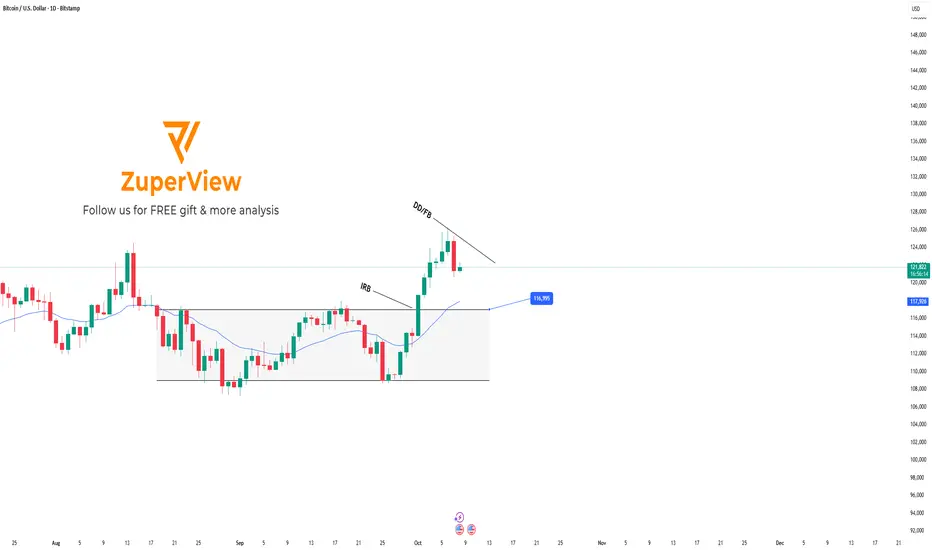
BTCUSD: Short term sell setup - Long term buy opportunity ahead
🔁 Review of Yesterday’s Plan
After BITSTAMP:BTCUSD rallied and set a new high at 126,190, the market entered a corrective phase.
In yesterday’s plan, we expected that:
Once the H1 candle closed below EMA, BTC could continue its decline and retest the lower support zone.
After touching support, price might pause briefly, then break lower to continue the downtrend.
Currently, BITSTAMP:BTCUSD has broken below and is consolidating sideways within a narrow range on H1, aligning perfectly with the anticipated correction scenario.
📈 Trading Plan for Today
On the H1 timeframe
Two key levels to watch for the Sell plan:
Resistance: 123,449
Support: 121,293
Scenario 1:
If price fails to break above EMA and keeps consolidating near 121,238While staying below EMA, → wait for a BB (Break Block) confirmation → Sell following the breakout signal.
Scenario 2:
If price retraces toward EMA and moves up to test 123,471→ wait for bearish confirmation around resistance to Sell from that level.
On the Daily timeframe
After the strong rally, BTC is now undergoing a technical correction.
The plan is to wait for price to pull back to retest the upper boundary of the previous range around 116,995, and Buy from that area.
Alternative setup:
If price reaches EMA sooner without testing the 116,995 zone,→ wait for BTC to accumulate momentum, then look for DD (Double Doji) / FB (First Breakout) pattern confirmation → Buy after signal confirmation.
🎯 Summary:
Short-term (H1): Bearish correction.
Mid-term (Daily): Bullish bias intact, waiting for confirmation near support.
Please like and comment below to support our traders. Your reactions motivate us to do more analysis in the future 🙏✨
Daniel Miller @ ZuperView
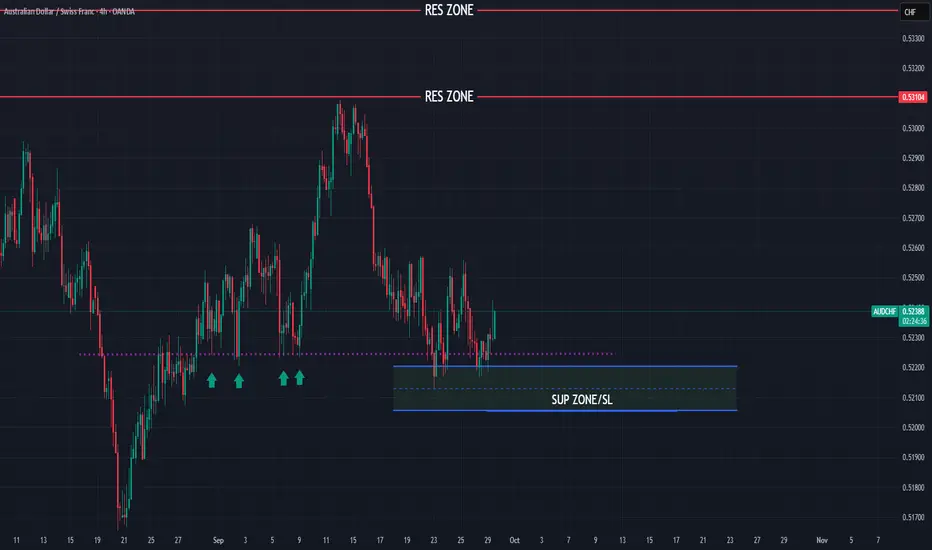
AUDCHF new bullish expectations
OANDA:AUDCHF interesting chart, around 10 times price is bounce on EL zone 0.52230, in week before we are have SNB.
On 9.Sep on this pair we are not see some stong bullish push, soon after price is make revers.
Currently for this week, on this zone expecting new stronger bullish push.
SUP zone: 0.52200
RES zone: 0.53100, 0.53400
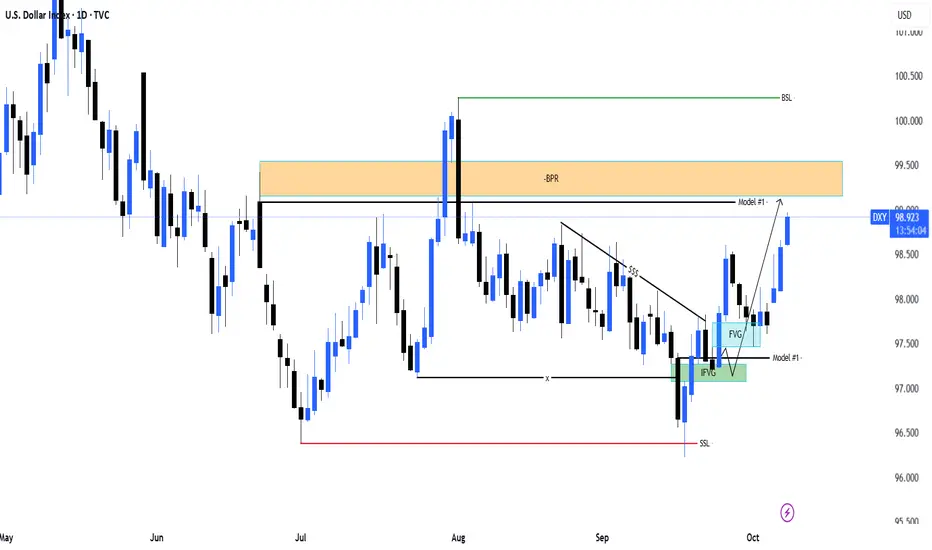
DXY Target Achieved | Smart Money Model #1 Playing Out PerfectlyHello Billionaires!!
In DXY D1 Projection we know the bullish projection on DXY played out exactly as expected.
Price swept the short-term sell-side liquidity (SSL), filled the IFVG, and then launched upward through the FVG, completing the Model #1 structure.
Currently, price is trading inside the BPR (Balanced Price Range), showing that the target zone has been successfully reached.
🧠 Smart Money Logic:
SSL sweep → Market Structure Shift
IFVG + FVG = Strong Reaccumulation
Price delivered to BPR (Premium Zone)
Model #1 completion confirms bullish delivery
Now I’ll be watching for potential reaction or retracement from this premium zone before the next move develops.
#DXY #SmartMoneyConcepts #PriceAction #ICT #Forex #Liquidity #BPR #FVG #IFVG
XAUUSD – PRICE ABOVE $4000: TRULY INSANE FOR TRADERSXAUUSD – PRICE ABOVE $4000: TRULY INSANE FOR TRADERS
Gold has officially surpassed the $4000 mark, marking one of the most robust rallies in recent history.
Let's take a look at key price zones and short-term opportunities 👇
🔻 SELL Scenario
SELL 4025–4027 → SL 4033 → TP 4015 – 4000 – 3980
SELL 4042–4044 → SL 4049 → TP 4030 – 4015 – 4000 – 3980
🟩 BUY Scenario
BUY 3993–3995 → SL 3988 → TP 4005 – 4013 – 4023 – 4040
BUY 3980–3983 → SL 3975 → TP 3998 – 4005 – 4013 – 4023 – 4040
📈 Technical Analysis
The medium-term uptrend channel continues to be maintained steadily.
Rising lows indicate that buying pressure remains very strong.
The nearest psychological resistance is around the 4043 area, coinciding with the Fibonacci extension.
The expected buying zone is at the POC Volume Profile area — a high liquidity zone, previously where many traders expected gold prices to be rejected, but now could become a strong demand area.
🧭 Macro Perspective
If the Federal Reserve (Fed) continues to cut interest rates, the market could aim for the next milestone – 5000 USD/ounce.
Although short-term fluctuations may occur (such as temporary ceasefires in the Middle East or Ukraine), the core drivers of this trend remain unchanged:
US public debt is increasing
Central banks are diversifying foreign exchange reserves
The USD is weakening
All support the medium-term uptrend of gold.
⚡️Summary
Gold remains in a solid bullish structure, even as it approaches overbought territory.
There may be strong corrections, but as long as the uptrend structure is maintained, buyers remain in control.

XAU/USD Intraday Plan | Support & Resistance to WatchGold is pulling back after failing to clear resistance around 3970, showing the first signs of intraday exhaustion following the sharp rally. The bias remains bullish, but it’s healthy to see some correction after strong momentum.
The MA50 acts as the first line of dynamic support, aligning with the 3937 support level. Failure to hold above this zone may open the way for a test of lower reaction zones before fresh buying interest emerges.
A clear break above 3970 will likely invite momentum buyers and push price toward the 4000 and possibly 4020 resistance levels.
📌Key Levels to Watch
Resistance:
3970
4000
4020
Support:
3937
3909
3880
3820
🔎Fundamental Focus:
The ongoing U.S. government shutdown continues to delay key data and elevate risk sentiment. With uncertainty rising and liquidity thinning, gold is highly reactive to political headlines, leading to erratic intraday volatility. Safe-haven demand underpins dips, but sudden reversals remain possible.

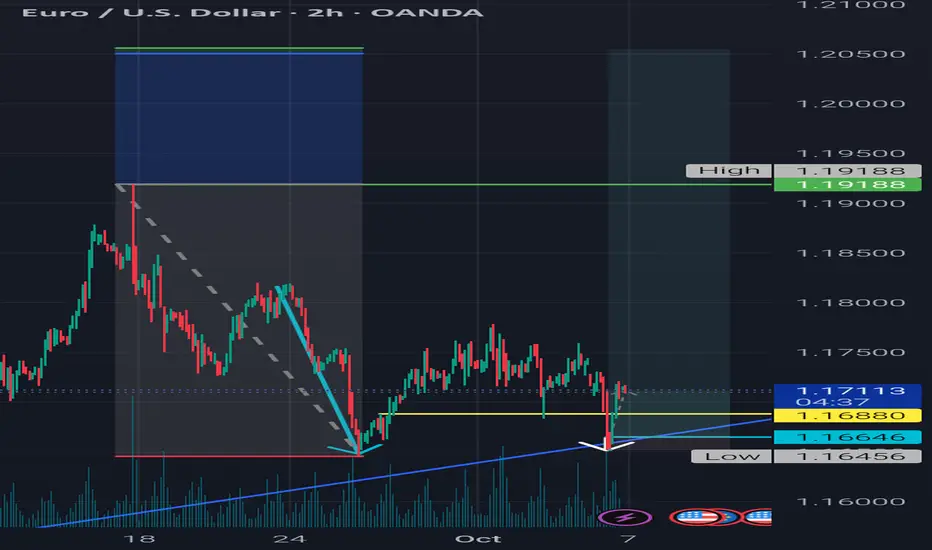
Momentum-Backed Retracement + Volume Retest | BadgerFX 📊 This setup establishes directional bias from the monthly chart (Current Bias: 📈 Bullish). The trade idea integrates momentum-driven retracements in line with this bias and validates continuation through structure and volume on the 15m.
📍 1.16880 confirmed the shift in structure, supported by volume, reinforcing alignment with the monthly trend. Final execution 🎯 relies on candlestick precision for entry timing.
⚠️ Disclaimer: The information shared here is for educational and entertainment purposes only and should not be considered financial advice.
BadgerFX 🦡 – Honey Badger Don’t Care
Momentum-Backed Retracement + Volume Retest | BadgerFX 📊 This setup establishes directional bias from the monthly chart (Current Bias: ). The trade idea integrates momentum-driven retracements in line with this bias and validates continuation through structure and volume on the 15m OANDA:EURCHF .
📍 0.93462 confirmed the shift in structure, supported by volume, reinforcing alignment with the monthly trend. Final execution 🎯 relies on candlestick precision for entry timing.
⚠️ Disclaimer: The information shared here is for educational and entertainment purposes only and should not be considered financial advice.
BadgerFX 🦡 – Honey Badger Don’t Care
BTC Trend Continuation Trading with Fibonacci and Price Action📹 In this video, I break down a powerful trend continuation strategy as we look at a BTC Bitcoin chart designed to help you identify high-probability trading setups 🎯.
📊 We’ll dive nto using the Fibonacci retracement tool alongside consistent, repeatable price action patterns that tend to appear in strong trends. When a specific setup reveals itself, that’s when we look to take advantage of the opportunity.
📈 The focus is on recognizing higher highs and higher lows in a bullish market structure, understanding how to align with momentum, and building confidence in trading the continuation of trend direction 🚀.
⚠️ Disclaimer: This content is for educational purposes only and not financial advice. Always manage your risk and trade responsibly.

BTCUSD: Weekly reviewThis week, BITSTAMP:BTCUSD recorded a strong rally, moving from 109,900 → 120,800, equivalent to about +10,900 USD (+9.9%).
After last week’s sharp decline, the market clearly reversed into an uptrend as price broke out and held firmly above the EMA.
Today is Friday, and the market may experience strong volatility due to the Non-Farm Employment Change (NFP) report – an event that often has a major impact on price movement and trading strategies during the day.
Key Setups of the Week
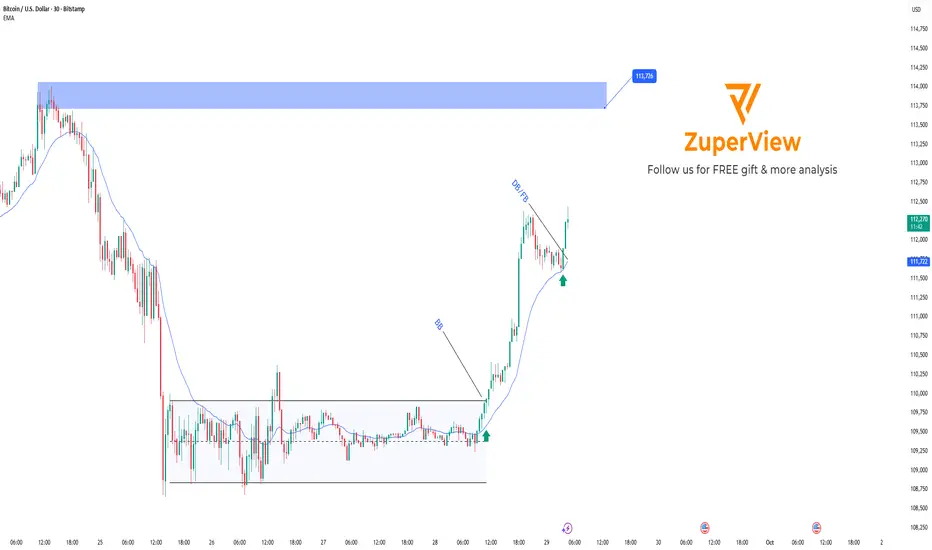
1. BITSTAMP:BTCUSD Review – September 29
After a sharp drop, BTC rebounded, broke out of the range, and held above the EMA.
This was an early signal confirming a trend reversal from bearish to bullish.
2. BTC Review – September 30
After breaking out of the larger range and rallying strongly, the plan was to wait for a pullback toward the EMA.
Price formed a diagonal wave and gave confirmation signals through DD (Double Doji) / FB (First Breakout).
The entry was triggered, and the market rallied nicely, hitting the target as expected.
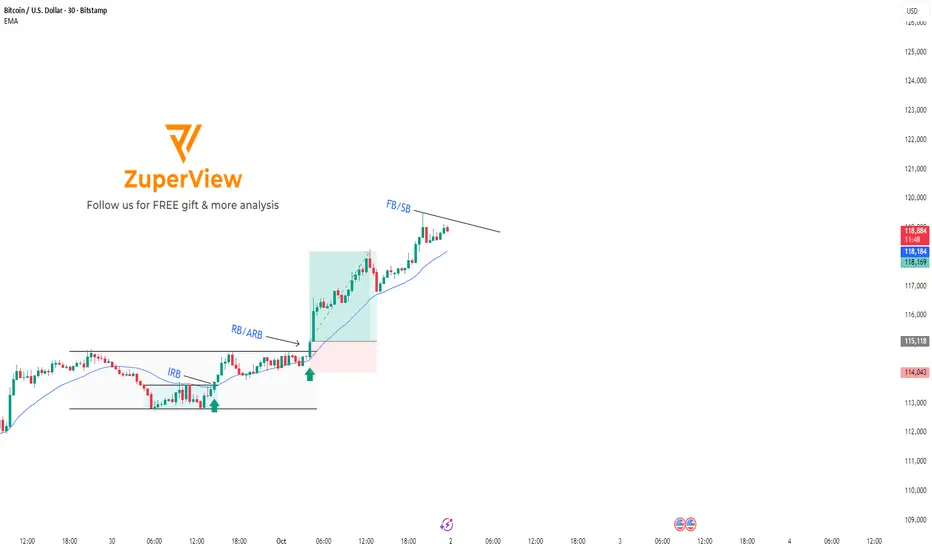
3. BTC Review – October 1
After the rally, BTC retraced and closed below the EMA.
At this point, the short-term trend was unclear → staying out and waiting for more market data to avoid unnecessary risk.
4. BTC Review – October 2
On the following day, price recovered and consolidated right at the upper boundary of the range.
EMA pressed tightly, creating a momentum compression zone and setting up for the next breakout.
The plan was to wait for RB/ARB confirmation, then Buy following the breakout.
This setup worked out successfully, BTC broke out strongly and continued to hit the target.
5. BTC Review – October 3
The main bullish trend continued, showing no signs of weakness.
The plan: wait for a pullback to the EMA, confirm a FB/SB (Second Breakout) signal, then Buy in line with the uptrend.
The scenario played out accurately, delivering another profitable setup.
Conclusion
Trend of the week: Clearly bullish.
Buy setups around EMA and breakout strategies performed effectively, resulting in a consistent winning streak.
Caution for today: With NFP on the schedule, unusual volatility may occur. Traders should manage risk carefully and patiently wait for clear confirmation signals before entering the market.
You can refer to my previous analysis here:
Please like and comment below to support our traders. Your reactions motivate us to do more analysis in the future 🙏✨
Daniel Miller @ ZuperView

BTC escapes consolidation, shifting into an uptrend
Price has broken out of the sideway range 108,500 – 109,800, shifting from bearish to bullish.
After the BB (Block Breakout), BTC surged to 112,500 – 113,000 before consolidating.
Currently, price is trading far from the EMA (around 111,100), implying a possible pullback.
Strategy:
Wait for price to retrace toward EMA (111,000 – 111,200) or consolidate in this zone.
If patterns such as DD (Double Doji) or FB (First Breakout) form within 111,000 – 111,500, consider long entries.
Please like and comment to support our traders. Your feedback motivates us to produce more analysis in the future 🙏✨
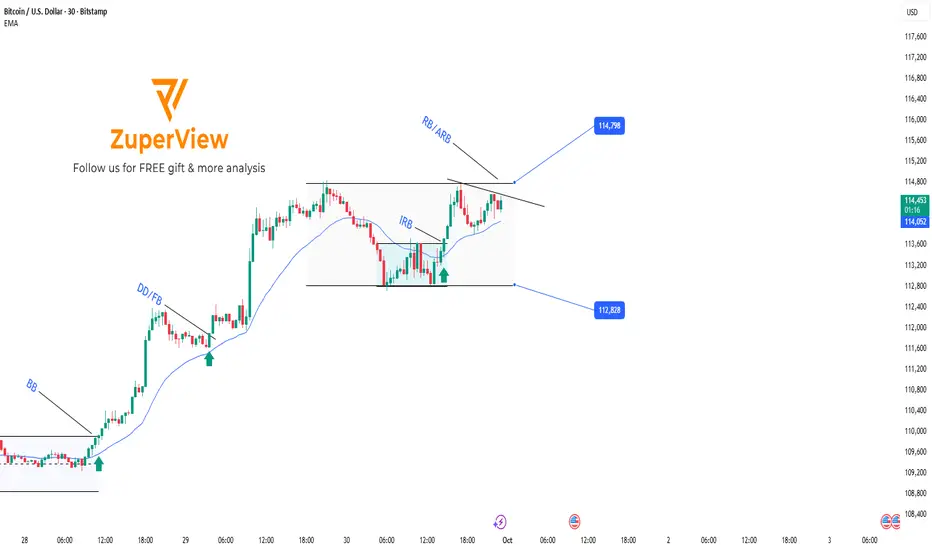
BTC breakout trading setupBITSTAMP:BTCUSD is currently consolidating within the 112,828–114,798 sideway range.
Earlier, the market broke out from a smaller accumulation inside the larger range, generating an IRB (Inside Range Break) signal, pushing price back toward the upper boundary.
Price is now forming a momentum consolidation, indicating potential for another breakout.
2 Possible Scenarios
1. RB (Range Break)
Price compresses further with EMA pressing tightly.
A strong breakout directly above the range top may occur with momentum.
2. ARB (Advance Range Break)
After breaking above the range, instead of continuing higher immediately, price may stall.
A new consolidation forms just above the broken range, with EMA pressing upward.
This setup may signal a continuation of the previous breakout move.
You can refer to my previous analysis here:
Please like and comment below to support our traders. Your reactions motivate us to do more analysis in the future 🙏✨
Daniel Miller @ ZuperView
BTCUSD: Breakout played out, focus on EMA retestOverview
Yesterday’s Breakout Plan played out correctly, with BITSTAMP:BTCUSD continuing its bullish move.
The market remains in an uptrend, with no clear signs of reversal.
However, price is currently trading far above the EMA, so it’s not ideal to chase entries here.
Trading Plan for Today
Primary Scenario:
Wait for BITSTAMP:BTCUSD to retrace closer to the EMA and form a momentum consolidation zone.
If confirmation appears (e.g. breakout through the short-term trendline), consider long entries in line with the trend.
Alternative Scenario:
If BTC closes below the EMA with strong bearish momentum, a deeper correction is possible.
In this case, stay cautious and wait for a new structure to form before re-entering.
You can refer to my previous analysis here:
Please like and comment below to support our traders. Your reactions motivate us to do more analysis in the future 🙏✨
Daniel Miller @ ZuperView
Market on Fire: S&P 500 & Nasdaq Rally Towards New HighsWe have a beautiful P-Shape volume profile formed at the top and we broke and closed above it.
The P-shape volume profile is bullish profile that is formed when large volumes are transacted at the highs meaning participants a willing to pay premium price . You can see the POC so close to the top of the VAH
I checked the CVD of the volume on a footprint chart and i see the volume has -ve Delta , which means alot of aggressive sellers transacted there trying to push the price down. Now that they are being squeezed slowly and start closing out their positions, it should fuel the uptrend. i entered the trade soon as we broke and closed above the value area.
Food for thought.. Who was willing to pay the high price to buy from the aggressive sellers?
DEFINITIONS
POC- point of control
VAH- Value area high
CVD- Cumulative Volume Delta
Target is the ExoFade area..Lets see how this trade goes

LiamTrading – Intraday Trading Outlook LiamTrading – Intraday Trading Outlook
Looking at the global financial picture, we can see an extraordinary alignment:
Equities – All-Time High (ATH)
Housing Prices – ATH
Bitcoin – ATH
Gold – ATH
Money Supply – ATH
National Debt – ATH
CPI Inflation – averaging 4% annually since 2020, twice the Fed’s “target”
Federal Reserve – continuing to cut interest rates this month
It is clear that cheap money combined with persistent inflationary pressure is a powerful driver behind gold’s move into historic territory. In this context, looking for buying opportunities in line with the trend remains the more rational approach.
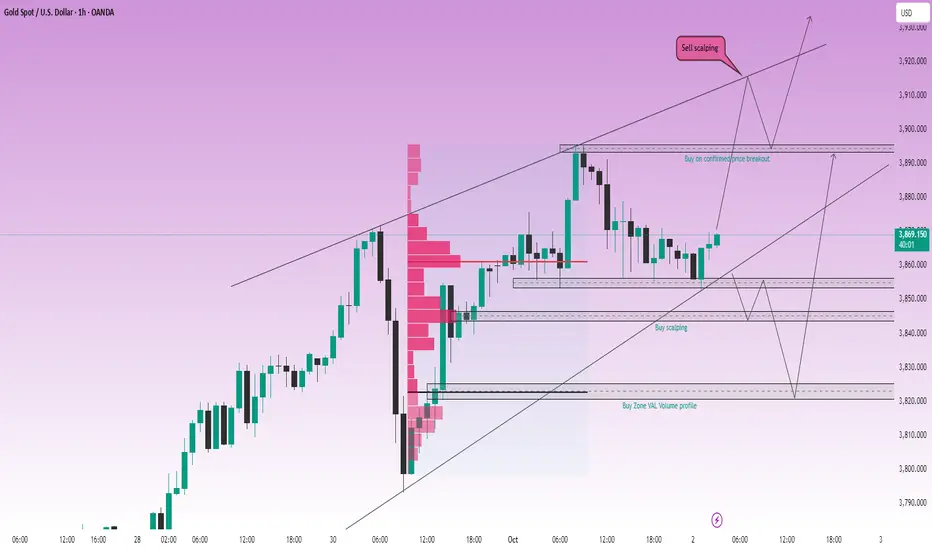
📊 Technical Analysis – H1 Chart
Gold is moving within a well-defined upward channel.
Volume Profile indicates the POC around 3840–3850, an important level for potential scalping buys.
The VAL aligns with the rising trendline near 3820–3822, providing strong confluence for medium-term buying.
A confirmed break above 3895 (new ATH) would support further trend-following buys.
Key resistance sits at 3913–3915, suitable for short-term scalping sells.
🎯 Trading Scenarios
Buy scalping: 3845 | SL 3839 | TP 3856 – 3870
Buy zone (main): 3820 – 3822 | SL 3816 | TP 3832 – 3845 – 3860 – 3875 – 3890
Sell scalping: 3915 – 3913 | SL 3920 | TP 3900 – 3885 – 3872 – 3860
Buy breakout: A confirmed move above 3895 → continue buying with targets open towards 3915+
📌 Conclusion
Gold remains in a strong uptrend, supported by both fundamental and technical factors. Short-term corrections are better viewed as opportunities to build on buy positions. That said, it is important to keep an eye on nearby resistance levels to optimise entries.
👉 This is my personal perspective on XAUUSD and not investment advice.
Follow me to stay up to date with daily gold scenarios 🔥
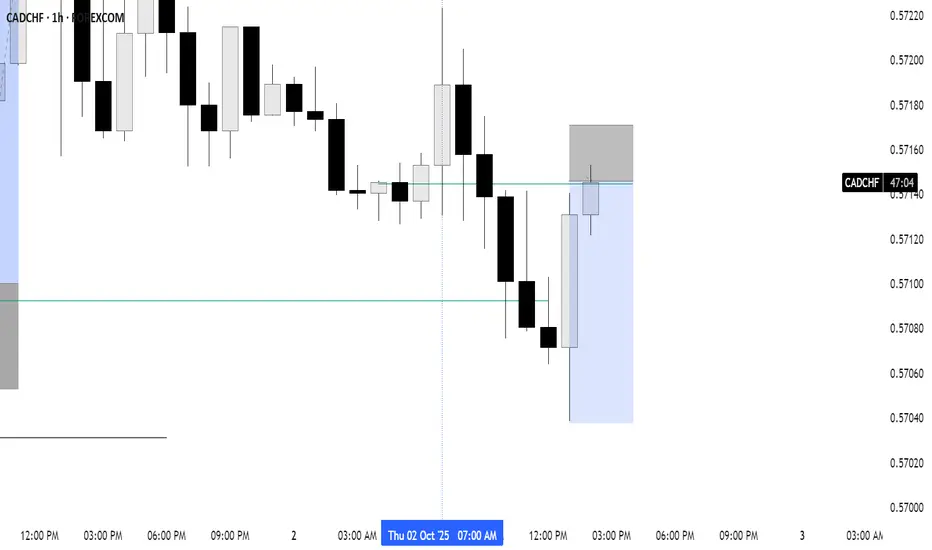
CADCHF Sell Setup CADCHF Sell Setup - price action reacted from a bullish support and resistance level, but failed to follow through, so we need to trade against it, therefore we have a QM SnR level price is rejecting from.
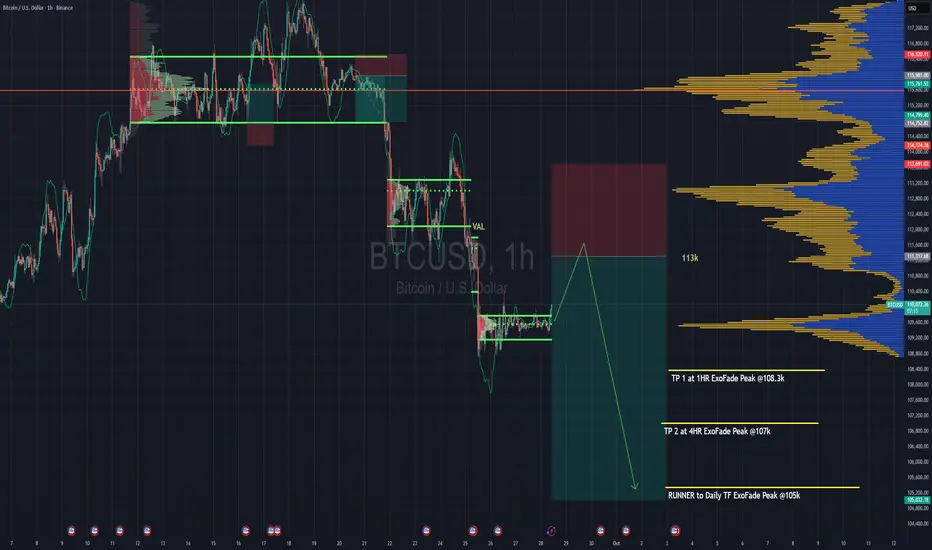
Looking to Short Bitcoin From Here : Winter Is Coming !!Looking to short BTC for a continuation of the downtrend.
Trend is your friend is what they say.
So we're basically going to wait for a pullback to 113k range then enter a sell.
The sell entry caters for both H4 & Daily timeframe trend, so it's a strong one.
The sell entry range also has the VAL of the last rotation we had from Sept 21st to Sept 24th when we finally broke down from it at 112k. That VAL should be a strong point for rejection, it'll be one of the places where we'll truly get to test the strength of the bears ( that's if we even make it that far )
TP targets are based on ExoFade peaks of the H1, H4 and Daily timeframe.. You can add the ExoFade to your charts to follow on your own charts as well.
VAL - Value Area Low of the volume profile
Strategy => Volume + Trend + Lots of coffee
BTC consolidates after a significant price spikeBITSTAMP:BTCUSD price has had a slight correction after the previous increase.
Yesterday, the price broke the trendline and the EMA approached, creating a momentum accumulation zone before a strong break - as planned to buy.
Currently, BTC is correcting after the increase, just cutting down the EMA, showing that buying power is weakening, the short-term trend may turn down.
There is no clear signal to enter the order. Continue to observe the price reaction around the EMA and wait for a clear setup before taking action.
You can refer to my previous analysis here:
Please like and comment to support our traders. Your feedback motivates us to produce more analysis in the future 🙏✨

JPY Futures - Can We Take Out The 3rd ExoFade PeakTo clear any confusing for those that dont know, 6J Futures aka JPY/USD, is the inverse of your regular USD/JPY. Got it?
It's currently in a strong uptrend, since the dollar is in a free fall.
We've been taking out the ExoFade peaks and the trend looks juicy. Taking the 3rd pullback bounce of a uptrend is not my favorite thing to do cos each time you get a bounce, the probably of the next of failing goes up significantly cos sellers need to feed their families too lol.
The first bounce in a new uptrend has a higher success rate and with much lower risk required.
The ExoFade peaks are great for setting price targets and prediction, and we can see the last 2 peaks we're successfully taken out. If the trends momentum stays intact, i expect us to take out the 3rd one as predicted.
London session is in a couple of hours, which will inject more volatility and we have unemployment news in the morning, which can disrupt the trend.
We'll see how it goes.

USDCHF higher bullish expecting
OANDA:USDCHF after today's and yesterday's events and SNB from week before, having bullish expectations. Trend based analysis.
SUP zone: 0.79550
RES zone: 0.80800, 0.81200

EURJPY higher bearish expectations
OANDA:EURJPY strong bearish fall we have today and still for next days expecting here bearish continuation.
SUP zone: 173.600
RES zone: 171.500, 170.600
