GOLD → A false breakdown of support will lead to growthFX:XAUUSD is trading within the range of 3370-3270. Since the opening of the session, the price has lost its potential for further decline. There is no news on Friday, so after retesting the liquidity and support zone of 3283-3270, the price is likely to return to growth.
Gold stabilizes near $3,350, but growth is held back by the dollar
On Friday, gold held its ground after recovering, but further growth is limited by the strengthening dollar and hopes for progress in the tariff war negotiations...
Optimism about corporate earnings in the US and easing recession fears are supporting demand for the dollar. However, ongoing uncertainty in US-China relations is keeping interest in gold alive.
Markets are waiting for new signals from the White House and the Fed, which will determine the further movement of gold prices towards the end of the week.
Focus on supporting the trading range. A false breakdown of 3283-3270 could change the balance of power, leading to a rebound or growth.
Resistance levels: 3314, 3342, 3370
Support levels: 3283, 3270, 3244
There is no news today, except for the unpredictable Trump and the general situation with the tariff war. Any speech or tweet could shake the market. However, after a neutral week, gold remained within the range, and the market is likely to keep the metal within the flat on Friday. Accordingly, I expect a rebound from support and growth to the intermediate resistance lines indicated above.
Best regards, R. Linda!
Triangle

SOL / USDT Update - Breakout in Play! Check out the 1H chart for SOLUSDT. Solana is showing strength in a rising channel, with a recent breakout from a symmetrical triangle to support at $150.
If we break to $165, we could see a strong move higher. But if rejected, watch for a pullback to $150 or lower.
What’s your take?

Bitcoin Blasts to $95,800: Next Stop $96,500?Bitcoin is on FIRE! Just hit $95,800 & climbing in a perfect rising channel!
Breakout after breakout — next stop $96,500?
Check the 1H chart but beware of potential pullbacks!


Altcoin Market Update – April 24, 2025As of today, the TOTAL3 Index (excluding BTC & ETH) offers key insights into the altcoin market:
⸻
Technical Overview:
• 1D: -1.54% → Minor pullback
• 1W: +6.37% → Bullish momentum
• 1M: -4.14% → Mid-term correction
• 6M: +32.94% → Strong growth
#TOTAL3 remains above $790B, a critical support. Holding this level is vital for future altcoin rally targets like $1.16T and beyond.
Bullish divergence on the TOTAL3/BTC chart hints at altcoins gaining strength over BTC.
⸻
Fundamentals:
• The global crypto market cap is $3.03T
• BTC & ETH dominate, but TOTAL3 reflects altcoin potential
⸻
Summary:
Altcoin market remains optimistic, with solid long-term signals. Keep an eye on support zones and momentum indicators for your trading strategy.

Pull back SPYBought some puts for 04/29 strike 439. Too much resistance above, looks like is going to be a rejection. Tight SL at 550.

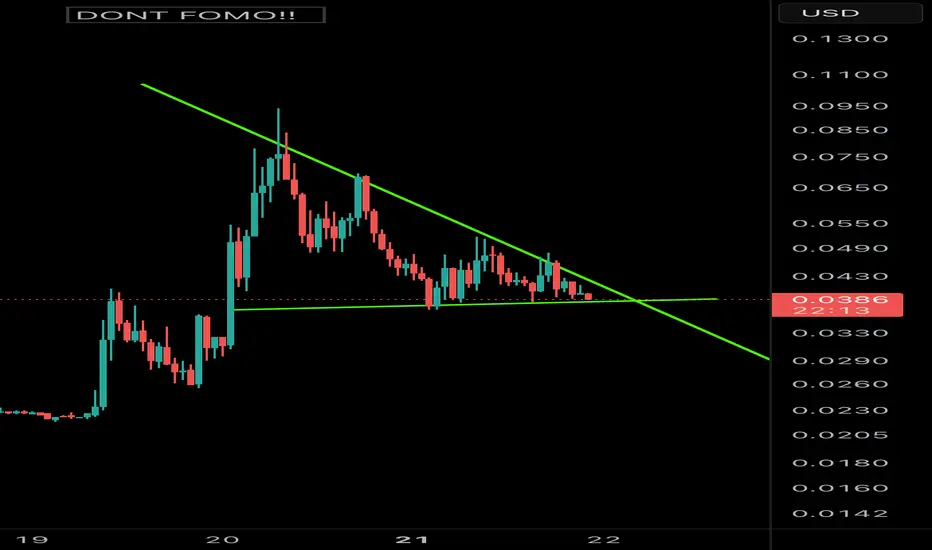
1000RATS/USDT: 100%+ PROFIT POTENTIAL SETUP!!🚀 1000RATS Breakout Alert – 100%+ Potential Incoming?! 👀🔥
Hey Traders! If you're all about high-conviction plays and real alpha, smash that 👍 and tap Follow for more setups that actually deliver! 💹💯
1000RATS has officially broken out of a beautifully formed Cup and Handle pattern — a strong bullish continuation signal. This setup has been building over weeks and is now looking ready for the next explosive leg.
🔍 Previous move from the same base delivered a 106% pump — and this breakout structure hints at another big potential.
🔹 Technical Highlights:
Breakout above neckline with volume
Holding above EMA support
Textbook Cup & Handle with ascending base
📍 Entry: Current Market Price (around $0.032) and add more in dip
🎯 Targets:
• Target 1: $0.045
• Target 2: $0.055
• Target 3: $0.061+
🛑 Stop-loss: $0.029
⚙️ Risk: Use proper risk management — 3x–5x leverage recommended
💬 Watching closely for follow-through — if momentum sustains, this can be a massive mover. What are your thoughts?

XAUUSD TRIANGLE PATTERN IN 30-MI Created This XAUUSD Chart Analysis In 30-M Tf
Entry: BUY from 3338
Support zone : 3334
Target Will Be : 3370
NOTE : XAUUSD MADE TRIANGLE PATTERN SO THIS ANALYSIS IS BASED ON PERSONAL ANALYSIS FOR LEARNING PURPOSES. PLEASE USE PROPER RISK MANAGEMENT

GOLD → Reversal or correction? What to do now?FX:XAUUSD reaching the psychological high of $3500 has entered the correction phase, which was also influenced by a slight easing of the tariff conflict between the U.S. and China....
After falling without reaching the zone of interest 3288, the gold price is strengthening at the beginning of the European session, expecting PMI data from the U.S.. Earlier, the metal reached a record of $3,500, but rolled back amid hopes for an easing of the trade war with China and words of the US Treasury Secretary about a possible “détente”.
The dollar recovered as part of the correction, but investors doubt Trump's predictability, gold at this time begins a correction. In the center of attention is the PMI index from S&P Global: its results may affect expectations for Fed Funds rates and give a new direction to the market.
Resistance levels: 3340, 3360, 3366
Support levels: 3317, 3288
Technically gold is in correction and confirms the bearish structure. But any unexpected statement by Trump may attract aggressive buying.
Nevertheless, we should now consider a possible decline from 3340 - 3360 - 3366. Buying could be considered on a retest of support or a close above 3370.
Regards R. Linda!

Gold Educational PostGold Educational Post.
Trendline Breakout 1st Confirmation.
Ascending Triangle Make 2nd Confirmation.
Breakout With Bullish Candle 3rd Confirmation.


HelenP. I Bitcoin may drop from resistance zone to $84K pointsHi folks today I'm prepared for you Bitcoin analytics. After spending several days consolidating below the resistance area, Bitcoin finally pushed higher and retested the 87500 level. This resistance was already confirmed multiple times in the past, and now it aligns perfectly with the upper boundary of the resistance zone at 88200 - 87500. The price made a sharp rally toward that level after bouncing from the support zone at 81200 - 80500, where bulls managed to defend the trend line. Currently, BTC is trading just under the resistance zone, showing early signs of rejection and slowing momentum. The price structure still respects the trend line from below, but the positioning beneath resistance, combined with the triangle formation, suggests potential exhaustion at the top. Given the repeated tests of resistance and the overall pattern, I expect BTC to decline from this level and move down, breaking the trend line and exiting the triangle pattern. For this case, I set my goal at the 84000 points. If you like my analytics you may support me with your like/comment ❤️

Using Bitcoin to boost AVAX trade successIn this video, I’ll show you tactics I use where a trigger in Bitcoin helps build confidence in an AVAX position. I combine a large descending triangle with a smaller ascending triangle to size up aggressively with a strong risk-reward ratio, staying heavy long to maximise upside in a bullish market.
This content is not directed to residents of the EU or UK. Any opinions, news, research, analyses, prices or other information contained on this website is provided as general market commentary and does not constitute investment advice. ThinkMarkets will not accept liability for any loss or damage including, without limitation, to any loss of profit which may arise directly or indirectly from use of or reliance on such information.

SUSDTHello to all AMKT friends, I hope you had a good day.😍
Let's move on to the analysis of Coin S.
In the monthly timeframe, we do not have specific data due to the newness of the project.
But in the weekly timeframe, we are involved in the box range between the prices of 0.4385 and 0.5497, and exiting this box range along with increasing volume can cause a sharp move, and because of the recent days when the market has been bullish, we know that the probability of exiting above the box range is higher.
In the daily and 4-hour timeframe, we also exited the descending triangle pattern, and usually after this event we see a range and then an upward move. So for a long position, we can enter a long position after breaking 0.5497 and increasing volume.
Have a good and profitable day

BTCUSDT TRIANGLE PATTERN IN 30-MI Created This BTCUSDT Chart Analysis In 30-M Tf
ENTRY LEVEL. 84600
Resistance zone : 84800
Target Well Be : 82800
BTCUSDT made Triangle Pattern, It's Take Resistance BTC went to Downtrend Soon

Macro Quarterly Chart of NZ50G (NZX50)Big picture view of NZX 50 Index
NZ50G Quarterly Chart
Basic Elliott Wave - 8 wave structure shown... with where I think we are now
We appear to be in a long term 5 wave trending move higher
Currently within a choppy wave 4 structure that is near completion of a triangle pattern
Triangle patterns are typically Wave 4's and lead to continuation of the trend that proceeded it
Therefore its quite likely we will base out somewhere around the 11,000 point mark (Currently at 12,116) before finding some support and moving higher
I suspect this could lead to a large 30-50% move higher, but then expect things to get choppy and sideways for a number of years... as its going to take a lot of time to correct this 15 year trend, at least 5 years...
Am looking for buy levels on some key levels on NZX stocks to start loading up long term multi year positions

USDCHF: One More Bearish Wave Ahead?! 🇺🇸🇨🇭
It looks like USDCHF has successfully completed a consolidation
after quite an extended bearish rally.
A breakout of a support line of an ascending triangle pattern
on a 4H time frame provides a strong bearish confirmation.
We can expect a movement down at least to 0.81 level.
❤️Please, support my work with like, thank you!❤️
I am part of Trade Nation's Influencer program and receive a monthly fee for using their TradingView charts in my analysis.

GOLD → Correction after reaching 3500. What's next?FX:XAUUSD updates high to $3,500 amid Trump's attacks on the Fed, we are still in the aggressive trend phase. North train makes a small stop which may give us a chance to trade...
Investors are fleeing to safe-haven assets amid an escalating US-China trade war and Trump's verbal attacks on Fed chief Powell.
Trump is blaming the Fed for the slowing economy and demanding immediate rate cuts, which is undermining confidence in the dollar and boosting demand for gold.
3500 is a psychologically important target and once it is reached, traders have moved to profit-taking, which could lead to a small correction...
Resistance levels: 3475, 3500
Support levels: 3441, 3408, 3385
As part of the correction, the price may test 3440, or 3410. The trend is aggressively bullish and sales should not be considered. The ideal scenario would be liquidity capture relative to 3410 and rebound or continuation of growth, as the fundamental background is on the side of gold....
Regards R. Linda!

GOLD → The rally continues. Waiting for correction to tradeFX:XAUUSD supported by the weakness of the dollar and increased trade tensions between the U.S. and China continues to renew highs. At the moment the market is testing 3400...
After Friday's pullback caused by profit taking, the demand for gold rose again - investors are looking for protection amid the threat of recession in the U.S. and instability in the markets. Additional pressure on the dollar is exerted by the threat to the independence of the Fed, after statements about the possible resignation of Jerome Powell.
It is not worth buying at the highs. Technically, against the background of the uptrend, the market can take a break in the form of a pullback. A bounce from support or a false breakdown of the liquidity zone may provide a good opportunity to enter the market
Resistance levels: 3400, 3410, 3430
Support levels: 3369, 3357, 3344
Undoubtedly, based on the overall fundamental situation, gold is absorbing capital as a safe haven and can continue its growth for a long time. But we should keep an eye on the situation between the US and China, as well as in Eastern Europe. Any de-escalation of the conflict may lead to a correction.
For trading now it is worth waiting for a correction to the above mentioned support levels to find a trading opportunity.
Regards R. Linda!

BITCOIN → Retest 86190. There are chances for growthBINANCE:BTCUSD is starting to show positive signs, but it is too early to talk about a change in the downtrend or a bullish rally. Strong resistance ahead....
Against the background of everything that is happening, from a fundamental point of view, bitcoin in general has withstood the blows quite well and is gradually beginning to recover, but the situation for the crypto community as a whole has not changed in any way, the promises are not yet fulfilled. Bitcoin's strengthening is most likely due to localized growth in indices and discussion of lower interest rates. But the focus is on the tariff war between China and the US, improved relations and lower tariffs could weaken bitcoin.
Technically, we see that the price is moving beyond the resistance of the descending channel. For a few days now, the price has been consolidating in front of the 86190 level, and we have chances to see a rise to the resistance of the 88800 range, from which the future prospects will already depend.
Resistance levels: 86190, 88800, 91280
Support levels: 83170, 78170
The price is slowly approaching the resistance 86190, consolidating without updating the local lows, forming a pre-breakout consolidation. There is a probability of a breakout attempt. Breakout and consolidation of the price above 86190 may give a chance to rise to 88800.
But, regarding 88800 we will have to watch the price reaction. A sharp approach with the purpose of primary testing of the level may end in a false breakout and correction....
Regards, R. Linda!

If the market reaches the $88,490 level, we'll look for selling.BTCUSDT Weekly Analysis: Navigating the Range-Bound Market
Bitcoin (BTC) is currently trading in a range-bound market, showcasing a delicate balance between buying and selling pressures. As traders, it's essential to identify key levels and potential trading opportunities.
Key Selling Area: $88,490
We've identified a crucial selling area at $88,490, where sellers are actively participating. This level has the potential to cap upward movements, and we're waiting for the market to reach this zone.
Trading Strategy:
1. Sell Setup: If the market reaches the $88,490 level, we'll look for selling opportunities, targeting lower levels and taking advantage of potential downward momentum.
2. Alternative Scenario: If the market doesn't reach the $88,490 zone, we'll wait for a clear breakdown from the current range, with a candle closing below the range. This would signal a potential shift in market sentiment.
Market Outlook:
The range-bound market presents both challenges and opportunities. By monitoring key levels and waiting for confirmation, we can make informed trading decisions and navigate the markets effectively.
What to Watch:
1. $88,490 Level: A key selling area that could determine the next move.
2. Range Boundaries: Monitoring the current range and waiting for a breakdown or breakout.
3. Market Sentiment: Keeping an eye on market sentiment and adjusting our strategy accordingly.
By staying vigilant and adapting to market conditions, we can capitalize on potential trading opportunities and navigate the complexities of the cryptocurrency market.

BITCOIN - Price can little correct and then make impulse upHi guys, this is my overview for BTCUSDT, feel free to check it and write your feedback in comments👊
Recently price broke through the $79500 zone after a long phase of flat consolidation and sharp shakeout.
Once bulls reclaimed control, price formed a clean breakout and started building structure inside a wedge.
Momentum carried the price upward, with buyers defending each local dip and creating a stair-step rise.
Now BTC is moving steadily inside the wedge pattern, holding the lower trendline with no strong rejection.
Price is slowly grinding toward the key resistance around $88500, where volatility might return.
If this tempo holds, I expect BTC can grow higher and tag the $91000 points in the next impulsive leg.
If this post is useful to you, you can support me with like/boost and advice in comments❤️
