How Gold Could Be Affected by Possible Iran Conflict? Gold begins the new day on a bullish note following escalating developments in the Middle East. Yesterday, markets were focused on the US–China deal. Although an agreement was reached, tariffs but overall trade tensions remain elevated. Combined with the lower-than-expected core CPI, gold mostly moved sideways, apart from intraday noise. However, this could change in the days ahead.
US–Iran nuclear negotiations appear to be stalling. A new round of talks is scheduled for Sunday, June 15. The negative newsflow escalated with Iran’s defense minister warned that US bases in the region could be targeted if conflict breaks out. US ordered all non-essential personnel to evacuate and approved the voluntary departure of military family members from the region. Simultaneously, reports surfaced that "Israel is ready to strike Iran."
The negative newsflow continued today. The International Atomic Energy Agency passed a resolution declaring Iran non-compliant with its international obligations. In retaliation, Iran announced it would build a new uranium enrichment facility at a hidden and secure location and unveiled plans for new military drills.
The timing of this escalation raises the risk of direct conflict. Netanyahu’s government is facing collapse, with the possibility of new elections looming. At the same time, Iran is nearing nuclear weapons capability. While Trump is more openly supportive of Israel than Biden, he is reluctant to involve the US in any direct or indirect conflict. This dynamic raises the chances of an Israeli strike on Iran.
Adding to the tension is the upcoming July 9 deadline for tariffs. Trump intends to send unilateral tariff agreements to trade partners with a “take it or leave it” approach. This could sharply increase trade tensions and further support gold prices.
Today's news flow is heavily bullish for gold, and the technical outlook aligns with it. The triangle formation has broken, and gold has retested the upper boundary, gaining momentum from that level. If current risk levels remain elevated, especially if multiple strikes on Iran occur, a medium-term move above 3600 could begin.
Despite the strong bullish setup, we are in a market where sentiment can shift in minutes, with major news emerging almost daily. In this environment, it's crucial to define key levels and indicators for risk management. At the moment, the 50-day EMA appears to be holding well as a support level. This moving average could be the final line that determines the medium-term direction for gold. If it breaks, the bullish outlook may no longer be valid.
Triangle

GBPUSD looks ready for its next up-legGBPUSD broke above key levels, triggering a double top pattern with targets near 1.4778. In this video, we discuss risk-reward adjustments, why reducing your stop makes sense, and how to deal with sideways markets and small triangle setups. Learn why taking smaller profits can sometimes lead to better long-term results. Leave your thoughts in the comments.
This content is not directed to residents of the EU or UK. Any opinions, news, research, analyses, prices or other information contained on this website is provided as general market commentary and does not constitute investment advice. ThinkMarkets will not accept liability for any loss or damage including, without limitation, to any loss of profit which may arise directly or indirectly from use of or reliance on such information.

GOLD → Strengthening and return to range. Focus on 3340FX:XAUUSD is forming a fairly strong support zone (a cascade within an upward line). The price is returning to the range, with bulls storming 3330-3340.
Markets are awaiting US inflation data (CPI), which may affect expectations for a Fed rate cut in September (chances are about 52%). Optimism following progress in US-China trade talks is supporting sentiment, but uncertainty remains due to a court ruling allowing Trump to maintain tariffs. This is holding back the dollar and helping gold. CPI forecast: 0.2% growth, core inflation 0.3%. Lower inflation, on the other hand, will support expectations of lower rates and strengthen demand for gold as a safe-haven asset.
Technically, gold is stuck between the boundaries of a symmetrical triangle. Overall, this situation is reflected in all markets. Consolidation is forming and the price could break out in either direction...
Support levels: 3301, 3330, 3340
Resistance levels: 3349, 3361, 3375
Focus on the boundaries of the previous range - 3330 - 3340. If the bulls, after the assault, manage to hold their ground above this zone, the market may take the initiative due to support and continue its growth towards areas of interest.
Best regards, R. Linda!

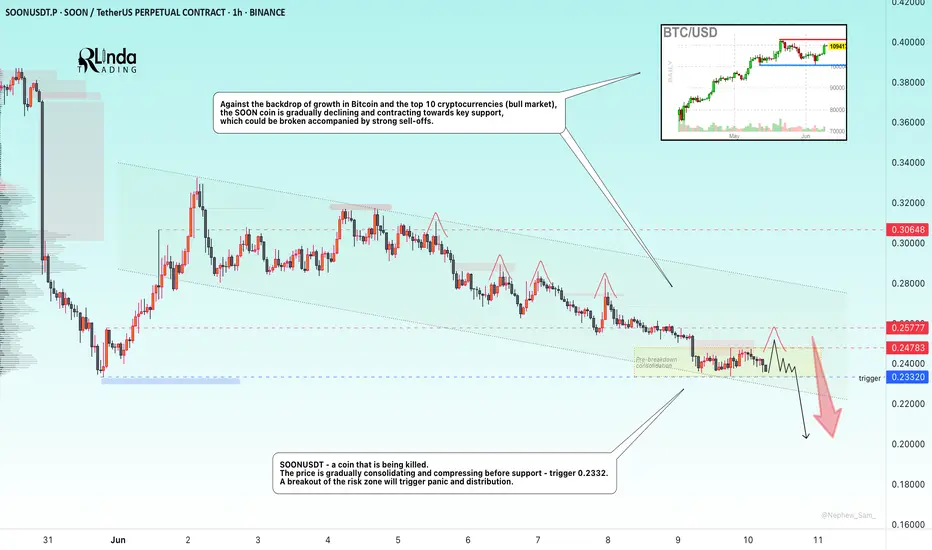
SOONUSDT → The coin that gets killed...BINANCE:SOONUSDT.P is under pressure. The coin looks extremely weak against the backdrop of a bullish market, with key support ahead, separating traders from the panic zone and a sharp decline
This coin is being killed. The price is gradually consolidating and compressing before support - the trigger is 0.2332. Against the backdrop of the overall decline that the market has experienced after a slight impulse from 0.2332, shocks are forming with the aim of capturing liquidity (red check marks). This generally indicates that large players are gathering a bearish position. A breakout of the risk zone will trigger panic and distribution.
Against the backdrop of growth in Bitcoin and the top 10 cryptocurrencies (bull market), the SOON coin is gradually declining and contracting towards key support, which could be broken accompanied by strong sell-offs.
Resistance levels: 0.2478, 0.25777
Support levels: 0.2332
If the coin continues to contract towards the 0.2332 support and form a pre-breakdown consolidation, there will be little chance of survival. In the short and medium term, I expect prices to fall.
Best regards, R. Linda!
AUDUSD → Correction after a false breakout before growthFX:XAUUSD continues to rise amid uncertainty surrounding the dollar, which continues to consolidate. The currency pair is preparing to test resistance at 0.6537
The dollar is stuck in place due to market uncertainty. At the same time, the Australian dollar is strengthening and is ready to test the liquidity zone
Within the current trend, the currency pair is heading towards resistance and the liquidity zone. We opened far away, and as we move towards the target, the potential for further growth may end. A false breakout of 0.6537 could trigger a correction
Resistance levels: 0.6537
Support levels: 0.6509, 0.6479
A sharp move towards resistance without the possibility of further growth could cause a false breakout of 0.6537. Price consolidation below this level could trigger a correction before growth.
Best regards, R. Linda!

ETHEREUM → Consolidation amid a bull marketBINANCE:ETHUSD is consolidating in the range of 2400-2750, and locally, the coin looks quite promising even against the backdrop of Bitcoin forming a correction...
ETH is forming a strong consolidation within which it confirms a bullish market structure. After a false breakout of resistance, there is no sharp decline and the price returns to retest resistance.
If the bulls hold their defense above 2530-2550, then in the short and medium term, ETH may demonstrate growth towards the intermediate target.
Resistance levels: 2738, 2855
Support levels: 2525, 2470, 2400
A retest of support at 2525 - 2470 is possible, and if the price holds above this support zone, ETH may try to surprise us. There are good chances for growth.
Best regards, R. Linda!

Layout TestHello World
HTF - 1h timeframe on left
LTF - 10s timeframe on right
FVG zones and Volume Profile
Key Levels

S&P500 INDEX (US500): More Growth Ahead
US500 broke and closed above a neckline of an ascending triangle
pattern on a daily time frame.
It is a strong bullish pattern that indicates a strong bullish interest.
With a high probability, buyers will push at least to 6124 resistance.
❤️Please, support my work with like, thank you!❤️

HelenP. I Gold may bounce from trend line to resistance levelHi folks today I'm prepared for you Gold analytics. After observing this chart, I see that the price tried to grow to the resistance level first, but failed and dropped to the support level, which coincided with the buyer support zone. After this correction movement, XAU rebounded up and then dropped below the support level, breaking it. But soon, price turned around and made impulse up, breaking the 3265 level, after which it continued to move up to the resistance level. When Gold reached this level, it entered to resistance zone, where it turned around at once and made a strong movement down to the trend line, breaking two levels. Also then it started to trades inside a triangle, and soon turned around from the trend line and made a strong impulse up. Price broke the 3265 support level one more time, rose a little more, and then made a correction. After this, price continued to move up and soon reached the 3395 resistance level, after which it turned around and fell to the trend line, which is the support line of the triangle as well. Recently, it started to grow, so I expect that XAUUS will correct to the trend line and then continue to move up to the resistance level. That's why the 3395 resistance level is my current goal. If you like my analytics you may support me with your like/comment ❤️
Disclaimer: As part of ThinkMarkets’ Influencer Program, I am sponsored to share and publish their charts in my analysis.

AMBER | Buy above 6750 | SL below 6100 | Target 9696Disclaimer:
This is not financial advice. Please do your own research or consult with a financial advisor before making any investment decisions. Investments in stocks can be risky and may result in loss of capital.

Natural gas poised for breakoutNatural gas prices are compressing inside a small ascending triangle, but this is only part of a larger pattern pointing to even greater upside. This video explains why natural gas could be the market to watch in the coming weeks.
This content is not directed to residents of the EU or UK. Any opinions, news, research, analyses, prices or other information contained on this website is provided as general market commentary and does not constitute investment advice. ThinkMarkets will not accept liability for any loss or damage including, without limitation, to any loss of profit which may arise directly or indirectly from use of or reliance on such information.

INDUSTOWER at Best Support Zone !!This is the 4 hour chart of INDUSTOWER .
INDUSTOWER having good Law of Polarity at 360-370 range.
The stock is forming a Descending Triangle pattern on th L.O.P at 375 range .
If this level is sustain , then we may see higher prices in INDUSTOWER.
Thank You !!

Doge Double Trouble $0.22 or $0.17 NextTwofer Doge . 10-15% move either way likely based on how bitcoin does.
Breakout
0.224
Breakdown
0.172
Decided to throw this chart together based on my original idea of the end to end cloud touch that is working out well.

Eurusd !!! Ascending Wedge Pattern Signals a Major Reversal! Time': 30 min
Technical analysis:
Ascending Wedge Pattern 📈: A clear ascending wedge signals a potential bearish reversal. The price has just completed Wave ⑤ at the top trendline, a classic trigger point for sellers.
* Elliott Wave Confirmation 🖐️: The wedge contains a perfect 5-wave Elliott structure, reinforcing our bearish bias as the final impulse wave concludes.
* Live vs. Textbook 👨🏫: Our live chart is mirroring the ideal "textbook" example shown, increasing confidence in the setup's validity.
The Trade Plan 🎯
* Entry ▶️: Short position initiated in the "Risk Zone" after rejection from the wedge resistance.
* Stop Loss ⛔️: Placed tightly above the Wave ⑤ high at ~1.14821.
* Take Profit 💰: Targeting the major support level at ~1.12925.
Conclusion ✨
This setup presents an exceptional risk-to-reward ratio. The combination of a reliable chart pattern and Elliott Wave count gives us a high-conviction bearish outlook for EUR/USD.
Disclaimer ⚠️: This is a technical idea, not financial advice. Always use proper risk management. Trade safe!

CHFJPY: Strong Bullish PatternIn line with the current trend, 📈CHFJPY is experiencing a robust bullish momentum.
The next buy signal will come from a bullish breakout of the ascending triangle pattern's neckline on the 4H chart.
A close of a 4H candle above 176.30 will confirm this breakout, with the next target set at 176.60.

ETH/BTC : Ready to Lead the Altcoin Season?Hey Traders!
If you’re finding value in this analysis, smash that 👍 and hit Follow for high-accuracy trade setups that actually deliver!
Ethereum just broke out of a multi-week symmetrical triangle against Bitcoin — a classic continuation pattern! After consolidating for over a month, this breakout could signal a major shift in market dynamics.
Pattern: Symmetrical Triangle
Measured Move Target: +38.7% from the breakout
Timeframe: 12H
Current Ratio: 0.02517 BTC
🔍 Why ETH/BTC Matters for Altcoins:
When ETH/BTC rises, it often marks the beginning of an altcoin rally. Here's why:
✅ ETH leads altcoins — It’s the largest alt by market cap, and capital often rotates from BTC → ETH → mid/small caps.
✅ Rising ETH/BTC = Bitcoin dominance weakening, giving altcoins room to breathe.
✅ Confidence returns to the broader alt market when ETH outperforms BTC.
If this breakout sustains, we may be entering a strong altcoin season. Keep an eye on ETH strength and look for high-potential setups across the altcoin board!
What are your top altcoin picks for this potential rally? Drop them below 👇

HelenP. I Gold may break support level and continue to move downHi folks today I'm prepared for you Gold analytics. Observing this chart, we can see how the price reached support 2, which coincided with the support zone and tried to break it, but failed and dropped below. Then Gold turned around and made an impulse up, broke firstly 3125 level first and then reached support 1 and broke it too. After this movement, Gold continued to grow and reached the trend line, after which it started to decline inside a triangle pattern, where it first fell below support 1, making a first gap. Next, Gold tried to back up, but failed and dropped to support 2, after which it started to grow. In a short time, XAU rose to support 1, broke it, and some time traded between this level. Not long time ago, it rose to the trend line, which is the resistance line of a triangle as well, and then fell to the resistance zone. So, I expect that XAUUSD will break the support level and then continue to fall, thereby exiting from triangle too. For this case, I set my goal at 3225 points. If you like my analytics you may support me with your like/comment ❤️
Disclaimer: As part of ThinkMarkets’ Influencer Program, I am sponsored to share and publish their charts in my analysis.

MarketBreakdown | EURUSD, AUDUSD, USDCHF, EURCAD
Here are the updates & outlook for multiple instruments in my watch list.
1️⃣ #EURUSD daily time frame 🇪🇺🇺🇸
Though the pair remains quite weak for the last few days,
I strongly believe that bulls have unrealized potential.
The pair may continue rising and reach the underlined yellow resistance soon.
2️⃣ #AUDUSD daily time frame 🇦🇺🇺🇸
The price is testing a significant horizontal resistance.
Its bullish breakout will provide a strong bullish signal.
The pair will go way higher then.
3️⃣ #USDCHF daily time frame 🇺🇸🇨🇭
The price is stuck within a narrow consolidation range.
I think that a sideways movement is going to continue
and the price will drop to the support of the range soon.
4️⃣ #EURCAD daily time frame 🇪🇺🇨🇦
The price action is contracting within a symmetrical triangle pattern.
Such a pattern signifies a deep indecision.
A breakout of one of its boundaries will indicate the side of the next market move.
Do you agree with my market breakdown?
❤️Please, support my work with like, thank you!❤️
I am part of Trade Nation's Influencer program and receive a monthly fee for using their TradingView charts in my analysis.

RAIN INDUSTRIES at Good Support.This is 4 hour chart of RAIN INDUSTRIES.
Stock is forming a Symmetrical Triangle Pattern.pattern lower boundary expected to act as a strong support level 142-145.
IF this level is sustain , then we may see higher prices in Rain industries.
Thank You !!

NESCO at Resistance zone !!This is the Daily Chart of NESCO.
Nesco having good law of polarity at 1050 range.
NESCO is forming a pattern near its L.O.P, characterized by the development of an Ascending Broadening Wedge. The resistance zone for this formation is positioned between 1050 and 1060 levels
if this level is sustain, then we may see lower prices in NESCO.
THANK YOU !!

GOLD → Correction before a decline or continuation of the trend?FX:XAUUSD is testing the liquidity zone during the Asian session and forming a false breakout. The metal is recovering, but the fundamental background remains unstable...
On Monday, gold is holding steady at around $3,300 amid a weaker dollar and caution among traders ahead of US-China talks and the release of US inflation data (CPI) on Wednesday. Strong NFP data for May strengthened the dollar and lowered expectations for a Fed rate cut. However, domestic problems in the US are putting pressure on the currency... Markets are adjusting positions ahead of CPI. Geopolitics and domestic unrest in the US are holding back gold's decline, despite possible optimism about a trade deal.
Technically, the trend is bullish, with the price previously breaking the structure but rising in the Asian session after a false breakdown of the order block and the 3300 liquidity zone. Further movement depends on 3330 - 3340
Resistance levels: 33301, 3339, 3375
Support levels: 3301, 3275
The price is heading towards 3330-3340 for a retest. If the dollar continues to decline and gold manages to consolidate above 3340, the bullish trend may continue. BUT! A false breakout of the 3330-3340 zone could trigger a further decline after the bullish structure breaks down.
Best regards, R. Linda!

Usdjpy|| — the next move could be explosiveUSD/JPY
Timeframe: 2H
Strategy: Elliott Wave + Triangle Pattern + Fair Value Gap (FvG)
Formation: Contracting Triangle – Wave (a) to (e)
Risk-Reward: High Conviction Setup
Status: On the verge of breakout
🔍 Technical Breakdown:
The chart shows a classic contracting triangle pattern with completed internal waves (a)-(b)-(c)-(d)-(e).
Price is reacting near wave (e), signaling a potential bullish breakout.
A clean Fair Value Gap (FvG) zone lies just below current price — possible last dip before the breakout surge.
Target zone = 148.874, derived from the triangle's height projected from breakout point.
Strong confluence with liquidity hunt below before expansion move.
🎯 Target: 148.874
🛑 Stop Loss: Below 142.738 (SI Level / structural low)
🟢 Entry Trigger: Breakout above trendline + retest confirmation or Smart Money entry at FvG
This setup aligns with Elliott Wave triangle theory, often seen before sharp impulse waves. Smart Money is likely filling orders in the FvG zone before the upward expansion.

"GBP/USD is cooking inside a trianglePair: GBP/USD
Timeframe: 4H
Strategy: Elliott Wave + Triangle Pattern + Breakout
Formation: Contracting Triangle – Wave 1 to 5
Risk-Reward: High Probability Setup
Status: Pre-breakout phase
🔍 Technical Breakdown:
A clean contracting triangle is forming, completing all 5 internal waves within the structure.
Wave 5 looks exhausted and price is rejecting trendline resistance.
Expecting a bearish breakout from the triangle.
Target zone = 1.34759, aligning with previous liquidity + measured move.
Entry area refined with supply zone + minor structure break (as seen in inset schematic).
🎯 Target: 1.34759
🛑 Stop Loss: Above triangle resistance
🟢 Entry Trigger: After breakout + retest or SMC confirmation
This setup matches Elliott Wave’s triangle structure behavior – typically occurring before the final push in a larger correction or continuation.
