EURJPY breakout: Buying dips into BOJ last hike?EURJPY has broken out of a triangle consolidation on the 4-hour chart and is retesting the 182 level as support. With Japan pumping fiscal stimulus into a shrinking economy and the BOJ nearing its cycle peak, the macro setup favours buying dips for a continuation higher.
In this video, we break down why the yen remains weak despite rising yields and an imminent BOJ hike, focusing on the toxic mix of fiscal slippage and soft growth. Then, we map out the technical buy zone between 181.60 and 180.70, targeting a final fifth-wave push toward 183.40 and 185.00.
Key drivers
Japan macro: A massive ¥21.3 trillion stimulus package into a contracting economy (Q3 GDP -2.3% annualised) has spiked yields on debt concerns rather than growth, weighing on the yen.
Central bank divergence: The BOJ is expected to hike next week but signal it's near the terminal rate ("one-and-done"), while the ECB holds at 2%.
Technical structure: We are in a continuation pattern (triangle breakout) that likely marks wave 4 of a larger sequence, implying one last impulse leg higher.
Key levels: Support at 181.60 (161.8% extension of the internal wave) and 180.70 (structural pivot). Upside targets at 183.40 (138.2% extension) and 184.29–185.00 (161.8% extension).
Trade plan: Look to buy dips into the 181.60–180.70 zone with a stop below the previous low, taking partial profits at 183.40 and 184.29, and trailing the rest for a potential extension.
Trading the yen cross breakout? Share your entry levels in the comments and follow for more macro-to-technical trade setups.
This content is not directed to residents of the EU or UK. Any opinions, news, research, analyses, prices or other information contained on this website is provided as general market commentary and does not constitute investment advice. ThinkMarkets will not accept liability for any loss or damage including, without limitation, to any loss of profit which may arise directly or indirectly from use of or reliance on such information.
Trianglebreak

#BCHUSDT — Weekly OutlookBCH has officially broken out of its multi-month descending trendline, and more importantly, we now have a clean confirmation:
a retest of the trendline followed by a strong bullish weekly candle closing back above it.
This is exactly the kind of structure you want to see after a breakout.
🔹 Key Points
✅ Breakout + Confirmation (trendline broken and retested)
✅ Holding above the 50% Fib ($453)
✅ Strong weekly momentum building
✅ Market structure shifting from compression → expansion
As long as BCH keeps closing above the $520–$540 zone, the bullish continuation scenario remains valid.
🔹 Targets
🎯 $680–$720 (first major liquidity pocket)
🎯 $900–$920 (macro resistance + ~78.6% Fib)
🔹 Invalidation
A weekly close back under $499 would weaken the structure and re-open the lower range.

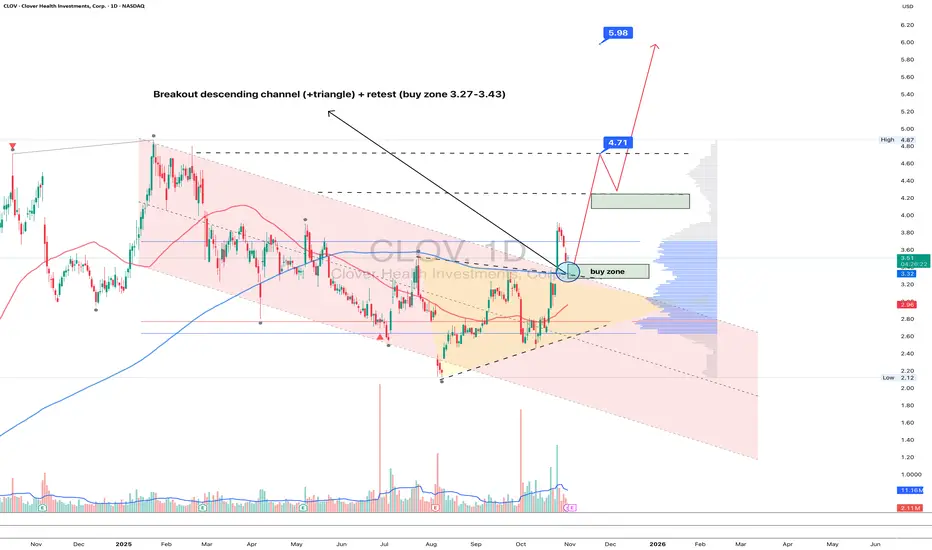
CLOV 1D - Health Is Back in TrendOn the daily chart, Clover Health (CLOV) has broken out of its descending channel and triangle, now pulling back for a retest near 3.27–3.43 - a key buy zone aligned with the MA50. Buyers are clearly regaining control, and the setup looks ready for continuation.
Technically:
– first clean breakout of the downtrend since January 2025;
– volume expansion on bullish candles, suggesting institutional accumulation;
– holding above the former resistance turned support.
Upside targets: $4.71 (local volume peak) and $5.98, offering +70% potential upside if momentum sustains.
From a fundamental perspective, Clover Health is stabilizing its business:
– a leading player in Medicare Advantage, with an expanding senior member base;
– Q3 results show 40% reduction in net loss and +18% YoY revenue growth;
– leveraging AI-driven healthcare analytics to improve efficiency and patient outcomes;
– with high short interest, a confirmed breakout above $4.70 could ignite a short squeeze.
Tactical plan: accumulation near 3.27–3.43, add above 4.70, targets 4.71 → 5.98. Sometimes the healthiest trend is the bullish one.
GBPUSD still bullish expecting
FX:GBPUSD what's next, trend based analysis, we can see break of RECTANGLE, on top line of rectangle we have created and TRIANGL pattern.
From here having still bullish expectations.
SUP zone: 1.31600
RES zone: 1.33400, 1.33800

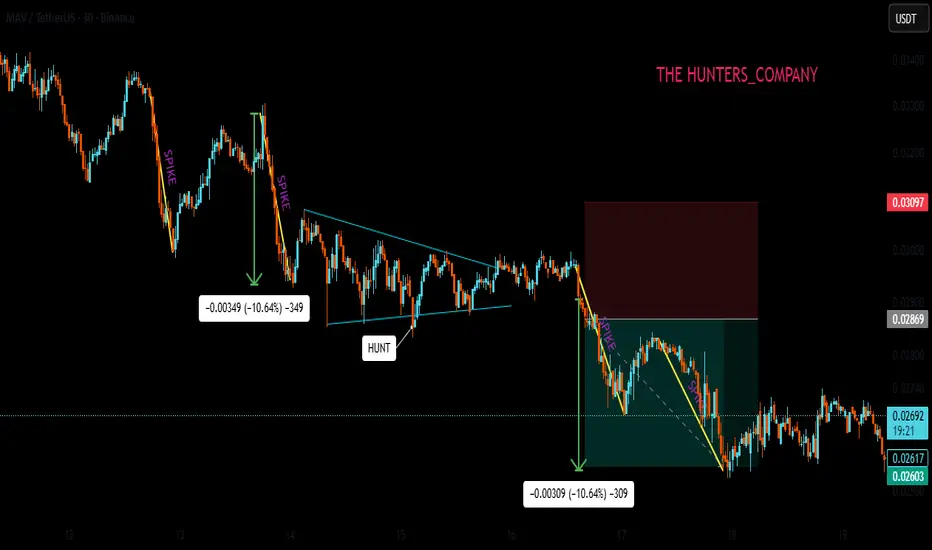
Continuing Triangle PatternHello friends
we are here with a simple strategy tutorial that is a model, but it also requires practice.
Well, whenever we have a structure, whether it is bullish or bearish, it doesn't matter. Now in this example, our structure is bearish and you can see how sharp the spikes that the sellers make are and at one point the price compresses and forms a triangle. Here, considering the bearish structure we have and the strength of the sellers that you see, we expect a decline if the triangle breaks.
Which is the continuation of our downward trend or structure, which we call a continuation triangle, meaning the price continues its previous structure.
The way to trade it is also simple. Just wait for a strong break of the triangle, and when the break is valid and the bottom of the triangle closes, we can enter with a stop loss above the ceiling and a target equal to the previous drop of the triangle, which is the trend move.
Be sure to follow risk and capital management.
*Trade safely with us*
EUR/USD Elliott Wave Update: Wave (iv) Correction UnfoldingThis EUR/USD chart shows the market undergoing a complex corrective phase, labelled as wave (iv), likely forming a triangle pattern (a)-(b)-(c)-(d)-(e) after an impulsive rally. The correction is taking place within a well-defined base channel, suggesting consolidation before a potential breakout into wave (v) targeting higher levels near 1.19–1.20. As long as the channel holds, the Elliott Wave structure supports a bullish continuation once the correction completes.
Keep following for regular breakdowns as the bigger trend unfolds.

Cup & Handle Heading into EarningsNASDAQ:MSFT is forming quite a large cup and handle within a larger symmetrical triangle after closing the week, bouncing off the 20-day EMA. NASDAQ:MSFT 's bollinger bands are squeezing as well as it heads into earnings this week, along with the rest of the Mag 7- Just some support levels and some RSI-based supply and demand zones to keep an eye on - Bullish Long

BTCUSD EMA50 Breaked and bullish trend breakdown (Readmore)..🚨#BTCUSD Technical Update 🚨
📉 Bitcoin shows bearish momentum after a confirmed uptrend breakdown and EMA 50 breach on the 1H timeframe.
🔍 Price action suggests sellers are taking control, with momentum shifting to the downside.
🎯 Selling Targets:
1️⃣ First Target: $106,400
2️⃣ Second Target: $104,500
⚠️ Invalidation: A sustained move back above the EMA 50 could signal a potential recovery — stay cautious and manage risk carefully!
#Bitcoin #BTC #CryptoAnalysis #TechnicalAnalysis #BTCUSD 💰📊

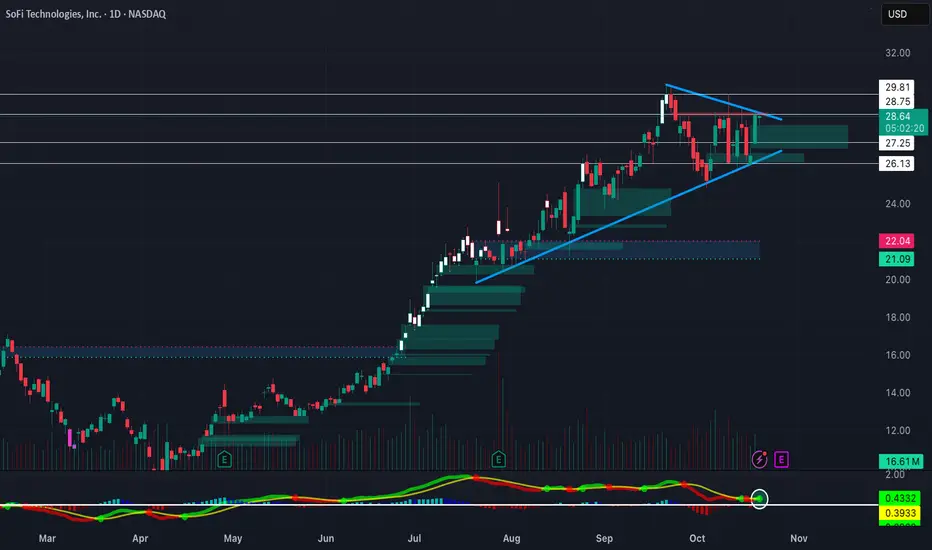
Triangle Break Heading into EarningsNASDAQ:SOFI Forming a big symmetrical triangle on the daily timeframe heading into earnings. EMA's are starting to curl upwards after NASDAQ:SOFI found some support on its 50-day SMA. Bullish long-term on NASDAQ:SOFI , so definitely will be watching this one closely
Gold stuck in Triangleso where to now from here>>!
4500 or 4000?
dollar is weaking more by the day
im rooting for break up but lets see!!

USDCHF 10-year support points to major breakdown to 0.70! USDCHF BREAKDOWN ALERT: Decade-long support shattered – here's why this could be the start of a major move to 0.70 and below!
The Dollar-Swiss Franc pair is setting up for a potentially significant breakdown after breaking decade-long support levels since May. Both fundamental and technical factors are aligning for Swiss franc strength, creating what could be a rare high-probability trading opportunity.
Key Drivers:
Fed Dovish Pivot: Powell's Tuesday signal acknowledged downside risks to job markets, with 97% probability of October rate cuts and two more by December fully priced in
Swiss Franc Strength: CHF has strengthened nearly 9% over the past 12 months, now testing the 0.78 level, while Trump's tariff escalation forces Switzerland to slash GDP forecasts
Technical Breakdown: Multiple analytical methods (range breakouts, Fibonacci projections, and triangle pattern analysis) all point to targets around 0.7417-0.6840, representing potential moves to levels not seen since 2011
SNB Constraints: The Swiss National Bank cannot intervene in forex markets while trade talks are ongoing, meaning the Franc is likely to stay strong by default, with stable inflation data
Don't miss this detailed technical and fundamental breakdown! Like and subscribe for more high-probability forex setups, and drop a comment below with your USD/CHF targets - are you seeing the same bearish signals?
This content is not directed to residents of the EU or UK. Any opinions, news, research, analyses, prices or other information contained on this website is provided as general market commentary and does not constitute investment advice. ThinkMarkets will not accept liability for any loss or damage including, without limitation, to any loss of profit which may arise directly or indirectly from use of or reliance on such information.

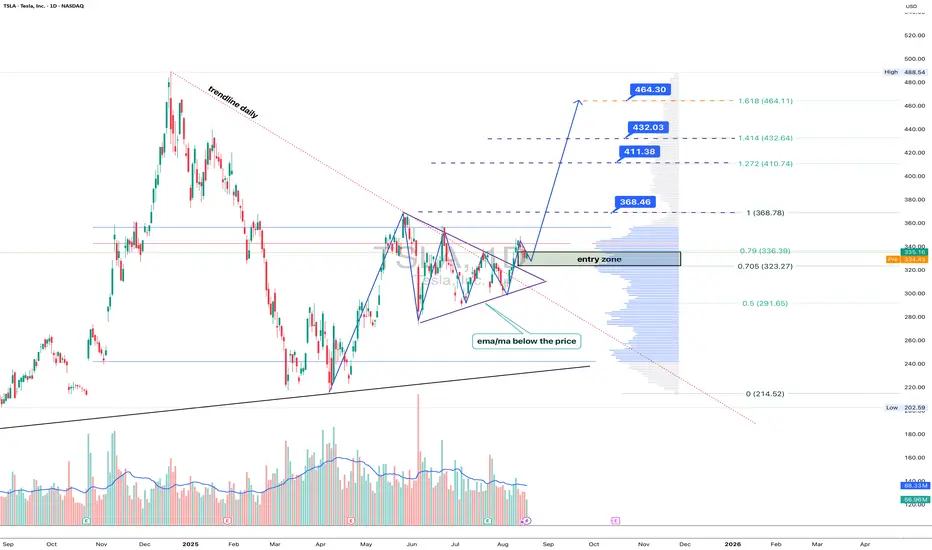
Tesla: breakout mode, Elon’s rocket fuel for the chartTechnically , Tesla broke out of a symmetrical triangle while holding above EMA/MA supports, which confirms bullish control. The breakout unlocks targets at 368.46 (Fibo 1), followed by 411.38, 432.03, and the 1.618 extension at 464.30. Volume profile confirms strong accumulation below, leaving the upside path less crowded.
Fundamentally , Tesla keeps investor attention alive. EV sales stabilized, but the focus has shifted to AI and robotaxi — Musk’s latest promises of disruption. With Fed rates peaking and yields easing, growth stocks regain momentum. Risks remain from Chinese competitors, yet Tesla’s margins are still leading the industry.
Tactical plan : entry zone stands at 323–336. As long as price holds above it, buyers target 368.46 → 411.38 → 464.30. A break below 323 would flip the bias back toward 291.
Bottom line: Tesla’s chart looks ready for lift-off. Musk might be dreaming of Mars, but for now, bulls are happy if he just launches the stock a few hundred dollars higher.
BMNR 4H – cup with handle or champagne glass?The current technical setup on BMNR (4H) shows a potential “cup with handle” structure forming within a clear accumulation zone. Price is holding above both the MA50 and MA200, which are positioned below and confirm buyers’ control. The 4H trendline acts as dynamic support, while the 48–50 zone remains the key entry area. The upside potential extends toward 97.50, making this setup attractive for a medium-term outlook. Volume support during the last bounce favors the bullish case, and RSI recovery from oversold levels suggests renewed demand.
From a fundamental standpoint, BMNR is still tied to the volatility of speculative growth stocks, yet growing investor appetite for niche digital tech solutions and broader market optimism amid potential rate cuts provide a tailwind.
Tactical plan: accumulation from the 48–50 buy zone, with targets at 71.7, 86.2, and a final destination at 97.5.
The structure looks like a champagne glass - now it’s just a matter of waiting for the toast at higher resistance.

Is this a platinum breakout?Using a weekly chart of a platinum ETF.
Breaking out above it's triangle pattern. Needs confirmation though or retrace in the next coming months

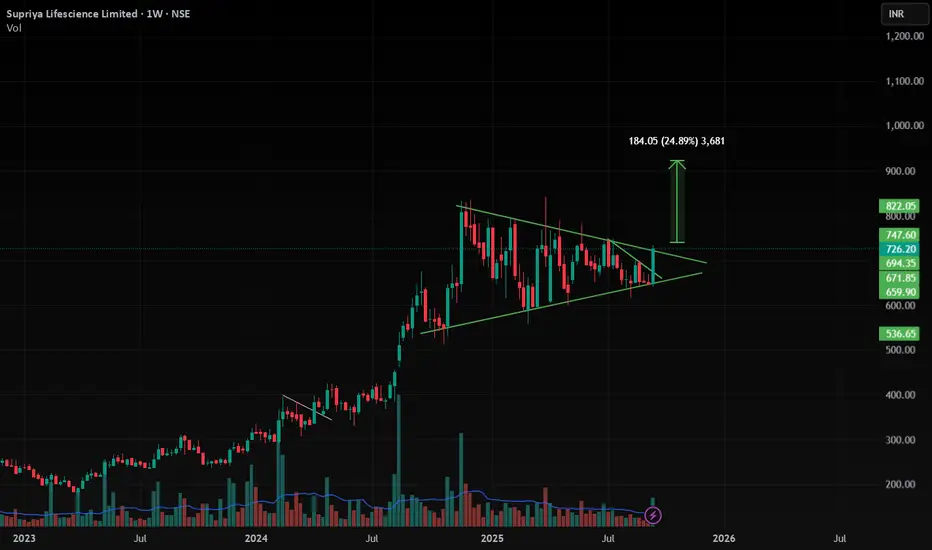
Supriya Weekly Breakout (Triangle)In this stock we clearly see the Triangle pattern is formed and Ready for Breakout , Wait for candle Close in 1D with good volume , then we can see very good move up to 30% nearly .
As now nifty is given Breakout from 1D Channel pattern and in Market Breadth 1D has given breakout and in weekly market Breadth it is near the Resistance , if we see good volume close in this week we can expect Market will be Bullish for next 2-3 Months .
Follow for more Swing Ideas Like This .
boom boom BUMRAH's DeliverySBIN fut broke out of triangle pattern on daily charts with volume of 5.5B & decrease in OI suggesting short covering.
This shortcovering & then long build will take SBIN to mammoth target.
Risk:Reward = 1:2.5
Could b bought with mentioned stoploss & targets.

GALA Ready for 110% Up Move GALA is moving inside Triangle pattern in Weekly , it is at support now , when it came to support it will bounce very strong after a pattern breakout at support .
and at the same time Bitcoin dominance is decreasing and altcoins dominance is started increasing , so look on all the altcoins
and follow proper risk management , it has very good chances to move UP side but first we have to protect the down side , where risk management comes into game .

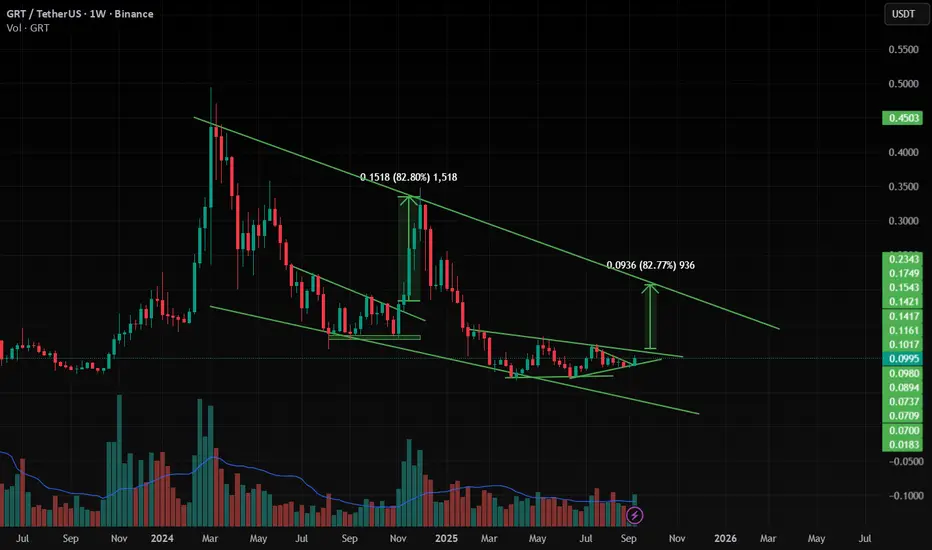
GRT is ready to move 80% Up GRT is moving inside the Triangle or Flag or wedge , and when it is breaking from pattern at support giving good move .
and at the same time Bitcoin dominance is decreasing and altcoins dominance is started increasing , so look on all the altcoins.
and follow proper risk management , it has very good chances to move UP side but first we have to protect the down side , where risk management comes into game .
ANKR/USDT ,1W ( Ready for 140 % Move ) ANKR is moving inside the Triangle pattern and when it comes to support and breaks a pattern then it is very much possible to give very good move.
and at the same time Bitcoin dominance is decreasing and altcoins dominance is started increasing , so look on all the altcoins.
and follow proper risk management , it has very good chances to move UP side but first we have to protect the down side , where risk management comes into game .

GBP/AUD - Triangle Breakout (08.09.2025)The GBP/AUD Pair on the M30 timeframe presents a Potential Selling Opportunity due to a recent Formation of a Triangle Breakout Pattern. This suggests a shift in momentum towards the downside in the coming hours.
Possible Short Trade:
Entry: Consider Entering A Short Position around Trendline Of The Pattern.
Target Levels:
1st Support – 2.0493
2nd Support – 2.0457
🎁 Please hit the like button and
🎁 Leave a comment to support for My Post !
Your likes and comments are incredibly motivating and will encourage me to share more analysis with you.
Best Regards, KABHI_TA_TRADING
Thank you.
Disclosure: I am part of Trade Nation's Influencer program and receive a monthly fee for using their TradingView charts in my analysis.

EUR/USD | Triangle Formation |EUR/USD – Symmetrical Triangle Formation | Elliott Wave Count (ABCDE)
Price action is currently developing within a symmetrical triangle pattern, with waves a–b–c–d–e in play.
Demand Zone (Buyers Zone): Price recently tapped into demand, showing bullish reaction.
Supply Zone 2 (1.1687): Acts as a key resistance level for short-term targets.
Wave Structure: The market is respecting Elliott Wave triangle formation, suggesting a possible bullish breakout after wave e completes.
Plan: Expect consolidation within the triangle before a potential push toward 1.1687. Break and close above may confirm continuation; failure could lead to retest of lower support levels.
📊 This setup aligns with both Elliott Wave theory and supply-demand dynamics, offering clear short-term trading opportunities.

NZDJPY Break and RetestNZDJPY is looking bullish as it broke the consolidation to the upside.
We are waiting for a retest to go long

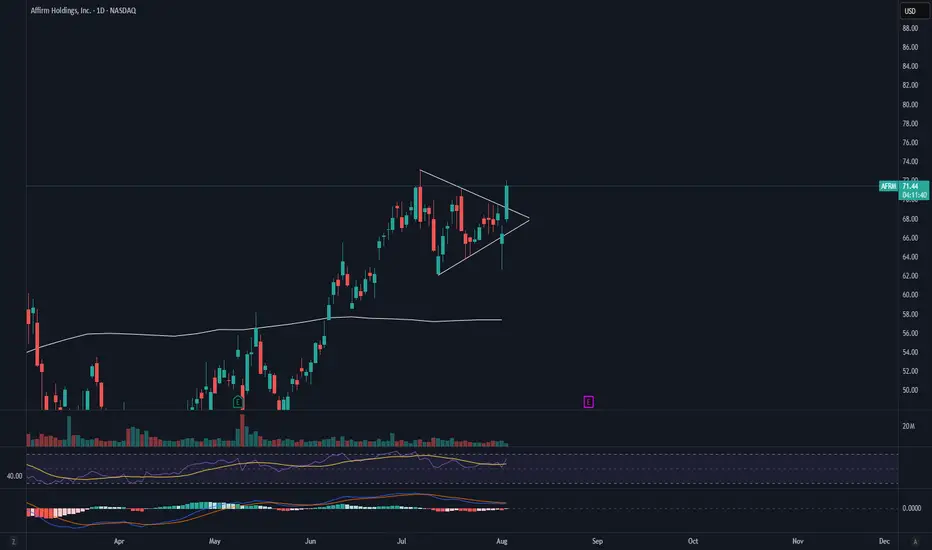
AFRM Pre Earnings Triangle BreakAFRM has broken the symmetrical triangle to the upside. If this holds we could see a strong rally into earnings. I would want to see strong volume added to this equation for the move up to be confirmed.
My STOP on this position would be a daily candle close back under the trendline with confirming volume. A retest of the triangle would be my spot to add to the position.