Trump on the JumpHi friends! How’s your week starting? 🌞
In one of my recent posts, I shared a bearish view on the Trump coin — but the price has broken above my invalidation zone, so that idea has been closed.
Right now, the chart looks more bullish, and I’m watching for a possible continuation to the upside.
🎯 My current targets are around 9.06.
❌ The plan will be invalidated if the price reaches the red zone - 8,123
⚠️ Remember — never trade without stop-losses.
If you enjoy my updates and want to get daily analysis on this coin, make sure to:
💬 leave a comment,
❤️ react to the post,
🔔 and follow me for more regular insights!
Trumptrade

TRUMP : SIGNALHello friends
Given the good growth we had and the entry of buyers, now that the price is correcting and a double bottom pattern has formed, there is a good opportunity to buy with risk and capital management and move towards the specified goals.
*Trade safely with us*

TRUMP Token Ecosystem Expanding – Real Utility Incoming(+30%)?The Official Trump ( BINANCE:TRUMPUSDT ) token has recently shown strong resilience and even outperformed the broader crypto market — and there are several interconnected reasons behind this momentum :
1. Whale Accumulation and Investor Confidence
Large holders have increased their TRUMP balances from roughly 3.97M to 4.88M tokens. This accumulation suggests renewed confidence and long-term positioning by influential investors, providing a strong base of support.
2. Expansion of the Trump Crypto Ecosystem
The ecosystem around Trump-linked assets is growing:
World Liberty Financial, connected to the Trump family, announced a distribution of 8.4M WLFI tokens to users of its USD1 stablecoin on the Enso blockchain.
This strengthens cross-project connectivity and gives TRUMP indirect exposure to new on-chain activity and liquidity.
3. Strategic Business Moves
The TRUMP token issuer, Fight Fight Fight LLC, is reportedly in talks to acquire the U.S. operations of Republic, a regulated investment and crowdfunding platform.
If completed, this deal could:
Add real utility to TRUMP (e.g., payments, fundraising, platform fees).
Expand adoption beyond speculation.
Reinforce the token’s legitimacy within U.S. financial infrastructure.
Summary
While the broader crypto market has dipped, TRUMP is supported by:
Whale accumulation,
Expanding ecosystem ties,
A potential acquisition bringing real-world utility, and
These factors together explain why the TRUMP token could continue to rise — or at least remain relatively strong — even in a weakening crypto environment.
-------------------------------------------------------
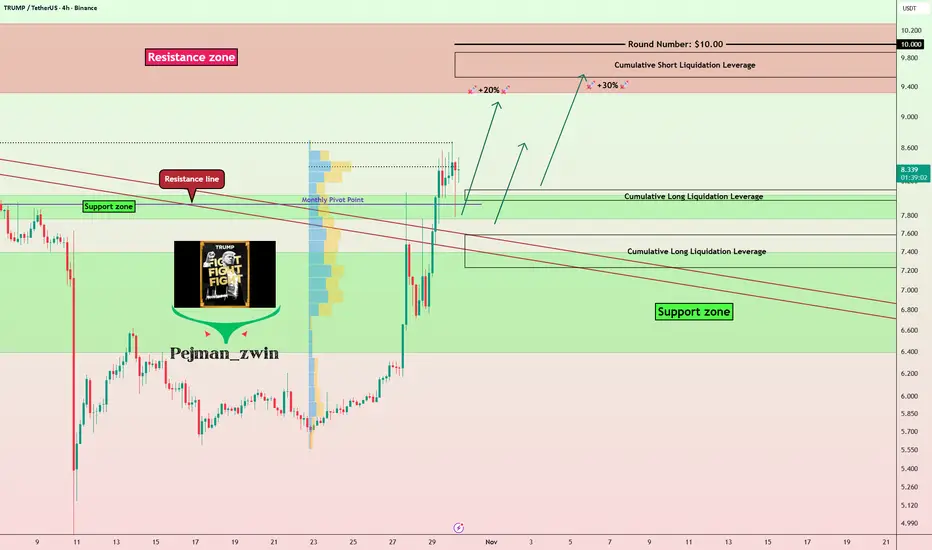
After reviewing the recent news around the TRUMP token , let's take a look at its 4-hour time frame chart.
Currently, the TRUMP token has successfully broken through its Resistance lines with strong momentum and is now moving near a Support zone($8.30-$7.76) and a Cumulative Long Liquidation Leverage($8.10-$7.97) .
I expect that even if the crypto market and Bitcoin ( BINANCE:BTCUSDT ) experience some decline, the TRUMP token might be able to hold its ground thanks to the positive news and the strong momentum it showed when breaking those resistance lines. We could see it potentially rise another +20%/+30% and reach its next Resistance zone($10.30-$9.32) .
Note: A key price level to watch for TRUMP is around $8.70, which has served as both strong support and resistance over the past few months and has been notable in terms of trading volume.
Stop Loss(SL): $7.19(Worst)
Cumulative Long Liquidation Leverage: $7.58-$7.23
Cumulative Short Liquidation Leverage: $9.88-$9.53
Please respect each other's ideas and express them politely if you agree or disagree.
OFFICIAL TRUMP Analyze (TRUMPUSDT), 4-hour time frame.
Be sure to follow the updated ideas.
Do not forget to put a Stop loss for your positions (For every position you want to open).
Please follow your strategy and updates; this is just my Idea, and I will gladly see your ideas in this post.
Please do not forget the ✅' like '✅ button 🙏😊 & Share it with your friends; thanks, and Trade safe.
$TRUMP : Early Rally Before Market News💥 Looks like grandpa $Trump 🧓 knows something we don’t!
Seems he “gave the signal” to start pumping his token before the positive news hits the market 😏
🕗 Big announcements expected today and tomorrow — and that could seriously shake things up.
📊 Honestly, if someone showed us the OKX:TRUMPUSDT chart without saying what it is, we’d say there’s clear upside potential — at least up to $16.
⚖️ What do you think — is this the start of a new pump, or just a quick spike before a dump?
______________
◆ Follow us ❤️ for daily crypto insights & updates!
🚀 Don’t miss out on important market moves
🧠 DYOR | This is not financial advice, just thinking out loud.

TRUMP : SIGNALHello friends
According to the growth we had, you can see that the price has fallen to the same level as this channel and the price is well supported. Now that the price is well supported, we can buy in steps in the specified areas with capital and risk management and move with it to the set goals.
*Trade safely with us*

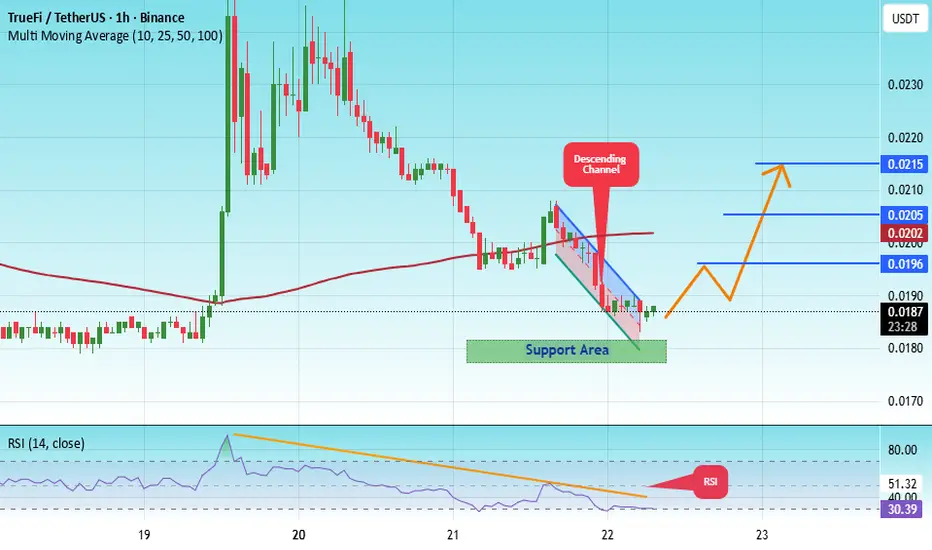
#TRU/USDT Forming Falling Wedge ?#TRU
The price is moving within a descending channel on the 1-hour frame, adhering well to it, and is heading for a strong breakout and retest.
We have a bearish trend on the RSI indicator that is about to be broken and retested, which supports the upward breakout.
There is a major support area in green at 0.0178, representing a strong support point.
We are heading for consolidation above the 100 moving average.
Entry price: 0.0186
First target: 0.0196
Second target: 0.0205
Third target: 0.0215
Don't forget a simple matter: capital management.
When you reach the first target, save some money and then change your stop-loss order to an entry order.
For inquiries, please leave a comment.
Thank you.
TRUMP ; Should we buy Trump currency ?Hello friends
Well, as you know, you are taking a high risk to buy this currency, but as you can see, the price has been compressed for some time and there is a resistance that does not allow the price to grow, and after each time the price hits it, we have witnessed a price correction.
Now, if the resistance breaks, the price can see the specified targets.
*Trade safely with us*

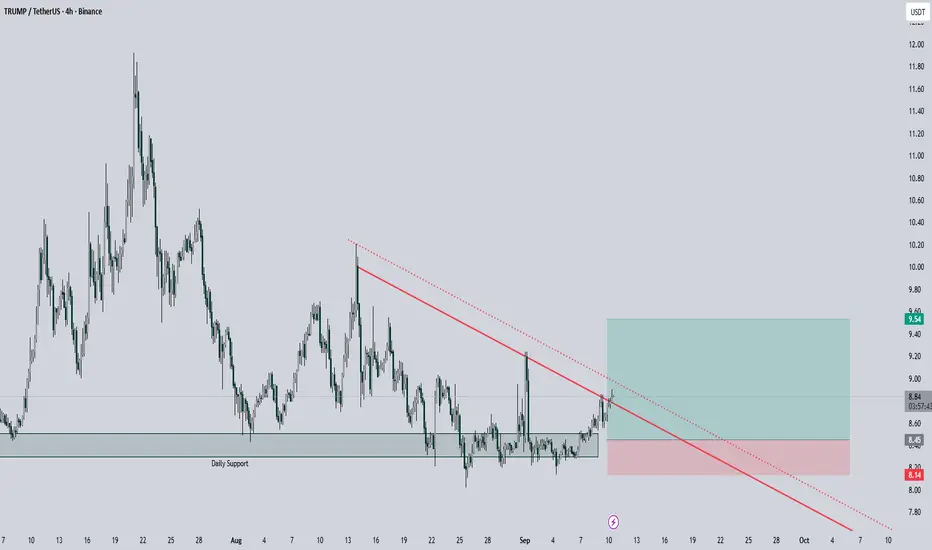
TRUMP Possible breakoutBINANCE:TRUMPUSDT Current Status
The overall trend is bearish, but there's a strong and solid support zone between $8 and $8.50. On the daily timeframe, this support is still valid and has not been broken yet.
Right now, we have a descending trendline that the price is trying to break for the umpteenth time, and we're seeing another attempt today.
There's a chance the descending trendline could break, or it could fail and lead to a drop. In either case, the price of $8.45 could be a good spot for a long position with a 1:3.5 risk-to-reward ratio.
Personally, I never enter a position the moment a trendline breaks. I always wait for the price to come back to my desired entry point, which happens most of the time.
⛔ Disclaimer: This is not investment advice or a recommendation to buy. Please do your own research.
TRUMP!!!Hello friends
Considering the good growth we had, you can see that the price could not continue the growth of the hood and it has fallen. Now it is suspected of a head and shoulders pattern. I repeat, it is suspected of a head and shoulders pattern. The pattern has not yet formed.
If the price breaks the designated resistance, the price can move to the specified targets and if the resistance is broken, I will update it for you.
*Trade safely with us*

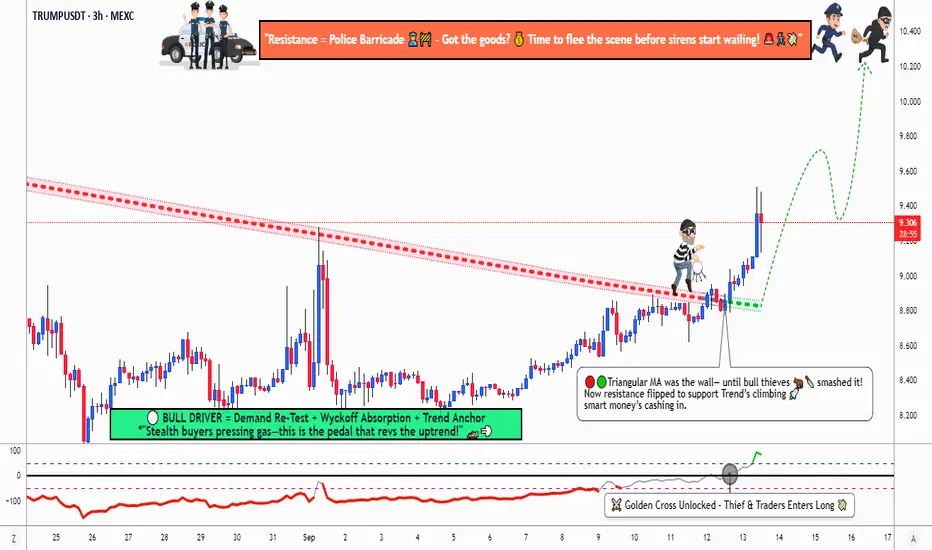
Unlock TRUMP/USDT Gains: Swing Trade Strategy Revealed!🎉 Trump vs Tether: Crypto Heist of the Century! 🚨 (TRUMP/USDT Swing/Day Trade)
🔥 Ladies and Gentlemen, Thieves of Profit! Welcome to the Trump vs Tether crypto caper, where we sneak into the market, grab the gains, and vanish before the cops (resistance) catch us! 😎 This swing/day trade setup is designed for maximum loot with a polished, rule-abiding thief vibe that’ll make the TradingView community go wild. Let’s dive into this bullish breakout plan with style and swagger! 💰
📜 The Heist Plan: Bullish Breakout Blueprint
🚀 Demand Zone Push: Buyers are storming in from a strong demand zone, setting the stage for a bullish breakout. The market’s screaming, “Let’s go, thieves!”
🔄 Retest Confirmation: Price retests the breakout level, confirming the move. This is our green light to join the heist!
📈 Triangular Moving Average Breakout: The price smashes through the TMA like a vault door, signaling a bullish trend.
📊 Momentum Oscillator Golden Cross: The momentum oscillator flashes a golden cross, screaming, “This trend is legit!” Time to load up on TRUMP/USDT!
🔑 Entry: Layered Limit Order Strategy (Thief Style) 🕵️♂️
🎯 Entry Levels: Use a layering strategy to sneak into the market with multiple limit orders. Suggested buy entries:
$9.000
$9.100
$9.200
$9.300
Pro Tip: Stack more layers based on your risk appetite and market conditions! Be the sneakiest thief in the game. 😏
⚡ Flexible Entry: No strict price? No problem! Enter at any level that aligns with the demand zone push and TMA breakout. Just don’t get caught sleeping!
🛑 Stop Loss: Protect Your Loot!
🔒 Thief’s Stop Loss: Set your SL at $8.750 to guard your stash.
⚠️ Note: Dear Thieves (OGs), this SL is a suggestion. Adjust it to your strategy and risk tolerance. You’re the mastermind of this heist—own it!
🎯 Target: Grab the Cash and Run! 🏃♂️
💸 Profit Target: Aim for $10.300, where strong resistance and overbought conditions signal a potential trap. The market police are waiting, so cash out before they cuff you!
⚠️ Note: Thieves, this TP is a guide. Take profits at your own discretion—grab the money and escape at your own risk!
🔗 Related Pairs to Watch (Correlated Assets) 👀
To boost your heist, keep an eye on these correlated pairs in USD for additional opportunities or confirmation:
BITSTAMP:BTCUSD : Bitcoin often sets the tone for altcoins like TRUMP. A bullish BTC move could fuel our TRUMP/USDT rally.
BITSTAMP:ETHUSD : Ethereum’s strength often correlates with altcoin pumps. Watch for ETH breakouts to confirm TRUMP’s momentum.
COINBASE:DOGEUSD : Meme coins like DOGE can move in tandem with TRUMP due to similar speculative vibes. A DOGE surge could signal a TRUMP breakout.
CBOE:MAGA (MAGA/USDT): The direct sentiment sibling. Often moves in close correlation.
CRYPTOCAP:USDT (DXY Watch): Keep an eye on Tether's peg and overall dollar strength (via DXY). A weak dollar can often benefit crypto.
Key Correlation Points:
TRUMP/USDT thrives in a risk-on crypto environment. If BTC and ETH are pumping, TRUMP is likely to follow.
Watch for high-volume breakouts in these pairs to confirm TRUMP’s bullish momentum.
🕵️♂️ Why This Setup Rocks
Bullish Confluence: Demand zone, TMA breakout, and golden cross align for a high-probability trade.
Thief-Approved Strategy: Layered entries let you scale in like a pro, minimizing risk while maximizing gains.
Community Appeal: This fun, professional vibe is crafted to grab attention, spark engagement, and maybe even land an Editor’s Pick! 🌟
⚖️ Disclaimer
This Thief Style trading idea is purely for educational and entertainment purposes. It’s a fun spin on market analysis, not financial advice. Always conduct your own research, assess your risk tolerance, and trade responsibly. The market’s a wild place—steal those gains at your own risk, Thieves! 😜
✨ If you find value in my analysis, a 👍 and 🚀 boost is much appreciated — it helps me share more setups with the community!
#TradingView #CryptoHeist #TRUMPUSDT #SwingTrade #DayTrade #BullishBreakout #ThiefStrategy
TRUMPUSDT - Clear bottom!The Trump token shouldn’t be treated like any other coin — it has backing from big companies and institutions, and more importantly, it’s directly tied to the U.S. President himself. 🇺🇸
Right now, the entire crypto market is forming a bottom that looks almost identical to the one in September 2024, right before the massive rally in October. That’s a strong signal of the next bull market, and naturally, a coin with Trump’s significance will capture a huge share of that upside.
Because honestly — if you can’t make money with Trump, you won’t make money in this market at all.
It has been consolidating for more than 200 days, building a massive symmetrical triangle. Once that breakout happens, the minimum target is $30, and it could hit that level easily in a very short time. Keep a close eye on it.
Best Regards:
Ceciliones🎯

BTCUSD Breakout Above Trendline – Bullish Continuation Setup🔹 Market Context
On the 15m timeframe, Bitcoin has decisively broken above the descending trendline that had previously acted as dynamic resistance with multiple rejections. This breakout occurred after the market created Equal Highs (EQH) and engineered liquidity above them, followed by a Break of Structure (BOS) and a confirmed Change of Character (CHoCH) to the upside.
The breakout not only invalidates the short-term bearish structure but also signals a possible shift in order flow, with buyers stepping in after liquidity collection.
⸻
🔹 Price Action Breakdown
• Liquidity Grab: The equal highs at ~$108,700–$108,900 were swept, clearing stop orders and creating fuel for a push higher.
• Trendline Break: The clean break and close above the descending trendline suggests weakening seller control.
• Retest Opportunity: Price may revisit the broken trendline or recent demand zone (~$108,700–$108,900) before continuing upward.
• Strong High in Play: The $110,500 zone represents the untested supply area and “strong high” that will likely attract price in the short term.
⸻
🔹 Trade Idea (Bullish Bias)
• Entry Zone: Retest of $108,700–$108,900 demand area
• Stop Loss: Below $108,250 (invalidates bullish structure)
• Take Profit Targets:
• TP1: $109,350 → first reaction level
• TP2: $109,750–$110,000 → psychological liquidity pool
• TP3: $110,500 → untested supply / strong high
⸻ CFI:BTCUSD
🔹 Invalidation
If BTC closes back below $108,250 with strong momentum, this would suggest a failed breakout and reopen short opportunities toward $107,500 and $107,200.
⸻
🔹 Bias Summary
• Primary Bias: Bullish continuation after breakout
• Key Zone to Hold: $108,700–$108,900
• Upside Targets: $109,350 → $110,500
• Invalidation Level: $108,250

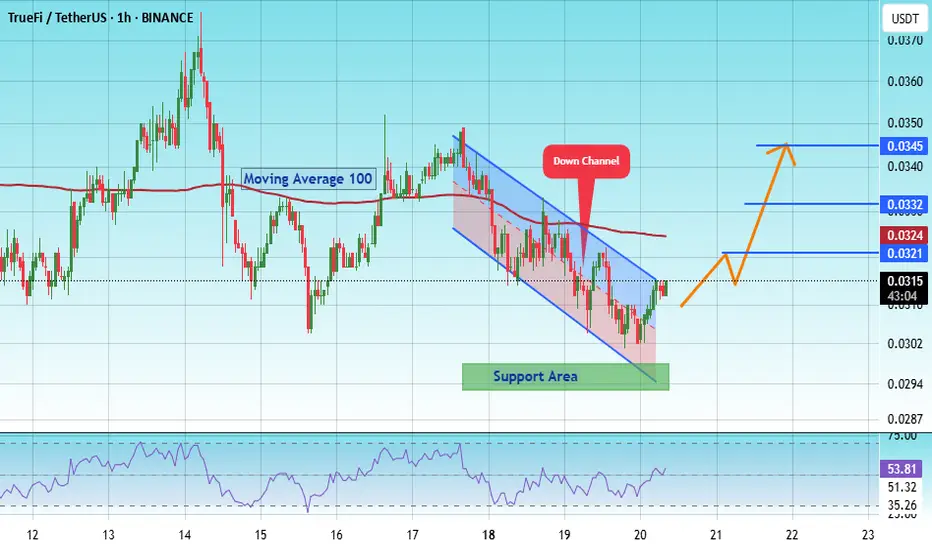
#TRU/USDT Forming Falling Wedge ? #TRU
The price is moving within an ascending channel on the 1-hour frame, adhering well to it, and is on track to break it strongly upwards and retest it.
We have support from the lower boundary of the ascending channel, at 0.0295.
We have a downtrend on the RSI indicator that is about to break and retest, supporting the upside.
There is a major support area (in green) at 0.0298, which represents a strong basis for the upside.
Don't forget a simple thing: ease and capital.
When you reach the first target, save some money and then change your stop-loss order to an entry order.
For inquiries, please leave a comment.
We have a trend to hold above the 100 Moving Average.
Entry price: 0.0314.
First target: 0.0321.
Second target: 0.0332.
Third target: 0.0345.
Don't forget a simple thing: ease and capital.
When you reach your first target, save some money and then change your stop-loss order to an entry order.
For inquiries, please leave a comment.
Thank you.
HODL BASKETHello friends
You see the Trump meme coin on the weekly time frame that has an important resistance and a good support.
Now, to buy this currency, we must wait for a valid break of the resistance and then the price can move to the specified targets.
Note that the specified support is very important and for the price to rise, both the support and the resistance need to be maintained.
Be sure to observe risk and capital management.
*Trade safely with us*

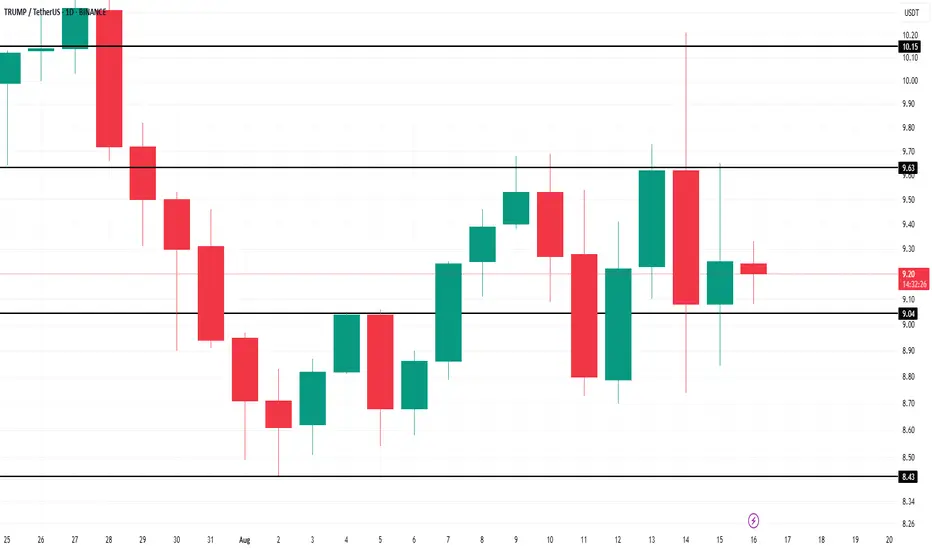
This Is Why TRUMP Price Didn’t Surge After Alaska MeetingBINANCE:TRUMPUSDT is currently trading at $9.17, holding above the support level of $9.04. This range-bound movement suggests that the price could continue consolidating between the $9.04 support and the resistance of $9.63. The market’s indecisiveness points to a period of low volatility.
However, if the outflows continue, BINANCE:TRUMPUSDT could fall through the $9.04 support and fall to the next support level of $8.43. This would extend the losses and put further downward pressure on the price, signaling a potential decline.
On the other hand, if BINANCE:TRUMPUSDT manages to flip the $9.63 resistance level into support, it could make its way towards $10.00 . This would require a change in investor sentiment, likely driven by renewed confidence in the asset's potential.
Here is why EURUSD bulls will holdBased on fundamental analysis, the dollar has remained in a risk on mood due to tariffs and the delay of Powell to cut rates. Despite the delay, President Trump has also been threatening the Fed independence making it difficult for the dollar to sustain gains. Technically the pair has been seen to clear sell side liquidity at 1.14500 zones. Therefore, if the pair maintains the momentum it will go to 1.19000

Solana: On the Verge of a BreakoutCME: Solana ( CME:SOL1! ) and Micro Solana Futures ( CME:MSL1! ), #microfutures
On August 7th, President Donald Trump issued an executive order concerning the 401(k) retirement plans. The key points:
• The order aims to broaden the investment options available to participants in defined contribution plans by directing the Department of Labor (DOL) to explore regulatory changes.
• The order focuses on making "alternative assets" more accessible as investment options, including private equity, private credit, real estate, and digital assets.
• The order directs the DOL to review existing guidance and clarify fiduciary duties regarding alternative assets, with a focus on mitigating litigation risk that might discourage fiduciaries from offering these investment options.
Cryptocurrency market surged upon this big news. This order could open a significant new pool of capital in the form of 401(k) savings to cryptocurrencies. Market size of 401(k) is currently estimated at $8.7 trillion. Potentially, this could expand to cover the $12.2 trillion held in all employer-based defined contribution (DC) retirement plans.
According to CoinMarketCap, as of August 11th, the Top 5 Cryptos by market cap (excluding stablecoins) are:
1. Bitcoin (BTC), $2.4 trillion. At $120K, the king of Cryptos gained 27% year-to-date
2. Ethereum (ETH), $517 billion. At $4300, ETH also gained 27% in 2025
3. XRP, $190 billion ($3.20 each)
4. BNB, $111 billion ($800 each)
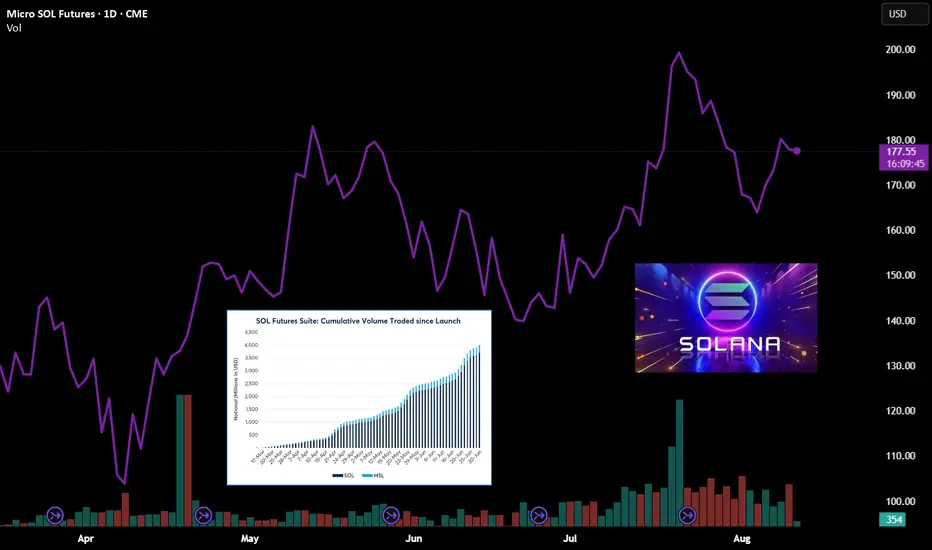
5. Solana (SOL), $96 billion. At $180, SOL is down 7.8% year-to-date
Why did SOL fall while BTC and ETH rebounded and reached new highs?
Solana is a blockchain platform that has rapidly gained popularity due to its focus on high speed, scalability, and low transaction costs. It is designed to support a wide range of decentralized applications (dApps), decentralized finance (DeFi) protocols, NFTs, and Web3 applications. Since its launch in March 2020, Solana has quickly become a leading challenger to rival Ethereum.
Solana's price declined in 2025 due to a combination of factors including broader market corrections, a decrease in activity on the network, particularly related to meme coins, and the impact of token unlocks from the FTX bankruptcy. Additionally, the Solana blockchain has experienced several outages, which have negatively impacted investor confidence.
In my opinion, the tail wind propelling BTC and ETH will also push SOL higher. The 401(k) new capital infusion could have an outsized impact on SOL due to its smaller market cap. Bargain hunters may scoop up SOL because of its relatively low prices. Earlier, ETH rebounded from $1,500 to $4,300 after BTC initiated a bull run. A similar catchup rise could happen to SOL.
Trading with SOL and MSL
CME Group launched Solana futures (SOL) and Micro Solana futures (MSL) on March 17th. Since launch, SOL and MSL have seen a total of 153.1K contracts traded, representing $4.6B in notional value and 31.2K equivalent SOL.
A trader sharing a bullish view on Solana could explore CME SOL or MSL futures.
SOL futures have a notional value of 500 Solana coins. With the current market price at $180, each SOL contract is valued at $90,000. To buy or sell one contract, a trader is required to post an initial margin of $38,210.
MSL futures have a notional value of 25 coins. Each MSL contract is valued at $4,500 at the current price level. A trader is required to post an initial margin of $1,911.
To maintain a long position in Solana over the long run, while enjoying capital efficiency through leverage, a trader may employ a futures rollover strategy.
Rollover is when a trader moves his position from the front month contract to another contract further in the future, prior to the expiration of his existing holding.
These steps illustrate how to hold a long Micro Solana Futures position overtime:
• In August, a trader buys (going long) a September contract (MSLU5).
• About two weeks before the contract expires on the last Friday in September, the trader will enter an offsetting trade, going short on MBTU5 to close his existing position. He would book a profit or loss, determined by the difference in selling and purchasing prices.
• Simultaneously, the trader would buy a December contract (MSLZ5) and reestablish a long position in Solana.
• In mid-December, the trader will close out MSLZ5 (going short), and buy a March 2026 contract (MSLH6), and continue to hold a long position on Solana.
• The trader would repeat the above steps, so far as he holds a bullish view.
Warnings: Solana prices are extremely volatile. Holding spot Solana coins with no leverage could face potential drawdown of 70%-80%. With leverage embedded in futures, a price move in the wrong direction could quickly deplete the available fund and trigger margin calls.
One advantage Micro Solana futures contracts have over the spot asset is the daily price limit. If MSL moves up or down 10% within the trading day, futures trading will be halted. This will give the market time to cool off and help investors avoid being blown out by short-term panic.
Happy Trading.
Disclaimers
*Trade ideas cited above are for illustration only, as an integral part of a case study to demonstrate the fundamental concepts in risk management under the market scenarios being discussed. They shall not be construed as investment recommendations or advice. Nor are they used to promote any specific products, or services.
CME Real-time Market Data help identify trading set-ups and express my market views. If you have futures in your trading portfolio, you can check out on CME Group data plans available that suit your trading needs www.tradingview.com
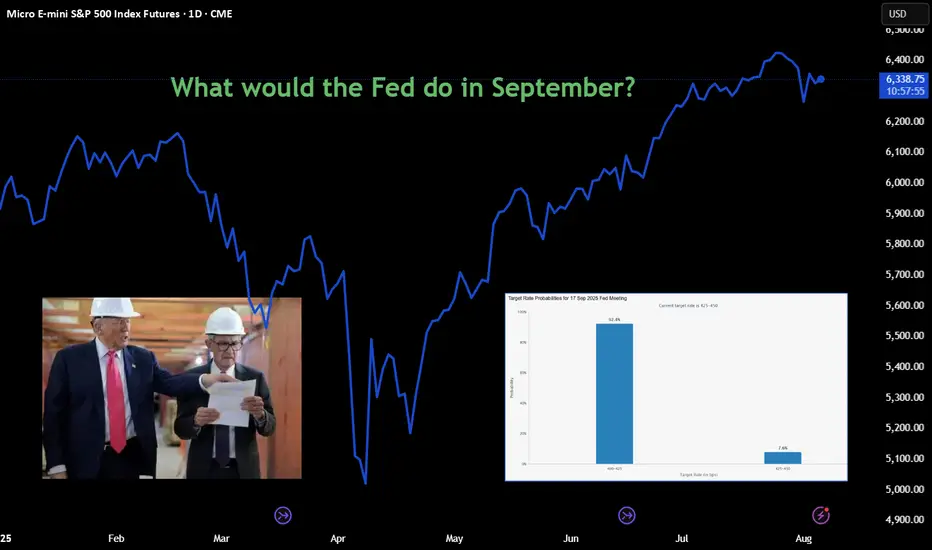
Approachable Contracts for Trading Around Fed DecisionsCME Group E-Mini S&P Options ( CME_MINI:ES1! ) and Micro S&P Futures ( CME_MINI:MES1! ), #microfutures
On July 30th, the Federal Open Market Committee (FOMC) decided to keep the Fed Funds rate unchanged at the 4.25-4.50% target range. Investors now turn their focus on whether the Fed will cut rates on the September 16th-17th FOMC meeting.
According to CME FedWatch Tool, as of August 6th, there is a 92.4% chance that the Fed will cut rates by 25 bps in September. My observation:
• Before July FOMC, market consensus was no rate cut, with the odds at 95.3% as of July 20th. Investors now overwhelmingly expect rate cuts to come at the next meeting.
• Two Fed governors broke the long-run consent and voted against the FOMC decision.
Today, I would like to explore two trading strategies focusing on the next Fed decision.
We will start by breaking down all possible Fed decisions as follows:
1) Cut rates by 25 basis points (92.4%)
2) No rate cuts (7.6%)
3) All others, such as cutting by 50 bps and raising rates by 25 bps (0%)
If we deem the 3rd option to be statistically insignificant, we now have an event with binary outcomes, namely, Cut and No Cut .
Since “Cut” is the market consensus, we will translate the possible outcomes as:
• Meet market expectations (Cut Rates)
• Exceed market expectations (No Cut)
Furthermore, financial markets will likely react calmly if the Fed decision meets expectations, while asset prices could swing widely if the FOMC exceeds expectations.
Typically, US stock market indexes, interest rate contracts and the US dollar exchange rates are very sensitive to the Fed decisions. Our discussion today will focus on stock indexes. I will follow up on the other two asset classes in future writings.
Based on the above analytical framework, we could design two sets of trading strategies:
Sell Call Options if a trader expects the Fed to cut rates
• Since the decision meets expectations, asset prices would not move a lot.
• Options may expire worthiness, which allows sellers to pocket the premium as profit.
Sell Futures if a trader expects No Cut
• Since the decision exceeds expectations, S&P prices could go down sharply.
• With build-in leverage in futures contracts, a trader could realize enhanced profit.
Now, let’s explore how to structure trading strategies using S&P futures and options.
Hypothetical Fed Decision 1: Meet Expectations
Cutting rates is bullish for S&P as it will lower borrowing costs for component companies. However, since market already priced in a Fed cut, stock prices will not move a lot.
If a trader shares this view, he could explore selling Out-of-the-Money (OTM) Call Options on CME E-Mini S&P 500 futures ( NYSE:ES ).
Each ES contract has a notional value of $50 x S&P 500 Index. On August 6th, the September ES contract (ESU5) is quoted at 6,341, making the notional value at $317,050.
• Call options at the 6500-strike are quoted at $42. By selling 1 call, options seller will receive $2,100 in upfront premium (= 42 x 50).
• Options expire on September 19th, two days after the FOMC. If ESU5 price does not exceed 6500, options seller will pocket the premium as profit.
• Warnings: selling options involves significant risks. Seller could lose more than the premium he collected. To cut losses, seller could buy back at the open market and exit the position. This will avoid losses to accumulate by expiration date.
Hypothetical Fed Decision 2: Exceed Expectations
Since rate cut is already priced in, an Unchanged decision will likely cause the S&P to fall sharply, as expected future borrowing costs will go up.
If a trader shares this view, he could explore selling CME Micro S&P 500 futures ( MSTAR:MES ).
Each MES contract has a notional value of $5 x S&P 500 Index. On August 6th, the notional value of ESU5 is $31,705. Buying or selling 1 futures contract requires an upfront margin deposit of $2,135 at the time of this writing.
Micro S&P 500 futures are 1/10 in notional comparing to its E-Mini counterpart. With smaller size and lower margin requirement, the micro contracts are more approachable for non-professional traders. At the same time, they also enjoy the leverage built-in the futures contracts. Micro S&P contracts tap into the liquidity pool with the broad S&P contract suite.
Hypothetical Trade
• Short 1MESU5 at 6,341, and set a stop loss at 6450
• Trader pays $2,135 for initial margin
A “Meet” Scenario: S&P go up 1.5% to 6,436
• Short position loss: $475 (= (6436-6341) x 5)
• The maximum loss will be $545 if the S&P moves higher, due to the stop-loss feature
An “Exceed” Scenario: S&P falls 5% to 6,024
• Short position gain: $1,585 (= (6341-6024) x 5)
• The theoretical return is 74.2% (= 1585/2135), excluding transaction fees
Happy Trading.
Disclaimers
*Trade ideas cited above are for illustration only, as an integral part of a case study to demonstrate the fundamental concepts in risk management under the market scenarios being discussed. They shall not be construed as investment recommendations or advice. Nor are they used to promote any specific products, or services.
CME Real-time Market Data help identify trading set-ups and express my market views. If you have futures in your trading portfolio, you can check out on CME Group data plans available that suit your trading needs www.tradingview.com
TRUMP/USDT - SHORT/LONGImplementation will take about a month and a half.
(This is not an investment recommendation).

DXY Bulls Ready — Can Powell Spark the Rally?📊 DXY Pre-FOMC Outlook
In my previous analysis released on Monday, I expected the Dollar Index to fill the gap around the 98.60 zone and range below the key red line at 99.429.
Now, with less than 8 hours left until the highly anticipated FOMC rate decision, it’s time to take a closer look at tonight’s event and what it could mean for the markets.
From a purely technical perspective — setting the news aside — the Dollar Index looks ready to break through the crucial 100 level and kick off a strong bullish rally.
However, recent political pressure from Trump urging rate cuts, along with visible tension between him and Fed Chair Jerome Powell, has created uncertainty. If it weren’t for these conflicting signals, I would’ve confidently expected a clean breakout above 100.
As much as I enjoy trading news-driven events, I’ll likely stay out of the market tonight and observe from the sidelines. The setup is tempting, but the dual narratives make it risky.
That said — if you ask for my final take — I believe the stage is fully set for a bullish dollar and a corresponding drop in gold, EUR, GBP, and other major assets.
Let’s see how it plays out. 👀💥

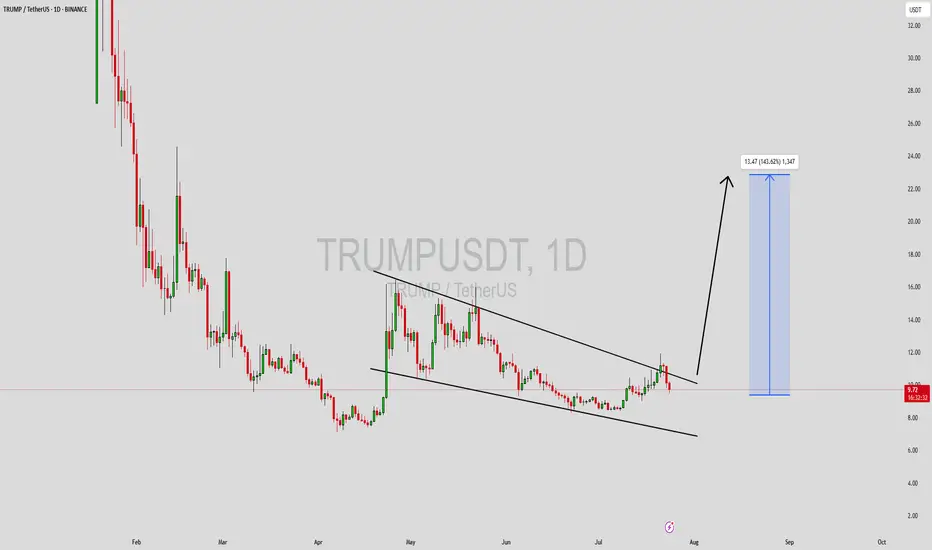
TRUMPUSDT Forming Falling WedgeTRUMPUSDT is currently forming a well-defined falling wedge pattern—a bullish reversal structure that often leads to significant upside breakouts. The price has been consolidating within narrowing trendlines and now appears to be approaching a breakout point. Historically, falling wedge patterns in the crypto market have led to aggressive rallies, especially when combined with rising volume and strong community sentiment. With good volume backing this setup, a breakout could trigger a sharp move to the upside, projecting an expected gain of 90% to 100%+ in the coming sessions.
Investor interest in the TRUMPUSDT project has been steadily increasing, likely fueled by the coin’s strong branding and community-driven momentum. Meme-based and politically themed tokens have seen explosive growth in recent bull cycles, and TRUMPUSDT may be positioning itself to capitalize on similar attention. With sentiment aligning positively and technicals flashing bullish signals, the coin is attracting both short-term swing traders and long-term speculative holders.
If TRUMPUSDT confirms a breakout above the upper wedge resistance with volume confirmation, we could see rapid price expansion. Traders should monitor key levels and consider re-entry on retests or strong bullish candles. The momentum shift is already becoming apparent, and this coin could turn into a trending asset in the meme-token segment very soon.
Keep this setup on your radar as it may provide high-reward opportunities. Monitor community updates, upcoming events, and broader meme coin momentum across the market for additional confirmation.
✅ Show your support by hitting the like button and
✅ Leaving a comment below! (What is You opinion about this Coin)
Your feedback and engagement keep me inspired to share more insightful market analysis with you!
Gold Bulls Back in Control as Trump Pressures Fed for Rate CutsHey Realistic Traders!
President Trump is ramping up pressure on the Fed to cut interest rates , saying the U.S. is falling behind countries with looser policies. As several Fed officials begin to shift their stance, expectations for rate cuts are growing. That’s putting pressure on the dollar and giving gold a fresh boost.
We’ll take a closer look at what this means for OANDA:XAUUSD (Gold) through technical analysis and explore its upside potential.
Technical Analysis
On the 4-hour chart, Gold has moved above the EMA-200, signaling a shift in momentum to the upside. Price has also broken out of a Descending Broadening Wedge (DBW) pattern, which often indicates the start of a bullish trend.
The breakout was confirmed by a Bullish Marubozu candle, reflecting strong buying pressure. To add further confirmation, the MACD has formed a bullish crossover, reinforcing the upward momentum.
Looking ahead, the first target is seen at 3417. If reached, a minor pullback toward the historical resistance zone (green area) may occur, with a potential continuation toward the second target at 3500.
This bullish outlook remains valid as long as the price stays above the stop-loss level at 3271 . A break below this level would invalidate the setup and shift the outlook back to neutral.
Support the channel by engaging with the content, using the rocket button, and sharing your opinions in the comments below.
Disclaimer: "Please note that this analysis is solely for educational purposes and should not be considered a recommendation to take a long or short position on XAUUSD.

10Y: Positioning for a Falling Yield EnvironmentCBOT: Micro 10 Year Yield Futures ( CBOT_MINI:10Y1! ), #microfutures
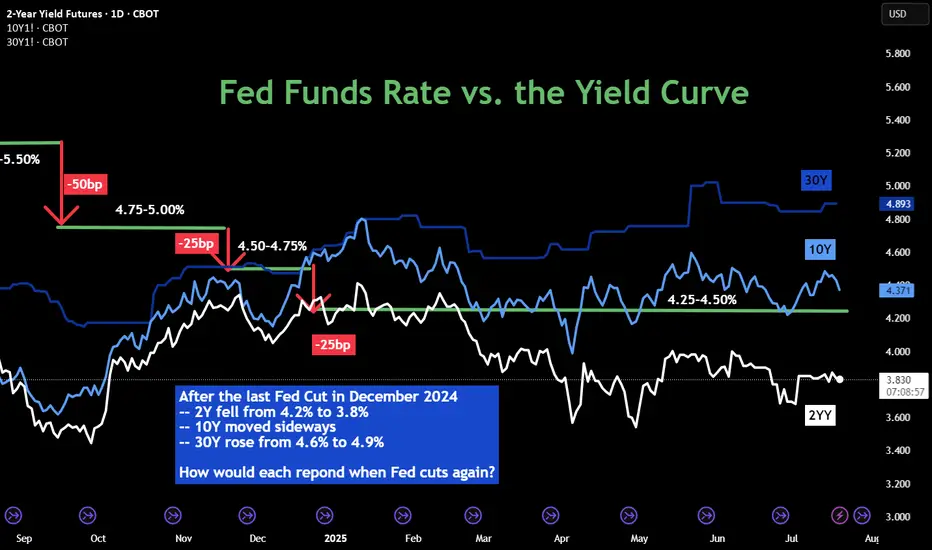
The Federal Reserve last cut interest rates in December 2024. Since then, it has kept the rates unchanged in its January, March, April and June FOMC meetings. While the official Fed Funds rate stays at 4.25-4.50% in the past seven months, we have seen diverging trends in the interest rate market:
• 2-Year Yield has trended down from 4.25% to around 3.85%;
• 10-Year Yield mostly moved sideways, currently at 4.42%;
• 30-Year Yield rose from 4.60% to top 5.00% in May, then pulled back to 4.89%.
The futures market expects the Fed to cut rates once or twice in the remaining four FOMC meetings in 2025, according to CME Fed Watch Tool.
• As of July 20th, there is a 95.3% chance that the Fed will keep rates unchanged in its July 30th meeting;
• The odd of lowering 25 bps is approximately 60% for September 17th;
• By the last 2025 meeting on December 10th, futures market sees just 6.4% chance that the Fed keeps the rates at current level 4.25-4.50%, while the odds of 1 cut to 4.00-4.25% are 29.2%, and the odds of 2 cuts to 3.75-4.00% are 64.3%.
The Fed’s Challenges
The Fed tries to fulfil its dual mandate established by the Congress: (1) to support maximum employment and (2) to maintain price stability. Its official targets are to keep the unemployment rate below 4%, as measured by the BLS nonfarm payroll data, and to keep the inflation rate at 2%, as measured by the PCE price index. When we face an outlook of rising prices and slowing employment, the Fed will have a hard time meeting both policy goals.
Firstly, as the Trump Administration raises tariffs for all trading partners on all imports, it’s a matter of time before the inflation rate picks up again. Even if many countries may reach trade agreements with the U.S., they will still get a bigger tax bill.
• According to the Bureau of Economic Analysis (BEA), the total US imports of goods and services was $4.1 trillion for 2024.
• Imports account for 14% of the US GDP in 2024, which is $29.2 trillion (BEA data).
• Simple math suggests that a universal 10% tariff hike could contribute to 1.4% in price increases, assuming all tariffs are passed through to the retail prices.
The most recent inflation data is the June CPI at 2.7% (BLS data). The tariff hike could easily push inflation to twice the Fed policy target. Therefore, cutting rates will be a very difficult decision if inflation rebounds.
Secondly, US employment growth has slowed down significantly in 2025. On July 3rd, the BLS reported total nonfarm payroll increased by 147,000 in June, and the unemployment rate changed little at 4.1 percent. Current employment growth is less than half the level in December 2024, which saw the data above 300,000.
There are weaknesses in the payroll data. All private sectors combined accounted for about half of the employment gain, or 74,000. Government jobs, while at a much smaller base, accounted for the other half.
Tariffs raise the cost of input, while business borrowing costs remain high at current rate level. To support growth and maximum employment, cutting rates make sense.
Finally, the Fed is under tremendous pressure from the Administration. President Trump openly and repeatedly calls for a 300bp cut.
In an ideal world, the Fed wants to make monetary policy decisions free of political interference. It may not be the case. Let’s look at the Fed rate decisions during the first Trump presidential term. The current Fed Chair was appointed to the role by President Trump in February 2018.
• The Fed raised interest rates four times in 2018, for a total of 100 basis points, with the Fed Funds rate increased from 1.25-1.50% to 2.25-2.50%.
• Under pressure from the White House, the Fed cut rates three times in 2019 for a total of 75 basis points, with the Fed Funds rate ending at 1.50-1.75%.
• In 2020, in response to the Pandemic, the Fed cut rates by 150 points, all the way to a zero-rate environment (0%-0.25%).
In my opinion, the Fed will cut rates this year, similar to 2019. Once the Fed Chair retires in May 2026, his replacement, who will be nominated by President Trump, will no doubt follow his guidelines and bring the Fed Funds rate all the way down to 1%-2% level.
While there is uncertainty in the timing and pace, we are likely to embark on the path to low interest-rate environment.
Shorting Micro 10-Year Yield Futures
A trader sharing a bearish view on interest rates could explore shorting the CBOT Micro 10-Year Yield Futures ($10Y).
Last Friday, the August 10Y contract (10YQ5) was settled at 4.425. Each contract has a notional value of 1,000 index points, or a market value of $4,425. To buy or sell 1 contract, a trader is required to post an initial margin of $300. The margining requirement reflects a built-in leverage of 14.7-to-1.
Let’s use a hypothetical trade to illustrate how to use a short futures position to take advantage of a potential Fed rate cut.
Hypothetical Trade:
• Short 1 10YQ5 at 4.425, and set a stop loss at 4.60
• Trader pays $300 for initial margin
Scenario 1: Fed keeps rates unchanged on July 30th, 10Y moves sideways
• If Futures price changes little after the July FOMC, the trader could close the position
• He could short the September contract 10YU5, with an eye open for the September 17th FOMC rate decision
• This is a futures rollover strategy.
Scenario 2: Fed cuts 25 bps on July 30th, 10YU5 falls 250 points to 4.175
• Short position gains: $250 (= (4.425-4.175) x 1000)
• The hypothetical return will be 83% (= 250 / 300)
Happy Trading.
Disclaimers
*Trade ideas cited above are for illustration only, as an integral part of a case study to demonstrate the fundamental concepts in risk management under the market scenarios being discussed. They shall not be construed as investment recommendations or advice. Nor are they used to promote any specific products, or services.
CME Real-time Market Data help identify trading set-ups and express my market views. If you have futures in your trading portfolio, you can check out on CME Group data plans available that suit your trading needs www.tradingview.com