Trxusdtechnicalanalysis

TRX continues to have trouble with 385!TRX is trying to break out from this range it's been stuck in for weeks but it cannot properly close above the 385 level. We did break and close above it earlier in the month but that was short-lived as we returned back below after just 2 days above.
We are currently sitting on top of a demand zone, which has held strong in the past so if we are expecting some movement in TRX, now is the time as BTC continues to trend sideways. A break below this support area could see us test the lows once more, which could make a lot of bulls panic out of their longs. Breaking above resistance will cause a lot of short liquidations, which could see TRX potentially even test 2 supply levels above.
Thanks guys


TRXUSD to continue the Downtrend, but may bounce over 300 pipsTorn is going south for the moment, however it is likely that it will bounce back up and maybe go through the resistance of the downtrend.
Do you think TRX has still something to offer or is an outdated coin?

TRXUSD Break the Trend line and goes up for next Profit zoneTRXUSD Break the Trend line and goes up for next Profit zone

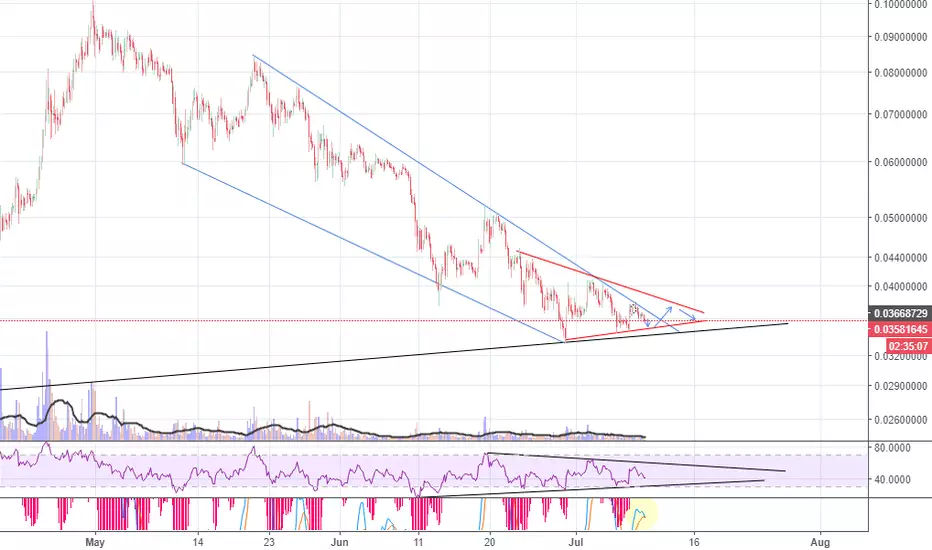
Bullish Signs in TRX Hi Guys,Let's Look at TRX chart
We have 2 Bullish wedge.First one started from May and second one from Jun.You can see first one in main idea chart and second one bellow.
In a more exact look to chart we can find two triangle two,first one in the end of trend (red line) and important one is a long term one that i coint on it as a symmetrical triangle,you can see in chart bellow.
This kind of triangles usually have result in way of market consolidation but we have cases that these triangles had reversal result.in this case with all these bullish signs i think we will bounce in favor of one of these formations.Before that with signs that i see in indicators we can make another impact to our bottom lines like blue arrow in chart or more to black line.
But like always we need BTC to push market in correct way and don't ruin the party,so if you want to enter trade in this coin don't forget a tight stop loss or at least stop around $0.0335.
Good Luck
(Buy Tron) TRXUSD Technical Analysis for April 5, 2018Hello Traders,
Time to buy Tron (TRX) with stops at 8 cents.
