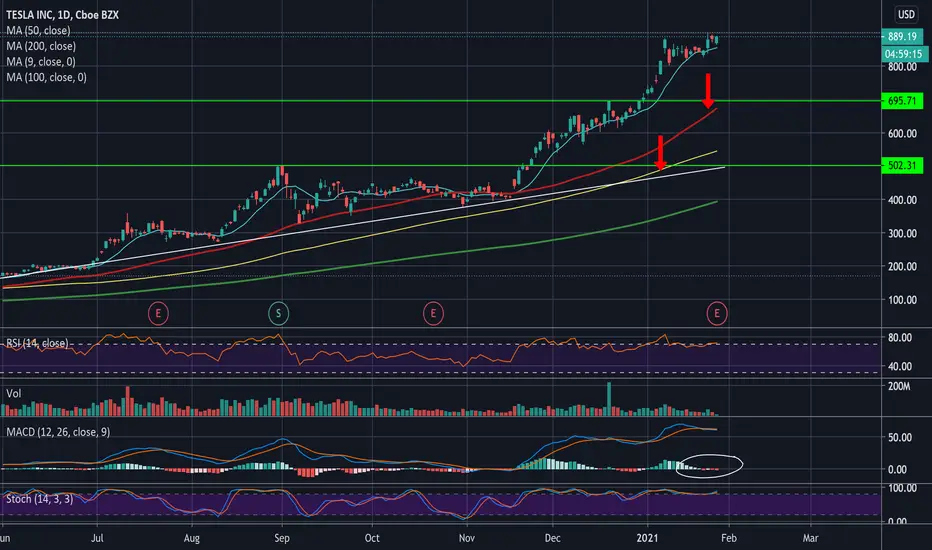
TSLA consolidation after S3XY algorithm SELL short positionOn Feb 10, 2021, the s3xy algorithm initiated it's first SELL SHORT position in TESLA. Since it's alert, TESLA has dropped more than 35%. What Next? We believe TESLA will under go consolidation around the 640 to 550 range and then begin to sell off down to 400 by mid June or July. This assumption is based on the daily s3xy continues to remain in SELL SHORT position. Price estimation and target can change if TESLA can trade above 640 for 14 days. If this happens then I would look for a ttm squeeze daily to setup and anticipate an Earnings run up to 900 or 1000. This condition would likely play out as long and increase in probability if the daily ttm squeeze develops prior to earnings AND price trades at least 7 days consecutively above the 6 day ma.
Tslaanalysis


$TSLA If we take Sept 8th as our lows and Jan 25th as our highs, we can see a decent bullish candle on the daily Friday 5th. Supply met demand that day and we might see a new trend from now on. We either continue down to meet that .23 retrace level on we bounce upwards from here. Notice the volume last Friday as well, that should be a bullish indicator if these levels hold.

TSLA symmetric triangleTSLA is a really good market leading indicator. we hope it doesn't play the downside. or do we? that would be a perfect setup for another bull rally


Tesla $TSLA #TSLA - Be patient for Re-Entry!#USstock #TESLA #TSLA
Using ATR on Daily Chart:
Be Patient & Wait for to Re-Enter.
Wait for LMACD to curl up. Price also needs to hold above 100EMA & 0.5 Fibo, or expect more downside.
This is #PersonalOpinion. Pls #DYOR.
.
#PeterSinGuili
#TechnicalAnalysis
#SwingTrade

Tesla (Has the Golden Boy lost its shine?)View On Tesla (24 Feb 2021)
Tesla is in the free fall and it has hit strong support. (the lower band of strong UPtrend)
We can expect a bounce from here (aka late to short). It can travel back up to 750~780 region.
Let's see..
DYODD, all the best and read the disclaimer too.
Feel Free to "Follow", press "LIKE" "Comment".
Thank You!
Legal Risk Disclosure:
Trading foreign exchange or CFD on margin carries a high level of risk, and may not be suitable for all investors.
The high degree of leverage can work against you as well as for you. Before deciding to trade foreign exchange you should carefully consider your investment objectives, level of experience and risk appetite.
The possibility exists that you could sustain a loss of some or all of your initial investment and therefore you should not invest money that you cannot afford to lose.
You should be aware of all the risks associated with foreign exchange trading, and seek advice from an independent financial advisor.
DISCLAIMER:
Any opinions, news, research, analyses, prices or other information discussed in this presentation or linked to from this presentation are provided as general market commentary and do not constitute investment advice.
Sonicr Mastery Team does not accept liability for any loss or damage, including without limitation to, any loss of profit, which may arise directly or indirectly from use of or reliance on such information.

TSLA DAILY DOUBLE BOTTOM$TSLA formed a double bottom on the daily chart
It's not a perfect double bottom of course. We will be seeing pullbacks at previous resistance levels (red horizontal lines) after we break above them.
If you agree/disagree with my ideas please comment below as to why.
Thank you!

TSLA - Fibonacci Support and Double Bottom = Higher Prices?TSLA Daily
Nice recovery on TSLA after breaking 800 forming a Hammer candle.
Price came right into Fib Cluster at 776-784 made up of 1.618% ext. 50% retracement and 100% symmetry projection.
Also nice double bottom from Jan 29 low.
Can we move up from here, Upside is pretty healthy.
Only issue is Daily Squeeze momentum is still to the downside.
TSLA - 1HR
Price Stopped at 1.618% Ext. and 100% Symmetry at 784.24 to 785.21.
Moves terminate at extensions.
1HR SQZ forming and momentum looking to move to upside.
Fib Resistance Levels that TSLA needs to break through to continue movement to the upside.

Tesla has disclosed in a recent SEC filing that it bought BTCTesla has disclosed in a recent SEC filing that it has bought $1.5 billion worth of bitcoin.
"In January 2021, we updated our investment policy to provide us with more flexibility to further diversify and maximize returns on our cash that is not required to maintain adequate operating liquidity," reads the filing. "Thereafter, we invested an aggregate $1.50 billion in bitcoin under this policy and may acquire and hold digital assets from time to time or long-term."
In addition to the bitcoin purchase, Tesla expects to begin accepting bitcoin as a form of payment for its products "in the near future, subject to applicable laws and initially on a limited basis, which we may or may not liquidate upon receipt."
Bitcoin's price has been soaring on the back of this news. It is currently trading around 12% up at about $43,500.

$TSLA - now is the perfect time for a low-risk/high-reward entryIf you 're not already in a TSLA position and have been waiting to enter, it is now in a perfect setup for a low-risk/high-reward entry. #TSLA has retraced after its binary event (earnings), as it typically does. Novice traders still think they can buy a stock on a known event and make easy money doing so. What they don't know is that most dip-buyers are looking to sell into these rallies.
TSLA has now retraced to the .786 Fib level, the 10 weekly EMA, is showing hidden bullish divergence, oversold Stoch RSI, and has formed a bullish pennant. What makes this low risk is the fact that your stop limit can be close to your entry, since it's practically sitting at the 10 weekly EMA.
Entry - $410 - $420
TP - $500
SL - $380
Like & share! 👍🏼📣


We are LONG on TSLA. PT: 1200We are hyper bullish on TSLA for the rest of the year.
Some pointers:
After failing to meet EPS numbers, we remain confident that TSLAs growth has only begun.
Listening in on their earnings call, we are happy to hear that their growth will materially grow by more than 50% for many years to come.
With PiperSandler coming out with a $1200 PT yesterday and ARK Invests Cathie Wood saying they will come out with an updated analysis on tesla next month, we see this as very good news for TSLAs price action in the coming months.
With Elon stating that FSD and their auto business being worth $1T in market cap alone, that in and of itself is great for TSLA.
Their energy storage deployed doubled from Q3 to Q4.
TSLA is building 2 gigafactories (Berlin and Texas) and is outgrowing all of its competitors in every space.
Bidens EV plan will incentivize people to switch to EVs. It's only a matter of time.
Charting Patterns
Historically, TSLA has traded in many wedge patterns and this is no different. We believe this dip will be bought and the recovery will be rather quick.

Is $TSLA a buy now?(Republishing this)
Hello my dear padawans. This is going to be a quick one.
TECHNICALS
Technicals don't look very good but hey, this is TSLA and many (most?) times it tends to ignore them. Here they are:
1. MACD crossed the signal line bearish and somewhat sharply if compared to the last couple of times. Last time it crossed in similar fashion it dropped about 34%. Doesn't mean it has to happen again but it is something to keep in mind.
2. RSI is also moving sharply to the 30 level. Still a lot of room to go.
3. ADX also turned down sharply. -DI and +DI on the verge of crossing bearish . We could also see them touch and move in opposite directions from here.
4. Price crossed below the 14 and 21 emas on the same candle in what almost looks like a bearish engulfing .
On the positive side, the price found support on the .236 fib retracement and the Argus agency boosted their price target to $1,000 (from the previous $777).
So the overall outlook is bearish for Tesla , specially after what was considered disappointing earnings .
A retracement to the .382 fib level is not our of question so you can monitor the price action from here and position yourself accordingly. I am bullish long term so I bought some shares here and will buy more if it goes lower.
Safe trades!
Share the love:
If you get anything out of this TA, please like the chart so it moves up and others can benefit from my work. A simple click on the like button goes a long ways.
Follow for more:
I have an outstanding winning rate (check my other charts). If you want the best entry/exits just follow me, you won't regret. Thanks a lot!
***The ideas shared here are my opinion, not financial advise to place trades. Please do your own research before buying/selling stocks***

Short TESLA today. Who is the big shorts Micheal Burry?Ok so with trading timing is everything. Lets face it that Micheal Burry from the film "the big short" got really lucky with his housing market short in 2007-8. It's one thing knowing a market will sell off, it's another thing timing it. Fair enough he had to get all those swabs sorted as there wasn't even an instrument to short sub prime back then. Micheal was so early with his trade though that it nearly costs him dearly.
Here he is again lining up his Tesla shorts for ages now as the market has been going higher and higher.
markets.businessinsider.com
I've been trading TESLA the other way adding to longs again and again while most trader said it cant go no higher! Now we are at a point though that the MACDH on the daily chart has finally trigged an extremely bearish divergence. These extreme divergences work out 80-90% of the time. The Dow had one a couple of days ago and selling has been hard down a 1000 points or so the last day. We have also had Yellen saying "we don't see a lower dollar" last week which has caused the Dollar to strengthen, gold to sell off and equites with it. This is actually the first time Tesla has put in a major divergence like this in several years. Looks like a low risk high reward short to me ahead of the fed this afternoon. Everything depends on them and how much Yellen can really do to stop the plummeting dollar.
I think we can trade short TESLA down to at least the $700 dollar region. Stop at the high of around $902.
Let's see if we can outsmart Micheal Burry a little anyway with our TESlA short timing today.

TSLA: Green or Red path? With earning fast approaching next week, TSLA finds itself at a crossroad.
But was does this mean?
Well, for starters TSLA has been inside a very long ascending wedge pattern, recently touching the very top and being rejected there after making its all-time high. When the rejection occurred TSLA began to consolidate inside a small but well-defined triangle pattern which has not been broken. Using Pivot Points, we can also see that TSLA is holding support at an R2 level which is something I look out for when looking for breakouts. Now does this mean we are going to see a breakout with TSLA? No, not really, but it is another tool that can be useful when analyzing charts and searching for possible clues. With earnings next week, possible triangle breakout, and R2 as support, TSLA could try and make a move up to R3 and retest the top of the ascending wedge. Do I recommend jumping in now and buying TSLA, NOT. AT. ALL. I personally would wait a bit and let the triangle breakout decide which path it wants to take, Green or Red.

Tesla is still bullishThe cycle and wave analysis of tesla shows that it is still bullish. When the correction is over it will jump another small wave to beyond 1000 to the possible 1600-1800-2000 targets.

TSLA - Short Squeeze Friday = New ATH $888 targetTesla will hit new ATH due to the 10+ Million Shares that will be purchased tomorrow by outstanding naked puts. If we gap higher overnight, by $15+ a run over $900 is possible. More than likely we'll settle in the $880 range after making a new ATH at some point (likely late) in the trading day.

TSLA - Gap Fill Up, Bull Pennant Breakout - Hi Ho Hi Ho Up We GoRound Two of Riding That TESLA Electric Train!
Gap fill up to high $870s today - drop below $832 ($835 really) it's a bust. Potential for decent gap up overnight if we finish the day >+3.5%

TESLAWell... Obviously if I had bought this one, I would have definitely and undoubtedly exited around price 1,000$ .
As explained on chart.

TSLA stock target price before 20 Jan 2021 : 1080$ ~ 1256$.It's possible that TSLA drop down at magic numbers like 888$ or 999$.
That's easy TSLA rally to 900$ on 12 Jan 2021.
It's a good idea that buy some really cheap options to hedge TSLA meltdown, ex. TSLA put Jun 21 at strike 270$ ~ 495$.
Short some TSLA CFD with little stop-loss order when TSLA diving.
The market could reach a incredible high level before 20 Jan 2021.
be careful when TSLA higher than 1080$.
Double-Tops pattern
fuzzy range 12xx$~13xx$
270$ is a potential bottom price.
However, everything is
possible. The most optimistic scenarios
for TSLA is 2295$ at end of the year 2021.
stock analysis by Jiucai334

US Stock In Play: $TSLA (Tesla Inc)$TSLA was the top trending ticker symbol over at Twitter ($TWTR) in the last 12 hours, after closing with a +7.94% rally intraday. This is a new all time high attained by $TSLA at $816.04, post split. The breakout have also fully negate the Bearish Wedge chart pattern highlighted in the previous week, with $TSLA breaking above the upper boundary of the chart formation in less than 5 trading session.
Current price volatility is observed to be at a significant range of $35/day ATR-14 (an approximate 4.35%/day). A continuous follow through of momentum tonight (bullish) with pre-market trading beyond $817, is likely to see TSLA trade beyond its limit range of 4.5% to close the week at $860.
