Tesla ( $TSLA ) Potential Monumental BreakoutHow do you ignore this setup? $TSLA breaking out of a triangle to the upside with a BULLISH MACD crossover on the weekly & daily charts. Look for a monumental move in the coming week(s).
Tslabuy

TSLA 3/day and weekly Trend ReversalOn the weekly for tesla, we are seeing a trend shift on the trend bricks and all 3 trend meters. This is a good confirmation for an entry on a short position.
We will have a 3-day close also in the red.
I would look for an entry on a weekly close confirmation.
Great long-term potential setup.

TSLA explodes higher into August 2021 with defined targetTSLA has been a trading like fud for the past few months and this was expected after a parabolic move in 2020. The monthly setup shows a high tight monthly darvas setup. The TOSOPTION algorithm on the monthly continues to trade long. If the upper channel of the darvas gets taken out then TSLA moves to 1126 which is our fibonacci 1.272 extension. With earnings around the corner, the price either reaches the target pre earnings run or post earnings. We have opened a series of directional contracts for July 23 800C. A close above 665.59 on July 9 would be ideal for tsla to push higher next week into July 13 and July 14.

TSLA Stock To Keep In Portfolio!Hello ladies and gentlemen, according to my graphical analysis of TSLA , I recommend for the moment to keep TSLA Stock in your portfolio because there is a great probability of reaching 745$ in the next few weeks .

TSLA LONG on the Daily algorithmTSLA S3XY algorithm initiated a long position on the daily time-frame on June 23. The weekly signal remains neutral and if both daily and weekly are long then we have a potential price explosion for tsla that could retest and break thru $1000. Daily Long position is very bullish and likely the early signs of TSLA making another attempt to run up to $1000. Before $1000, there are three psychological levels - 700, 800 and 900. There are two time aggregation periods that suggest the price level of 700 will be taken out this week based on the famous BLT candlestick combination. These combo candlestick setup can be viewed on the 2D and 3D aggregation period. We have opened two positions and likely to continue to add more for July and august monthlies. S3XY on the 30min time frame is long and we also have a full position using common shares.


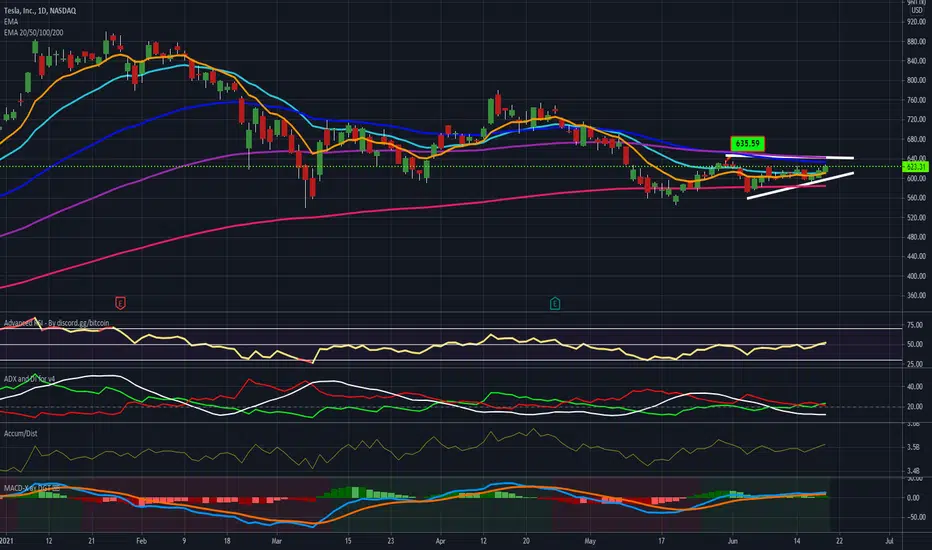
TSLATesla, Inc. (NASDAQ:TSLA) started the day negative but turned things around to close up nicely on decent volume. Keep an eye to see if it can break out above the $635.59 level next week. The stock shows signs of a trend reversal. Trajectories of momentum indicators on daily charts also suggest uptrend for the stock. Long setup on watch.
TSLA READY FOR BLAST OFF 2021!!! #BLESSEDPIPS WITH A STRONG HOLD AT SUPPORT AND A LOT OF POSITIVE NEWS THIS WEEKEND. THINGS ARE LOOKING POSITIVE, LETS SEE WHAT HAPPENS THIS WEEK.
#BLESSEDPIPS

TSLA 1D ChartHello there,
As we can see TSLA still above the support line, if TSLA can hold this level we can see a wave to the green line in upcoming days with +26% possible gain.
*** This is not a financial advice, I'm still a beginner trying to share my Road here.
Than you.

I am bullishIt hit the 78.60% fibonacci line on the nose and is oversold. I am bullish with this one .
(not advice)

TSLA bounced from top of the box! Still on target to 800 !So far, nice bounce from top of the box. As long support holds (on top of inside box), I think it is on it's way to next target of 800.

UPDATE on the MOTHER OF ALL WEDGES (TESLA)What I'd like to see now:
-The fill of the gap at 775
-A retrace to the broken consolidation area
-The fill of the gap formed today at 700
Here is where I will add more shares to my Tesla position (trying to make Tesla 65% of my portfolio from 60%)
-And then a continuation to A: break the wedge and go back to 800+. Or B: Consolidate between 720-780 range waiting for Q2-3 catalysts.
What do you guys think?
My portfolio was really happy with TSLA, PLTR and BTC today

TSLA closed above the inside box today. Going up!Closed above key price level 701 today. If it holds 659 level, next upside target levels are 721, 762, 800 and 870 before new ATH. Let's see how it travels up.

TSLA PT 04/2021Many bullish indicators for TSLA, falling megaphone retest, inverse h&s throughout the last month, Wave 1 impulse post-correction, currently riding Wave 3 which is set to take off during this April melt-up. We just finished our Wave C corrective pattern & are back on the bull for TSLA.
Betting on 700 next week.

TSLAI think Tesla, Inc. (NASDAQ:TSLA) will have a relief rally next week after its dramatic fall since the January peak of $900. The RSI history of this stock speaks louder. Notice that every time the daily RSI drops below the 30% level, the stock makes a dramatic rise in the weeks after. The performance history of a stock is always an important parameter in my technical analysis. Nowadays, a lot of traders sell any stock when the daily RSI touches 70 and buy when it falls to 30, however, you must analyze the RSI history before making any trade. History does tend to repeat itself and the majority of the stocks have more than one life in them. Another interesting factor on this long-term chart is that the uptrend of the accumulation line remains practically intact after this big drop, which means the stock is still on the positive swing. These are few reasons why I think now is the time to take a long position at this one, before the stock changes its trend and heads back higher. The bottom looks to be in and the risk of more bloodshed is a lot lower than it was weeks days ago. Lets see if I am right.

TESLA LONG OPPORTUNITY TESLA IS PREPARING FOR A BULLISH UPTREND , the 200 MA GIVES AS A CONFIRMATION WURH REJECTION OF FIBO'S LVL , WITH A HIDDEN DIVERGANCE , COULD REALLY CONFIRM OUR PROBABILITY :)

TSLA From here?!Looking for TSLA to do a similar movement to previous ATH and a bit of a sideways movement, then continuation higher.

My long-term scaling in for TSLA stockDisclamer: I am extremely bullish on tesla, I have been a shareholder of tesla since 800 dollars pre split and I am planning on adding more due to the Q4 conference call and all the bullish catalysts that will occur in the near future (2021).
Considering that the stock is in a consolidation after a big push, I'll scale in at 840, 810 and 750. Short term I don't see the price going below 680 and I have a price target of 1150 for Tesla so I should get a 36% return for the 840 scale in in a year which I am happy for.
Remember that Tesla is super volatile, it could hit 1000 this month and the 600 the month after. However I am confident that TSLA long-term will be a bargain at these price as it was when I scaled in the other time at 600-650 range.


TESLA IS GOING UP MORE NEXT WEEKSi HIGHLY RECOMMEND BUY POSITION BECAUSE TESLA NEXT WEEK WILL GO UP, SO EASY MONEY AS I SAID EVERYDAY


TSLA stock target price before 20 Jan 2021 : 1080$ ~ 1256$.It's possible that TSLA drop down at magic numbers like 888$ or 999$.
That's easy TSLA rally to 900$ on 12 Jan 2021.
It's a good idea that buy some really cheap options to hedge TSLA meltdown, ex. TSLA put Jun 21 at strike 270$ ~ 495$.
Short some TSLA CFD with little stop-loss order when TSLA diving.
The market could reach a incredible high level before 20 Jan 2021.
be careful when TSLA higher than 1080$.
Double-Tops pattern
fuzzy range 12xx$~13xx$
270$ is a potential bottom price.
However, everything is
possible. The most optimistic scenarios
for TSLA is 2295$ at end of the year 2021.
stock analysis by Jiucai334
