UMAUSDT Forming Bullish WaveUMAUSDT is currently demonstrating a bullish wave pattern, signaling strong upward momentum and trend continuation. This wave formation suggests that the coin has entered a healthy impulsive phase, where higher highs and higher lows are forming consistently. The recent price action shows accumulation at key support levels, followed by breakout moves that align with this bullish structure, indicating renewed confidence among buyers.
Volume has remained consistently strong, which adds further credibility to the bullish wave pattern. Increasing trading volume during each leg up is a key confirmation that institutional and retail traders alike are stepping in. UMA, the native token of the UMA protocol focused on decentralized finance derivatives, is gaining traction again, fueled by both technical momentum and renewed interest in DeFi utility tokens.
With an expected gain range of 40% to 45%+, UMA appears poised for a substantial upside move if the current pattern plays out. Key resistance levels will need to be tested and broken, but the wave structure suggests buyers are in control. This setup presents an appealing opportunity for swing traders and trend followers who look for high-potential breakout trades with strong volume support.
✅ Show your support by hitting the like button and
✅ Leaving a comment below! (What is You opinion about this Coin)
Your feedback and engagement keep me inspired to share more insightful market analysis with you!
UMAUSDT

UMAUSDT — Major Battle at Demand Zone, Waiting for Breakout?🔎 Overview
The weekly chart of UMA/USDT is showing a very interesting setup:
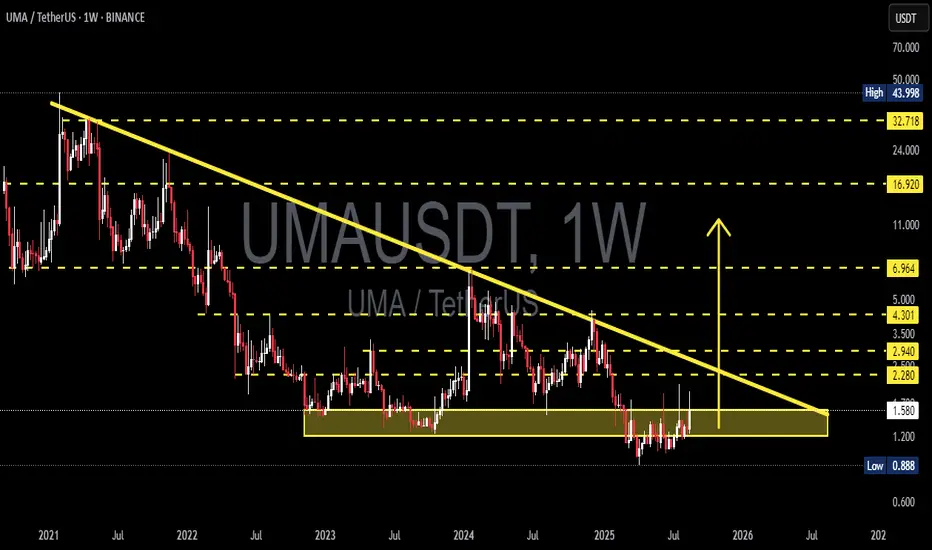
Since 2021, price action has been consistently forming lower highs, capped by a long-term descending trendline (yellow line).
On the other side, buyers continue to defend the strong demand zone at 1.20 – 1.70 (yellow box).
This structure has formed a multi-year descending triangle/base — a strong sign of long-term accumulation and compression.
In short, UMA is now at a crucial decision point: either a breakout that may spark a new bullish phase, or a breakdown toward new lows.
---
🟢 Bullish Scenario
1. The first confirmation will be a weekly close above the descending trendline and key horizontal level 2.28 USDT.
2. If confirmed, potential upside targets are:
2.94 USDT → minor resistance
3.50 USDT → psychological level & prior supply zone
4.30 USDT → major resistance
6.96 USDT → extended target for strong momentum
3. A high-volume breakout could trigger a short squeeze, accelerating price movement upward.
📌 Key point: A breakout above 2.28 could open the door toward the 4–7 USDT range.
---
🔴 Bearish Scenario
1. If the price fails to hold 1.20 – 1.30 USDT, the major demand zone collapses.
2. Next key downside target will be 0.888 USDT (the historical low).
3. Losing that level would push UMA into new price discovery to the downside, with no strong support below.
📌 Key point: Below 1.20, bearish pressure dominates, with risk of retesting 0.888 USDT.
---
📐 Pattern & Current Setup
Pattern: Multi-year descending triangle with flat demand vs sloping supply.
Current state: Sideways inside demand, waiting for a decisive move.
Sentiment: Neutral → Bullish if breakout confirmed, Bearish if demand breaks.
Weekly timeframe: Always wait for weekly close confirmations, not just intraday wicks.
---
⚖️ Trading Plan & Risk Management
Conservative traders: Wait for a confirmed breakout and retest above 2.28 before entering.
Aggressive traders: May accumulate small positions inside 1.20–1.70 demand zone with tight stop-loss below 1.20.
Risk/Reward: Attractive setup since downside is limited (tight invalidation), while upside targets are layered and potentially exponential.
---
🔥 Final Takeaway:
UMA is at a multi-year inflection point. As long as the demand zone holds, it remains an attractive accumulation area. A breakout above the descending trendline could trigger a strong bullish reversal, while losing 1.20 would expose UMA to retest its historical low at 0.888.
#UMA #UMAUSDT #CryptoAnalysis #TechnicalAnalysis #PriceAction #DescendingTriangle #SupportResistance #BreakoutSetup #CryptoTrading #AltcoinAnalysis
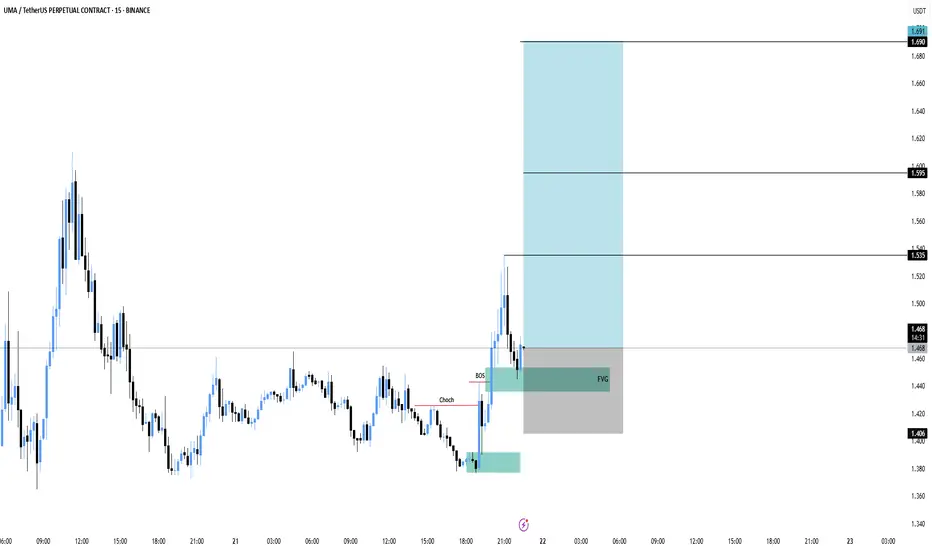
UMA Loading a Big Move – Don’t Miss This Setup!UMA has shown a clear change of character with a bullish break of structure. Price is now retesting the fair value gap (FVG) area, setting up for a possible continuation move upward.
Entry: 1.47
Stoploss: 1.406
Targets:
1.535
1.595
1.691
If buyers defend the FVG zone, UMA could rally toward higher targets with strong momentum.
UMAUSDT Forming Bullish WaveUMAUSDT is currently demonstrating a bullish wave pattern, signaling strong upward momentum and trend continuation. This wave formation suggests that the coin has entered a healthy impulsive phase, where higher highs and higher lows are forming consistently. The recent price action shows accumulation at key support levels, followed by breakout moves that align with this bullish structure, indicating renewed confidence among buyers.
Volume has remained consistently strong, which adds further credibility to the bullish wave pattern. Increasing trading volume during each leg up is a key confirmation that institutional and retail traders alike are stepping in. UMA, the native token of the UMA protocol focused on decentralized finance derivatives, is gaining traction again, fueled by both technical momentum and renewed interest in DeFi utility tokens.
With an expected gain range of 90% to 100%+, UMA appears poised for a substantial upside move if the current pattern plays out. Key resistance levels will need to be tested and broken, but the wave structure suggests buyers are in control. This setup presents an appealing opportunity for swing traders and trend followers who look for high-potential breakout trades with strong volume support.
✅ Show your support by hitting the like button and
✅ Leaving a comment below! (What is You opinion about this Coin)
Your feedback and engagement keep me inspired to share more insightful market analysis with you!

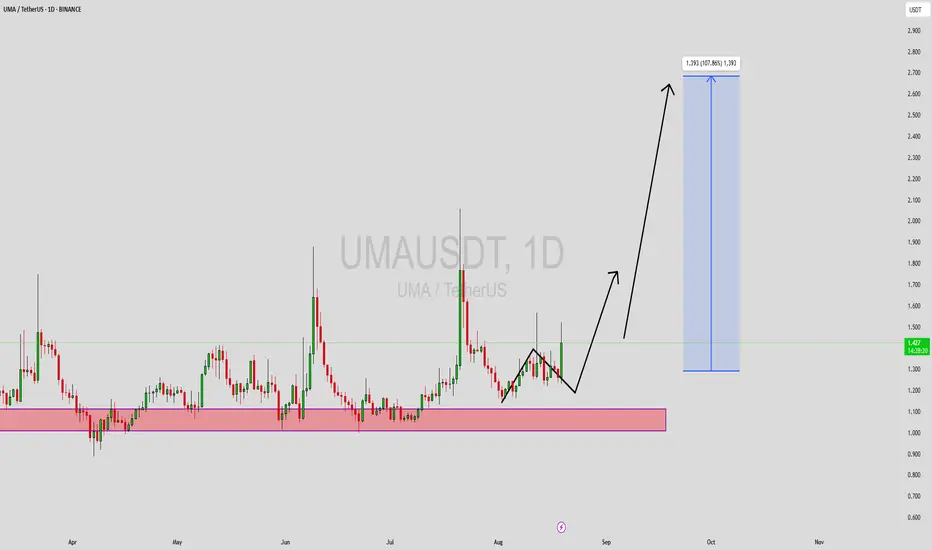
UMAUSDT Forming Bullish WaveUMAUSDT is exhibiting a strong bullish wave pattern, signaling a powerful upward momentum that could drive the price significantly higher in the coming sessions. This pattern often indicates a healthy continuation of trend following a consolidation or corrective phase. The current structure suggests that UMA is preparing for another leg upward, potentially reaching gains between 90% to 100%+ based on the historical wave amplitude and projected breakout zones.
Volume activity in UMAUSDT has remained consistent and healthy, supporting the idea that institutional and retail investors alike are accumulating during this setup. This type of volume behavior is often a key indicator that a significant move is imminent. When price aligns with volume in this way, it adds further credibility to the bullish thesis and highlights growing interest in the project across the market.
Fundamentally, the UMA project continues to attract attention with its decentralized financial contracts and oracle solutions, which are gaining traction in broader DeFi ecosystems. The technical setup now mirrors this fundamental strength, providing a strong combination that many smart traders and swing investors look for. With bullish wave patterns typically followed by explosive moves, UMAUSDT should be on every breakout trader’s radar.
✅ Show your support by hitting the like button and
✅ Leaving a comment below! (What is You opinion about this Coin)
Your feedback and engagement keep me inspired to share more insightful market analysis with you!
#UMA is 102% ready for the pump#UMA is 102% ready for the pump..
Hold Tight And Enjoy Ride.
!! Om Nmah Shiavye !!
$ Namaste $
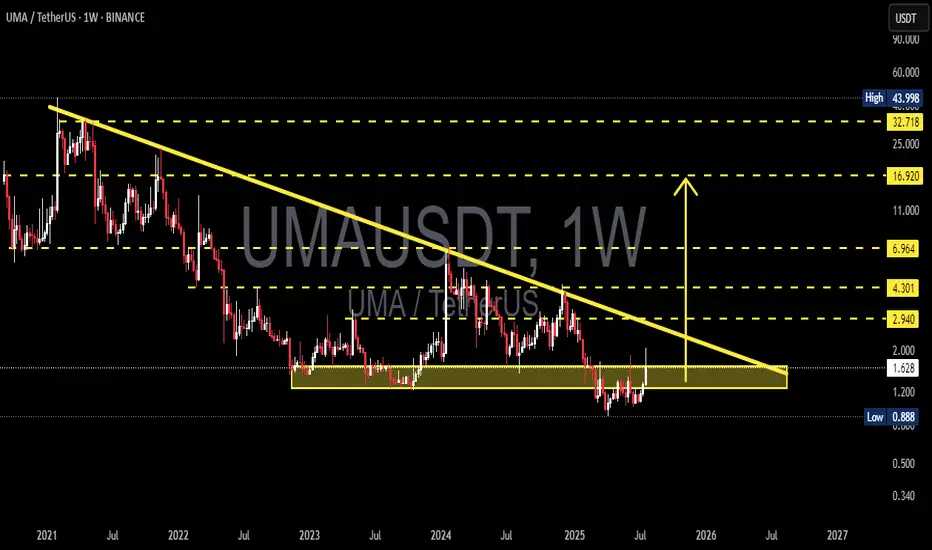
UMA/USDT Weekly Analysis – At the Edge of Compression?📉 Chart Overview:
UMA/USDT has been in a long-term downtrend since its peak in 2021. For nearly three years, price action has been trapped within a descending triangle pattern, forming consistent lower highs while holding a strong horizontal support zone around $0.88 – $1.20.
Over the last two years, UMA has been consolidating sideways, creating a massive accumulation base. Now, the price is sitting just beneath the descending trendline, putting the asset in a critical compression zone — a potential breakout could trigger a major trend shift.
🔍 Technical Pattern Breakdown:
Multi-year Descending Triangle structure with a well-defined horizontal base.
Long-term accumulation zone between $0.88 – $1.20, repeatedly tested but not broken.
UMA is currently pressing against the descending resistance line, building pressure.
Setup hints at a compression breakout, often leading to explosive moves when volume confirms.
🟢 Bullish Scenario – If Breakout Confirms:
If UMA breaks out convincingly above the descending trendline (~$1.85) with a weekly candle close and strong volume, the market could start targeting these levels:
1. ✅ $2.94 – First horizontal resistance from prior breakdown zone.
2. ✅ $4.30 – Key structure from mid-2023.
3. ✅ $6.96 – Larger swing target from historical resistance.
4. 🚀 $16.92 – Mid-to-long term target if bullish momentum sustains.
5. 🎯 $32 – $43 – Potential long-term upside under extreme bullish conditions (not base scenario).
Bullish Confirmation Signs:
Weekly candle close above trendline + high volume
RSI breaks above 50 with momentum
Bitcoin remains stable or bullish
🔴 Bearish Scenario – If Rejected Again:
If UMA fails to break the trendline:
Price could drop back into support: $1.20 → $0.88
A breakdown below $0.88 would open the door to new all-time lows
Watch for wicks and volume drop as signs of weakness
When Is Breakout Considered Failed?
Strong rejection from $1.80–$1.90
Weekly close back below $1.20
Broader market (especially BTC) turns sharply bearish
🎯 Trader Strategy Outlook:
Swing traders: Wait for breakout confirmation and retest before entering.
Long-term investors: The $0.90–$1.20 range remains a solid accumulation zone with tight risk management.
Conservative traders: Avoid entry until a clear close above the descending trendline.
📌 Final Thoughts:
> UMA is now positioned at a major inflection point after two years of sideways compression. The chart structure shows clear signs of long-term accumulation, and a breakout could mark the beginning of a new bullish trend cycle. However, patience and confirmation are crucial — this is a setup worth watching, not chasing.
#UMAUSDT #UMA #CryptoBreakout #TechnicalAnalysis #DescendingTriangle #AltcoinSetup #SwingTradeOpportunity #CryptoAccumulation #BreakoutWatch #PriceAction
UMA · $6.65 Easy Target · Much Higher Possible Late 2025 · 1220%$6.65 is actually a very easy and conservative target. We tend to cap profits potential when we approach the market using leverage. When doing spot, we get all the targets all the way to a new all-time high—price discovery—and beyond.
Here we have a very strong bullish chart setup. Consider this. When the action recovers above long-term support we know this to be bullish. I just mentioned this signal on APEUSDT.
UMAUSDT moved below not only August 2024 but also October 2023. It has recovered, it is trading back above both levels and this is truly as good as it gets. We can see a break above EMA55/89 (3D sessions) coupled with rising volume and very, very strong full green candle. This type of action reveals the start of a major bullish advance.
I think UMA can easily hit $10, $17 and $23. Somehow I am getting the feeling that $23 will not be the end of the bull market for this pair. Which means that it can go higher... We will have to wait and see of course. Growth potential is always unlimited. There is no limit to the upside. Anything can happen. We are open to see maximum growth in the coming months. The strongest bullish cycle in the history of Crypto.
Thanks a lot for your continued support.
Namaste.

#UMA/USDT#UMA
The price is moving within a descending channel on the 1-hour frame, adhering well to it, and is heading toward a strong breakout and retest.
We are experiencing a rebound from the lower boundary of the descending channel, which is support at 1.36.
We are experiencing a downtrend on the RSI indicator that is about to be broken and retested, supporting the upward trend.
We are heading toward stability above the 100 moving average.
Entry price: 1.41
First target: 1.45
Second target: 1.50
Third target: 1.57

Uma Update: How To Use Moving Averages For Trading SuccessThe moving averages can be an excellent tool for trading, you can use them to confirm where the market is headed next. I no longer use them as often as before but you can use them all the time to know which pair is weak and which one is strong.
When the action is happening daily above EMA55/EMA89, the bullish bias is confirmed mid-term. When the action is happening daily above MA200, long-term growth is possible. And it keeps on going with the shorter and longer EMAs.
I just mentioned EMA89 looking at Compound (COMPUSDT), the same signal is present here.
UMAUSDT produced three days green with really high volume. It was removing EMA89 as resistance, now it trades above this level which signals that the mid-term bullish bias is fully confirmed.
Without the EMAs plotted on the chart, we have this:
The last three days look like nothing special, just a small advance. But, when the moving averages are on, you know the bulls have taken control and it makes it easy to go LONG.
See the chart:
Now you know, we are set for long-term growth. It is not me saying it, this is the message coming from the chart. I am translating the chart. The chart is saying up.
Everything I share is data supported, it is all based on the actual market, that is why we produce such a high success rate. 100% data supported analysis. Simply the best. Don't you agree?
Thank you for reading.
Namaste.

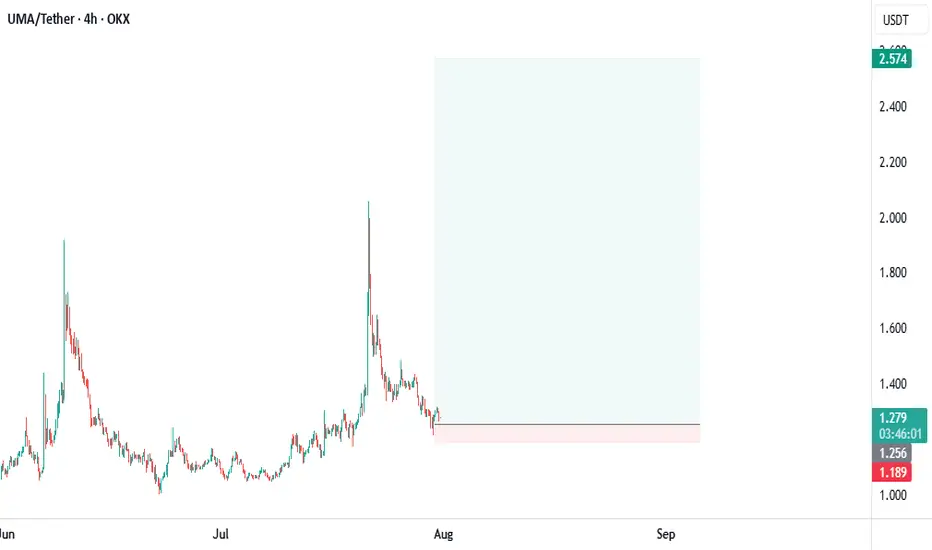
Uma Is Yet To Move: 5X Low Risk Lev. Trade Setup (PP: 3500%)This is a good chart setup and I'll tell you why, UMAUSDT is yet to move. Maximum growth from its 7-April low amounts to 58%. The current price trades some 40% above its correction bottom. Seeing some pairs growing already 300% and 400%, this means that UMAUSDT is still early. For this reason, we can open a LONG position with leverage here. Low risk vs a high potential for reward.
A 700% target with 5X leverage would be equal to 3500% profits potential. Pretty nice. But with such a chart, one can secure profits even sooner say at $3.69 for 197%. With 5X this would be equal to 985%. Opportunities like this one are plentiful right now. This is only the start.
➖ Technical analysis
It is easy to see the descending channel ending and the action going sideways with a slight upward bent. This means that the downtrend is over. UMAUSDT current action is part of the accumulation phase. Accumulation happens before a new cycle starts. The longer the accumulation phase, the stronger the bullish breakout that follows.
All the targets on the chart are easy targets. You can adjust the amount of margin to your liking. Low leverage can result in a big win with low risk. High leverage can result in full liquidation or total loss. It is better to earn big rather than lose fast.
Right now it is good to play safe, if a shakeout happens, you keep your position and this position can pay big. Becoming too aggressive can result in getting wiped out and we don't want that, we want growth.
Namaste.

#UMA/USDT#UMA
The price is moving within a descending channel on the 1-hour frame, adhering well to it, and is heading for a strong breakout and retest.
We are seeing a bounce from the lower boundary of the descending channel, which is support at 1.36.
We have a downtrend on the RSI indicator that is about to break and retest, supporting the upward trend.
We are looking for stability above the 100 moving average.
Entry price: 1.39
First target: 1.42
Second target: 1.45
Third target: 1.49

UMAUSDT – Critical Level at 1.278!UMAUSDT – Critical Level at 1.278! 🚨
“If 1.278 breaks, we’re flipping bearish—and we won’t hesitate to short!”
🔥 Key Insights:
✅ 1.278 = Make-or-Break Level – Holding = bullish continuation, breaking = serious trouble.
✅ First Retest = High-Probability Short Zone – If we break, we wait for confirmation.
✅ Aggressive Approach? Direct Short on Breakdown – For those who love momentum plays.
💡 The Game Plan:
If 1.278 Holds – We Stay Bullish – No reason to fight the trend.
If 1.278 Breaks – Short on Retest or Directly – We trade what we see, not what we hope.
CDV & Volume Profile Must Confirm Weakness – If buyers disappear, we attack.
“Markets don’t lie—if this level gives way, we strike without hesitation!” 🚨🔥📉
A tiny part of my runners;
💼 STMXUSDT: 2 Buying Areas
🐢 TURBOUSDT: Buy Zones and Buyer Presence
🌍 ICPUSDT.P: Massive Upside Potential | Check the Trade Update For Seeing Results
🟠 IDEXUSDT: Spot Buy Area | %26 Profit if You Trade with MSB
📌 USUALUSDT: Buyers Are Active + %70 Profit in Total
🌟 FORTHUSDT: Sniper Entry +%26 Reaction
🐳 QKCUSDT: Sniper Entry +%57 Reaction

UMAUSDT 1WUMA ~ 1W Analysis
#UMA This is the lowest support for now. Buy from here if you still have a Conviction on this coin with a minimum target of 20+

UMA ANALYSIS📊 #UMA Analysis : Update
✅As we said earlier, #UMA performed same. Around 80% move done in #UMA. There was a formation of Descending Channel Pattern on weekly chart with a breakout🧐
Current we can see a little retest and then we could target for next resistance
👀Current Price: $2.890
🚀 Target Price: $3.800
⚡️What to do ?
👀Keep an eye on #UMA price action and volume. We can trade according to the chart and make some profits⚡️⚡️
#UMA #Cryptocurrency #TechnicalAnalysis #DYOR

UMAUSDT 1WUMA ~ 1W
#UMA retest this support block,. And still continues to maintain its bullish structure. If you still have Conviction on this coin,. This support block will be a good buying place for now.

UMA 4 year long triangle violent breakout incomingIf you ever wonder what drives violent upward movement of altcoins when they make 30-50% daily gains for many days over the course of many weeks, this chart for UMA is a perfect example.
The coin that has only dumped for over 4 years after the initial massive rally in 2021 is poised to repeat a similar path in 2025.
Large volumes of desperate sell volume were registered earlier this year and marked the bottom and switch to macro uptrend for UMA. FA analysts gave up on the coin that powers Polymarket (the undisputed leader of onchain betting) assuming it will never pump. They simply ignored the fact that TA is the king and when you are in a downward movement, not bullish news will change the price action.
However, when markets turn bullish and altseason comes, the projects with the strongest FA shine. Watch that triangle violently break out, Ripple style soon

UMAUSDT Short Setup / Futures TradeBINANCE:UMAUSDT
COINBASE:UMAUSD
📈Which side you pick?
Bull or Bear
Low-risk status: 3x-4x Leverage
Mid-risk status: 5x-8x Leverage
(For beginners, I suggest low risk status)
👾Note: The setup is active but expect the uncertain phase as well. also movement lines drawn to predict future price reactions are relative and approximate.
➡️Entry Area:
Yellow zone
⚡️TP:
3.66
3.53
3.41
3.29
3.13
🔴SL:
4.195
🧐The Alternate scenario:
If the price stabilizes against the direction of the position, below or above the trigger zone, the setup will be canceled.

UMA USDT 300% potential UMA/USDT has a 300% potential upside if it sustains strong support levels and breaks significant resistance zones on the weekly timeframe. Growing adoption of the UMA protocol for decentralized financial contracts, coupled with bullish market sentiment, could drive such exponential growth.

UMAUSDT 5DUMA ~ 5D
#UMA If you still have Conviction on the coin,. buy in stages from here. with a minimum target of 20%. It is only a matter of time until this resistance line is broken

UMAUSDTNSE:UMA ~ 5D
#UMA If you still have Conviction on this coin, buy gradually on this support block. Minimum target 20%++

UMA ANALYSIS📊 #UMA Analysis
✅There is a formation of Descending Channel Pattern in daily timeframe.
We can see a breakdown of major trendline in #UMA and we would see a little more retest towards it's support zone and then a bullish movement could be seen
👀Current Price: $2.477
🚀 Target Price: $4.370
⚡️What to do ?
👀Keep an eye on #UMA price action and volume. We can trade according to the chart and make some profits⚡️⚡️
#UMA #Cryptocurrency #Breakout #TechnicalAnalysis #DYOR

UMAUSDTUMA ~ 5D ✅
#UMA Make purchases gradually in this pattern. In our opinion, it is only a matter of time that this descending pattern is successfully broken.
