Add a bag of UMAUma is ready to fly to moon and will move to his ATH buying gown hai 16.5 - 14$ it following several support line and soon it will break it resistance line
Add a bag of UMA
HAPPY TRADING
UMAUSDT

UMA moves slowlyI'm sorry for the messy chart, but I prefered to leave both patterns to make you understand.
As you can see the breakout from the descending channel I had posted weeks ago is still happening but very slow as there are too many sells in the resistance area (purple rectangle). It appears clear from the VLPR (more yellow than purple in the histogram) and also from the behavious of the price itself. So basically, as soon as the people that wants to sell around 13 and 14USDT will finish UMA should be able to continue the breakout.
When that will happen two possible ways will present:
1) a breakout from the descending channel (modest pump)
2) price will touch 14.5USDT to form an Adam&Eve pattern. If this happens price should reach 22.5-23USDT
Now, I've a bag of UMA and I'm aware this token is underperforming my expecation, but if altseason will affect positively every good project then UMA should get enough volume to go over its ATH. However it's also up to the company which I think, it's no doing marketing in a very interesting way.
I'd buy some if price will retest channel's upper band.
Good luck


UMA/USDT 44% up within 24 hours so book some Profit#UMAUSDT Update:
#UMA did 44% profit within 24 hours.
you can book some profit and enjoy the ride.
UMA RESULTAfter the previous support level UMA was able to reach the support level but couldn't break it.so it was able to return the price and it was successful.
check the link below to see the previous analysis.

UMA/USDT did 31% within 14 hours#UMAUSDT profit update:
#UMA did 31% Profit within 14 hours.
Hope you enjoyed guys.

UMA potential targetsAfter a good retracement, UMA is ready for its next move!
With the huge volume traded on this coin during the past few days, I see targets shown on the chart. It can touch it's ATH (around 50$) easily in the midterm.
PS: it is also acceptable fundamentally.

UMAUSDTUMA is a platform for creating crypto derivatives native to Ethereum that operate like traditional derivatives. Without needing to go through a broker, creating a futures contract for the price of gold becomes as simple as buying or minting an ERC-20 asset called a synthetic token.

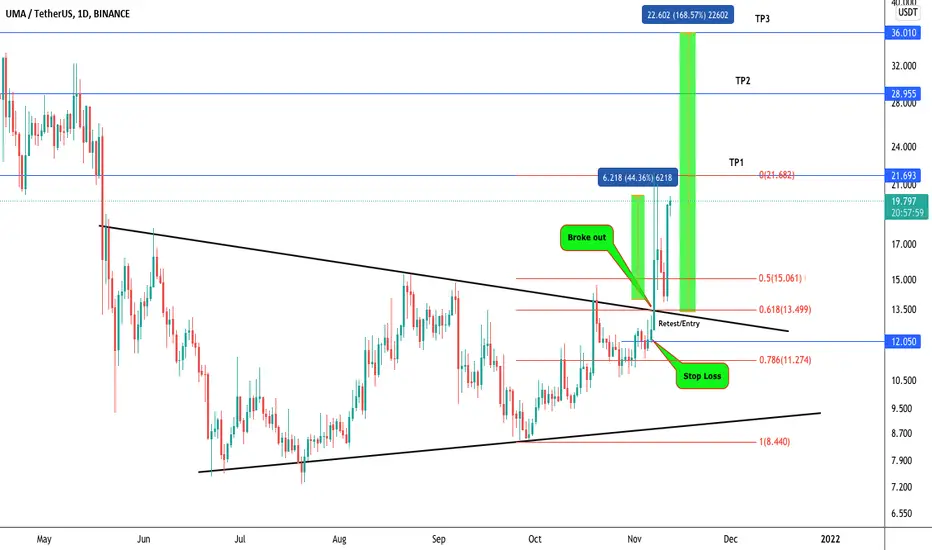
UMA Long$UMA already breakout Resistance level and Now ready to Retest.
Retest will be the best entry.
Entry:- $13.50-$14.20
Targets:- $21.70/$29/$36
Stop Loss:- $12

UMA/USDT Ready to 168% From here..?#UMA/USDT TA update:-
$UMA already breakout Resistance level and Now ready to Retest.
Retest will be best entry.
Entry:- $13.50-$14.20
Targets:- $21.70/$29/$36
Stop Loss:- $12
Support:- $13-$13.50
Resistance:- Targets

UMA/USD long limit entry mid termLong limit entry 26
SL 17,8
PT 42,6
BE 34
RRR 2:1
above POC + high volume break
BINANCE:UMAUSDT

UMA ResultWell on the previous analysis I stated that UMA has reached an important resistance level.
so I was waiting for a correction.Now that correction is complete and it reached a support level , and to me it seems like an interesting area to go long.
check the link below to see the previous analysis.

UMAUSD Final Target $28 - Technical Analysis - Patterns - LevelsIn this video:
5 minute charting analysis
Triangle(s) spotted
Reverse Head and Shoulders Pattern
Areas of resistance
Targets and final target of $28

UMAUSDT Technical Analysis⏳ Spot
💎 UMAUSDT has got rejected from the major resistance. It is going to have a pullback at the previous support and then we can expect another bullish move. It can pump after the resistance breakout
🌐 Tradingview
💵 Invest Only 5% of your Portfolio
🎳 Entry Now or at 15.261 to 17.385
☕️ TP1 21.854
🍺 TP2 26.235
🍻 TP3 30.084
🍾 TP4 33.845
🍷 TP5
🍸 TP6
🍹 TP7
🎁 TP8
🚫 SL 13.668 to 15.261
Good Luck 🎲
Check the Links in Description and If you LIKE this analysis, Please support our page and Ideas by hitting the LIKE 👍 button. ❤️ Your Support is really appreciated! ❤️
Traders, if you have your own opinion about it, please write your own in the comment box. We will be glad for this.
Feel free to request any pair/instrument analysis or ask any questions in the comment section below.
We will have more FREE forecasts in TradingView soon
Have a profitable day 😊👍🏻

UMA/ bullish fastly than I thoughtIn my last chart, I thought the price would be low to the end of this month and back later, but I was wrong.
UMA token is bullish fastly than I thought, and it is excellent for whom holding. The price can back and retest before pumping to new high targets.

UMAUSDT go longin my opinion it seems like a very interesting area to go long on this asset (UMA).
HOWEVER,Do not rely on my analysis and do you own research.

UMAUSD Looks Promising!Apply Caution.
PPPDirhams.
Disclaimer: This is just my idea. Am not liable for the end results if adapted by anyone. Trade cautiously as there are chances that you will lose your investment..

UMAUSDT is Heating up - BOS ConfirmedBOS - Break of structure
KR/KS - Key Resistance/ Support
ATH - All Time High
UMAUSDT🔥 - We are looking to see price fall back to the demand zone since BOS is confirmed.
I will look forward to buying in at demand zone ( 13.621 area )
Follow targets 1 and 2 to secure your profits. You may re-enter at our virtual demand zone and exit 50% at target 2, then leave the rest to see what price will do
Kindly do place your SL below KS.
Like, follow me and Comment below, let me know what you think.

UMA/USDT Long possition from current pricesUMA/USDT chart is on the second attempt to break and close above multi-week supply/resistance line (red line)
UMA retraced -82% from ATH
Support levels are marked green on the chart
Take profit levels are marked yellow on the chart
The trade setup is invalid if weekly closes belove 10.718

UMAUSDT Technical Analysis⏳ Spot
💎 UMAUSDT has broken above the symmetrical triangle, the retest has been successful and the pullback has happened already. After series of rejections I expect that it goes higher.
🌐 Tradingview
🏁 Short & Medium Term
💵 Invest Only 5% of your Portfolio
🎳 Entry Now or at 11.996 to 12.947
☕️ TP1 14.008
🍺 TP2 15.269
🍻 TP3 16.856
🍾 TP4 18.543
🍷 TP5 20.597
🍸 TP6
🍹 TP7
🎁 TP8
🚫 SL 11.295 to 11.996
Good Luck 🎲
Check the Links in Description and If you LIKE this analysis, Please support our page and Ideas by hitting the LIKE 👍 button. ❤️ Your Support is really appreciated! ❤️
Traders, if you have your own opinion about it, please write your own in the comment box. We will be glad for this.
Feel free to request any pair/instrument analysis or ask any questions in the comment section below.
We will have more FREE forecasts in TradingView soon
Have a profitable day 😊👍🏻

UMA - 2021-2022UMA needs more time for the accumulation phase to come back to the high price in next year

UMA bullish potentialUMA has been consolidating since end of May into a range between 14$ and 9$.
We are now at resistance which mean we could get rejected here, but volumes have entered well yesterday and MACD Daily/Weekly are looking good. BB are also opening in Daily which mean the move could continue and break the resistance.
A retest to 12$/11$ area would be an opportunity to go long and target a larger move higher into 20$ then 40$.

CRYPTO - UMA - Bull Flag almost complete. Get longCRYPTO - UMA - Bull Flag almost complete. UMA has just taken a nice healthy breather after some strong buying volume. The selling volume and strength is weak. The spring is building. Should explode again. If you look back this is the 3rd time this pattern has occurred on this run alone. Looks nice.
Volume = Large green candles on the last surge up. No volume on the bull flag.
RSI = not the best but the same pattern as previous bull flag.
Target 1 = 15.50
Stop = 11.80
