NASDAQ | Daily Double Top | GTradingMethodHello Traders 👋
🧐 Market Overview:
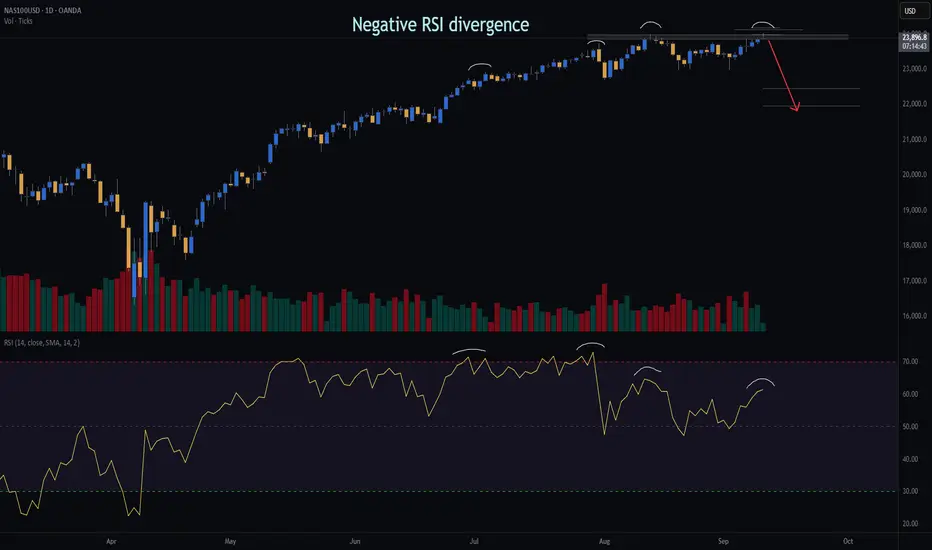
I’ve opened a short on the NASDAQ based on a clear double top setup that formed yesterday. Several of my key variables aligned, giving this trade a high-probability edge:
Negative RSI divergence → showing weakening buying momentum
Lower volume on the second top → indicating exhaustion
Daily candle closure within threshold → confirming structure validity
📊 Trade Plan:
RR: 9.1
Entry: 23 931
Stop Loss: 23 178
Take Profit 1 (50%): 22 453
Take Profit 2 (50%): 21 969
💡 GTradingMethod Tip:
When trading reversal patterns like double tops, I always wait for confirmation across multiple variables (momentum, volume, candle structure). This increases probability and reduces false entries.
🙏 Thanks for checking out my post!
Follow me for more setups and let me know — do you see this double top holding, or is there more upside left in the NASDAQ?
📌 Disclaimer:
This is not financial advice. This content is to track my trading journey and for educational purposes only.
Us100
DOW JONES INDEX (US30): To the New Highs
Dow updated the all time high again yesterday.
A broken structure and a solid rising trend line will compose
a significant contracting demand zone from where I will look for buying.
The next resistance will be 46350.
Wait for a retracement first, and anticipate more growth then.
❤️Please, support my work with like, thank you!❤️
I am part of Trade Nation's Influencer program and receive a monthly fee for using their TradingView charts in my analysis.

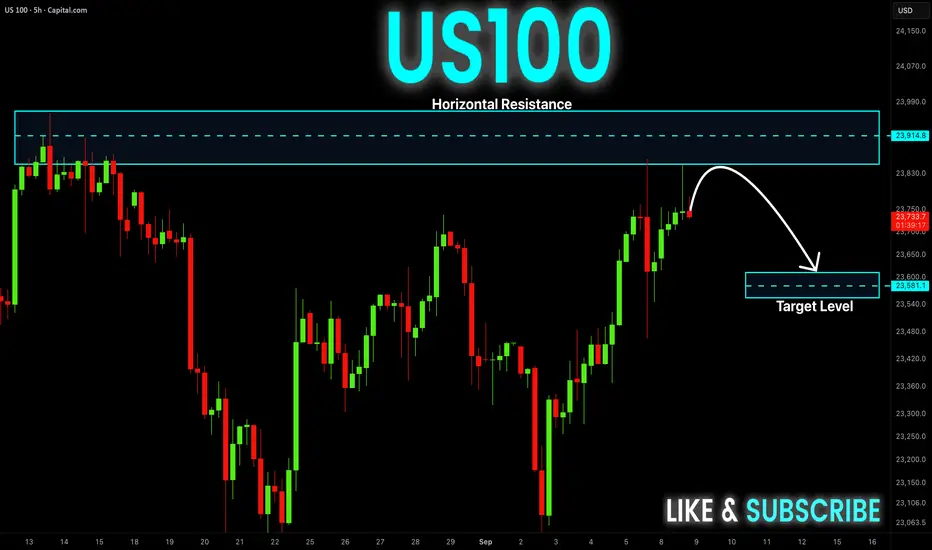
NASDAQ100 HIGH PROBABILITY SETUP SOON!!!🚨 NAS100 HIGH PROBABILITY SELL SETUP 🚨
* Here We Can See Clearly The Next Potential Move For US100 Coming Hours/Days.
* Keep Your Eyes Close On Your Trading Positions.
* Happy PIP Hunting Traders.
FXKILLA.

US100 Strong Bullish Bias! Buy!
Hello,Traders!
US100 keep trading in
A strong uptrend and
The index is now trying
To breakout the key
Horizontal level of 23,940
So IF the breakout is
Confirmed we will be
Expecting a further
Bullish move up
Buy!
Comment and subscribe to help us grow!
Check out other forecasts below too!
Disclosure: I am part of Trade Nation's Influencer program and receive a monthly fee for using their TradingView charts in my analysis.

S&P500 | Daily rising wedge | GTradingMethodGood morning fellow traders,
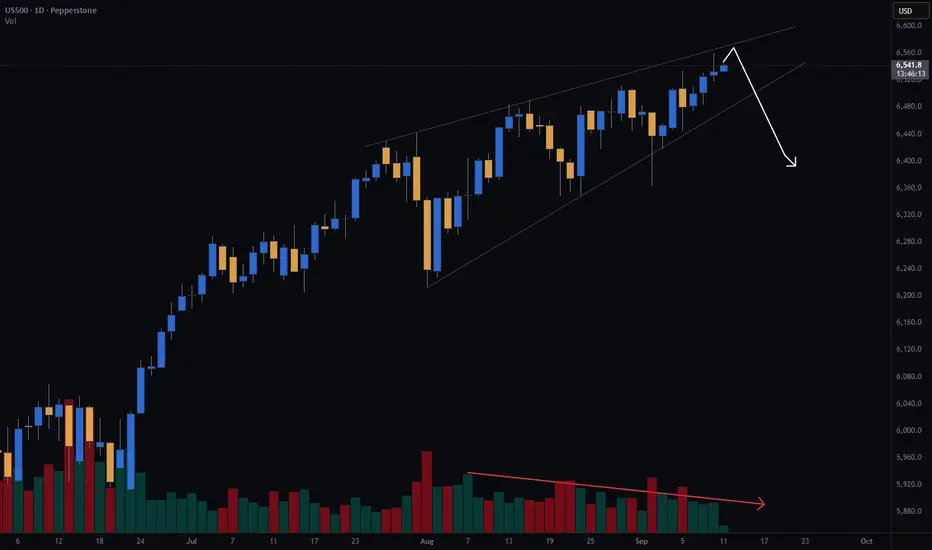
S&P price action is tightening inside a rising wedge on the daily chart, with volume steadily dropping.
Rising wedges often signal potential reversals, but with CPI on deck, volatility could go either way.
My guess, price tests top of rising wedge, finds resistance and down we go - a long way down.
Keen to hear your thoughts on whether CPI is going to be a catalyst for a breakout or breakdown?
Futures rise as traders await inflation data, Fed cuts in focusFutures rise as traders await inflation data, Fed cuts in focus
U.S. stock index futures rose slightly on Thursday as traders awaited key consumer price data at 8:30 a.m. ET, expected to show higher August inflation. Wednesday’s softer PPI report fueled bets on Fed rate cuts next week, with markets fully pricing in a 25-bps move and assigning a 10% chance of 50 bps.
Weak labor data reinforced easing expectations, while jobless claims numbers are also due today. The AI trade revived midweek, lifting chipmakers and utilities tied to data centers. Oracle gained 1.6% premarket, while gun stocks extended gains after news of a campus shooting. Despite September’s poor historical record, Wall Street has opened the month on a strong note, with strategists seeing Fed cuts as the key driver of market direction.
Beyond the Chart – NAS100 Through Technicals & Fundamentals⚖️ CAPITALCOM:US100 Fundamental Impact today
• The core driver is the US CPI (inflation) + Unemployment Claims at 3:30 pm.
• Expect increased volatility on NAS100 around that time:
• ✅ Lower CPI + weaker jobs → Bullish NAS100 (rate cut hopes).
• ❌ Higher CPI + strong jobs → Bearish NAS100 (higher for longer Fed).
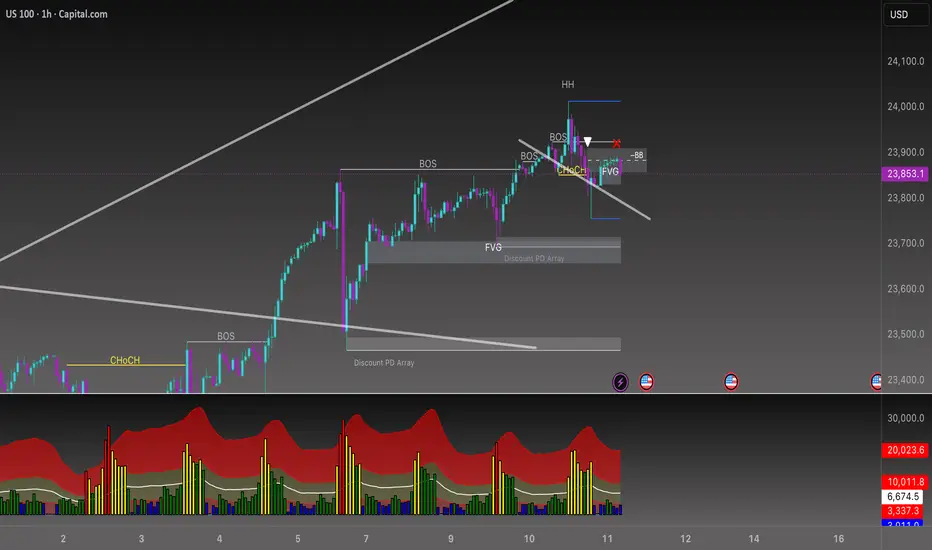
1. Bearish Continuation (Main Scenario)
• Rejection from the bearish FVG + BB zone → downside continuation.
• Targeting:
• 23,750 short-term liquidity sweep.
• Then 23,700–23,650 (discount FVG).
• Extended target: 23,540 (major discount PD array).
2. Deeper Retracement / Liquidity Sweep (Alternative Scenario)
• Price might push slightly above the bearish FVG / BB zone (~23,900–23,930) to sweep late shorts.
• Then reversal down, same targets as scenario 1.
3. Bullish Recovery (Less Likely for Now)
• If price reclaims above 23,950–24,000, structure shifts bullish again.
• Potential revisit of 24,100+ liquidity above the HH.
⸻
⚖️ Bias
• For now, bias is bearish unless 23,950–24,000 is broken with strength.
• Volume histogram also shows selling momentum increasing after the rejection.
BTC - Are the bulls looking for a liquidity grab?Market Context
Bitcoin is holding strong after bouncing from a higher support zone and is now pressing into an area packed with liquidity. The recent bullish price action has carved out multiple fair value gaps on the way up, each serving as confirmation of demand and strengthening the bullish structure. Above current price lies a major cluster of buy-side liquidity — a magnet for price.
Fair Value Gaps & Confirmations
On the way up, price created several bullish fair value gaps that have each been respected as support. The first, second, and now third retests into these imbalances show that demand continues to step in, absorbing supply and building pressure upward. Adding to that, a bullish inversion fair value gap (IFVG) has formed, giving extra confirmation that buyers are in control.
Liquidity Target Above
The most obvious draw for price is the heavy buy-side liquidity resting above recent highs. With so many stops positioned there, the market is incentivized to push higher and sweep that zone. The path toward it could involve another retest into one of the fair value gaps below before expansion takes place, or a direct continuation straight into the liquidity pocket.
Final Thoughts
This structure is showing textbook bullish strength: stacked fair value gaps, IFVG confirmation, and a clear liquidity pool overhead. Unless the market breaks back below the deeper support zone, the expectation remains a run into buy-side liquidity.
If this breakdown sharpened your view, a like is appreciated — and I’d love to hear from you: do you expect a retest first, or do we shoot straight into liquidity?

S&P | 30min Double Top | GTradingMethodHello Traders 👋
🧐 Market Overview:
The S&P has been pushing into new highs, but a potential double top is forming right at diagonal resistance. This is a key level for me — the confluence of structure and resistance makes this an area worth watching closely.
If the double top holds, price might first deviate through my entry range and then retest the diagonal resistance. For me to take a short, I’ll be looking for a 30-minute candle close back within the range as confirmation.
📊 Trade Plan:
RR: 3.5
Entry:6 537.4
Stop Loss: 6 543.8
Take Profit 1 (50%): 6 515
Take Profit 2 (50%): 6 511
💡 GTradingMethod Tip:
When trading double tops, I always wait for confirmation (like a close back within range). It reduces false entries and adds probability to the trade.
🙏 Thanks for checking out my post!
Follow me for more setups and let me know — do you think this double top will hold, or will the S&P push through resistance to fresh highs?
📌 Disclaimer:
This is not financial advice. This content is to track my trading journey and for educational purposes only.

US100 - New Highs are coming!Market Context
The US100 is trading within a strong bullish structure after bouncing from a well-defined support zone. Price has been respecting key levels on the way up, forming fair value gaps (FVGs) that act as stepping stones for continuation. The overall picture points to a market that is building momentum for a potential liquidity grab higher.
Support Zone & Initial Rally
The chart shows a strong support zone at the lows, which provided the foundation for the current bullish impulse. Once price tapped into this area, buyers stepped in aggressively, leaving behind multiple bullish imbalances on the way up. This confirms that institutional interest is present at these levels.
Fair Value Gaps & Structural Strength
On the rally, price created overlapping FVGs, including a bullish fair value gap and an inversion fair value gap (IFVG). Importantly, candles never closed below the primary FVG — reinforcing its validity as strong demand. This means that even if price retraces, these areas will be closely watched for re-entries.
Liquidity Grab & Next Move
Above current price action lies a clear buy-side liquidity (BSL) level. The market is likely to target this zone, either directly from current levels or after a retest into the stacked FVGs. A liquidity sweep above the highs would be the natural continuation of the bullish structure, unlocking the potential for new short-term highs.
Final Thoughts
The US100 is showing a textbook bullish setup: strong support, healthy retracements, and unmitigated FVGs acting as demand. As long as the lower support holds, the expectation remains for a run into the BSL above.
If this analysis brought value, drop a like — and let me know: are you waiting for the retest, or do you think the market runs the highs straight away?

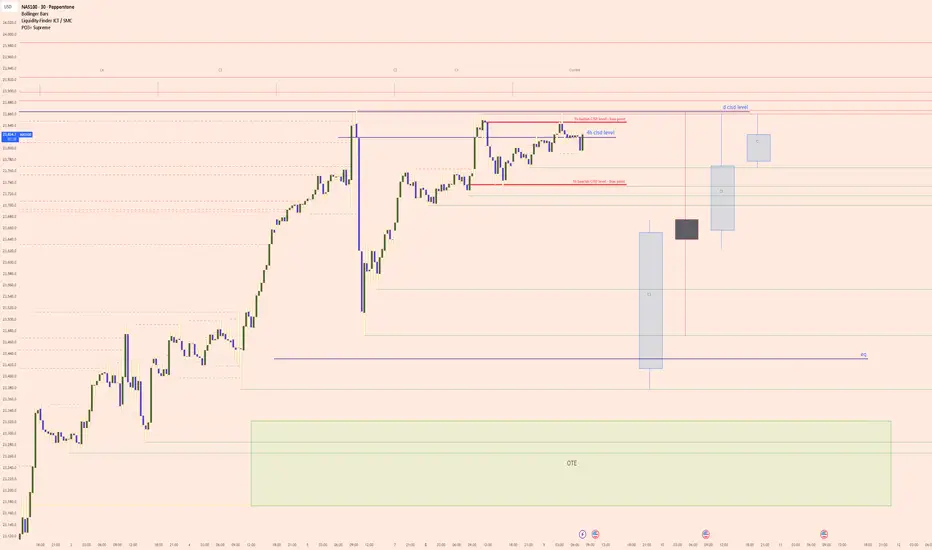
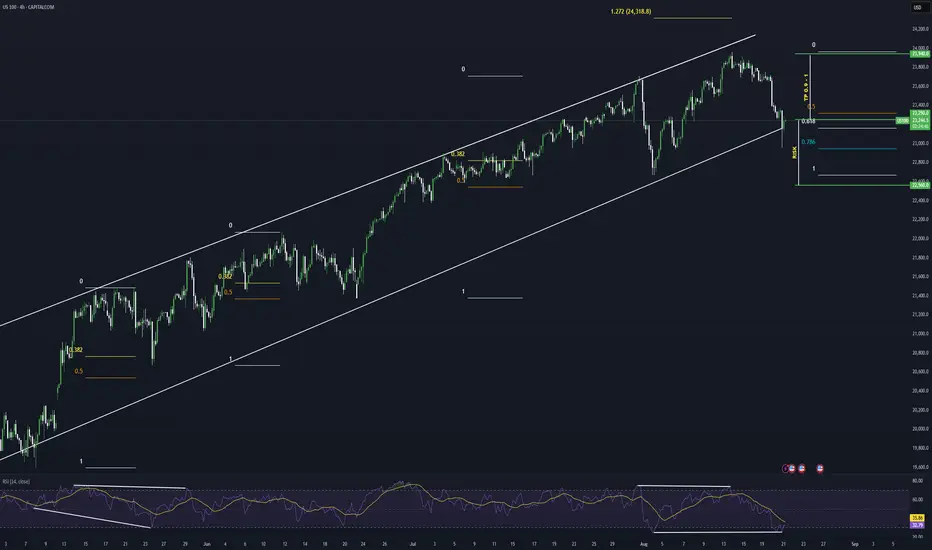
NAS100 (Nasdaq) Key Levels and Probable Draw on LiquidityA clear bullish market structure driven by an aggressive upward displacement.
This energetic move to the upside has created several price inefficiencies, or gaps, which are areas where price delivery was one sided.
Currently, price is consolidating in a premium range, above the equilibrium of the recent impulse leg.
The logical draw on liquidity, or the ultimate target for this bullish momentum, is the distinct old high labeled as the "d cisd level" (Daily change in the state of delivery).
The market is likely reaching for this level to clear out any resting buy side orders.
Before reaching that ultimate target, a retracement is a high probability event.
Price may pull back to rebalance the inefficiency at the "4h cisd level", which should now act as a significant support area.
This would represent a move back into a relative discount, offering a more favorable entry for buyers aiming for the highs.
Should this level fail, a deeper retracement into the larger green zone labeled "OTE" would signify an optimal entry point within the overall bullish leg.
The narrative remains bullish as long as these key lower levels of support are respected.
The alternative path would likely have led to chasing price in a premium, resulting in a poor risk to reward entry. PEPPERSTONE:NAS100 CME_MINI:NQ1! CME_MINI:MNQ1!
NASDAQ NAS100 at a Crossroads: Riding Nvidias Surge with CautionThe immediate reaction to Nvidia's stellar earnings has been decidedly bullish, propelling the NASDAQ higher. We saw a classic "buy the rumor, sell the news" event where the "news" was so powerful it triggered a "fear of missing out" (FOMO) rally with a healthy correction on Friday.
In the next one to two weeks, the near-term bias is bullish, but with extreme caution. The market has received the fundamental "all-clear" it was waiting for from its most important company. However, the index is now technically overextended and sentiment is euphoric, making it vulnerable to a short-term pullback or consolidation. The primary trend, however, remains bullish IMO.
1. The Catalyst: Nvidia Earnings
Nvidia didn't just beat expectations; it shattered them and raised future guidance, validating the entire AI investment thesis.
Revenue & EPS: Significant beats on both the top and bottom lines.
Guidance: Q2 revenue guidance of ~$28B was vastly higher than analyst estimates of ~$26.6B, demonstrating unprecedented demand for its Blackwell and Hopper architecture chips.
Data Center: Revenue of $22.6B, up 427% year-over-year, is the core of the story. This shows that AI infrastructure spending is not slowing; it's accelerating.
Stock Split: The announcement of a 10-for-1 stock split adds a psychological boost for retail investors, improving accessibility and reinforcing bullish sentiment.
Analyst Interpretation: This wasn't just a quarterly report; it was a fundamental confirmation that the AI revolution has tangible, massive earnings power. It alleviated fears that the AI trade was a bubble. For the NASDAQ, which is market-cap weighted and heavily influenced by NVDA, this was rocket fuel.
2. Technical Analysis (One-Day Timeframe Post-Earnings)
Price Action: The NASDAQ gapped up powerfully at the open, breaking cleanly above its previous consolidation range. This was a strong bullish signal.
Volume: The rally was accompanied by massive volume, confirming broad institutional participation. This wasn't a low-volume grind; it was a conviction move.
3. Macro & Fundamental Backdrop
Interest Rates: The market is currently pricing in a higher-for-longer stance from the Fed. However, recent economic data (PMIs, jobless claims) has shown slight signs of softening, which keeps hopes alive for a potential rate cut later in the year. A stable, non-accelerating rate environment is acceptable for tech stocks, especially those like Nvidia with explosive earnings growth that outweighs rate concerns.
Geopolitics: While always a risk (U.S.-China tensions, elections), the market has largely shrugged off these concerns for now, choosing to focus on the stellar corporate fundamentals.
Market Breadth: A key watch-out. The rally has been narrow, led primarily by the "Magnificent 7" (now perhaps the "Fab 1" - Nvidia). For the rally to be sustainable, we need to see broader participation from other sectors and smaller-cap stocks within the NASDAQ.
4. Likely Outcome for the Next 1-2 Weeks: Bullish with a Caveat
Bullish Scenario (60% Probability):
The momentum from Nvidia is likely to carry the NASDAQ higher in the very near term. We could see a continued "melt-up" towards 17,400-17,500 as underinvested funds are forced to chase performance and add equity exposure. Any dip will likely be shallow and bought aggressively, with the 17,000 level holding firm.
Consolidation/Pullback Scenario (35% Probability):
This is the most likely healthy outcome. After such a massive, emotion-driven surge, the market is likely to need a period of digestion. We could see the NASDAQ chop sideways for a week or two to work off the overbought conditions. This would reset the momentum indicators and allow the market to build a new base for the next leg higher. This is not a bearish signal; it is a strengthening signal.
Bearish Reversal Scenario (5% Probability):
A sharp reversal below the 17,000 support level and a fill of the earnings gap (~16,900) would be a significant warning. This would likely require a new, negative macro catalyst (e.g., unexpectedly hot inflation data, a major geopolitical escalation) that forcefully changes the interest rate narrative.
Trading & Investment Implication
For Bulls / Existing Longs: Hold positions. Consider taking partial profits on extreme strength, but avoid selling your entire position. The trend is your friend. Use any pullback to the 17,000 support as a potential buying opportunity.
For New Entrants: Chasing the green spike is high-risk. Be patient. Wait for the inevitable pullback or period of consolidation to establish a position. The risk/reward is poor on the day after a massive gap up.
For Bears: Fighting this tape is exceptionally dangerous. The fundamental news from NVDA is a game-changer for the index. Shorting based solely on overbought conditions is a quick path to losses.
Final Analyst Call: The next week is likely bullish with high volatility, potentially extending gains. However, the following week is highly susceptible to a consolidation or pullback as the initial euphoria settles. The overall trajectory for the next two weeks is cautiously bullish, with the understanding that a 2-4% pullback is a normal and healthy part of a strong uptrend.
The burden of proof is now on the bears to prove they can wrestle control back from a market that just received the best possible news from its most important constituent.
Not financial advice, this is just my opinion.

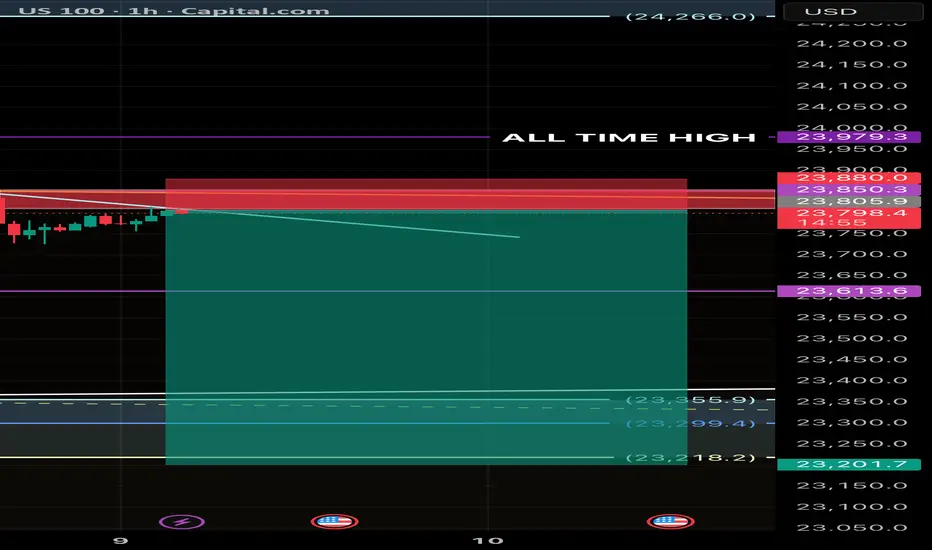
US100 – Short Setup Near All-Time High US100 – Short Setup Near All-Time High
Price is currently testing a critical resistance zone near the all-time high at 23,979. After rejecting from this level, I’ve identified a potential short opportunity with a favorable risk-to-reward ratio.
Price testing ALL-TIME HIGH (23,979) and rejecting from resistance zone.
🔴 Entry: 23,798 – 23,805
🛑 SL: 23,880
🎯 TP1: 23,613 | TP2: 23,355 | TP3: 23,201
⚡ Strong supply zone + rejection → high R:R setup (~1:5).
❌ Invalidation above 23,880.
#US100 #NASDAQ100 #indices #PriceAction #TradingSetup #SupplyDemand #ShortTrade
US100 Resistance Ahead! Sell!
Hello,Traders!
US100 keeps growing
In an uptrend but the
Index will soon hit the
Horizontal resistance
Of 23,970 from where
We will be expecting a
Local bearish correction
Sell!
Comment and subscribe to help us grow!
Check out other forecasts below too!
Disclosure: I am part of Trade Nation's Influencer program and receive a monthly fee for using their TradingView charts in my analysis.
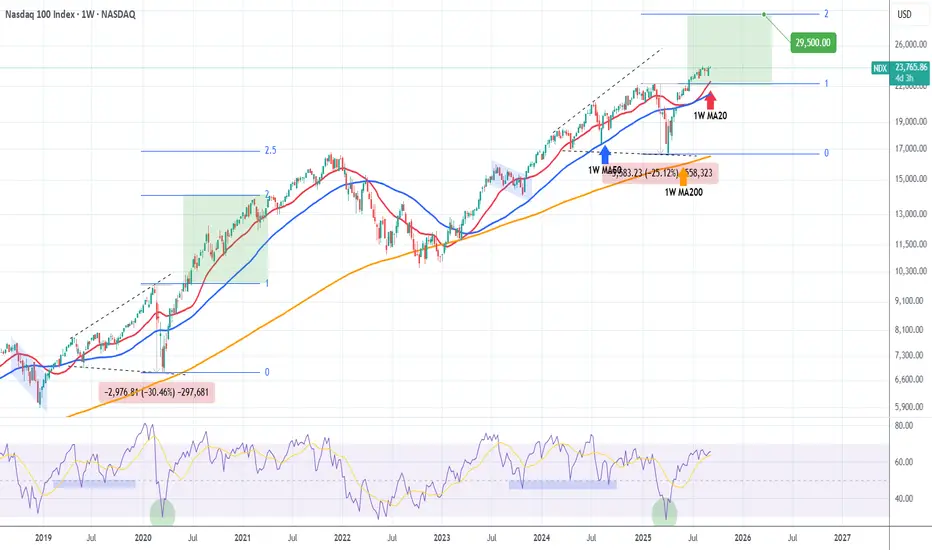
NASDAQ If this trend-line holds, it targets 29500.Nasdaq (NDX) has it's long-term bullish trend intact as it has mainly held its 1W MA50 (blue trend-line) as its Support. If it manages to hold the 1W MA20 (red trend-line) also, then it can extend the uptrend for even longer as the similarities overall with the 2020 fractal are noticeable.
As you can see, the March - April 2025 correction in particular, is very similar with the March 2020 COVID crash. Both sharp declines (-25% and -30% respectively), found Support just before hitting the 1W MA200 (orange trend-line). The 2020 fractal managed to rebound and reached its 2.0 Fibonacci extension and even extended the uptrend to the 2.5 Fib, all while the 1W MA20 remained intact (1W candles closed above it).
Even their 1W RSI sequences are identical and even on the price action that preceded the Megaphones. As a result, we remain bullish long-term as long as the 1W MA20 holds, targeting 29500 (Fib 2.0 extension).
-------------------------------------------------------------------------------
** Please LIKE 👍, FOLLOW ✅, SHARE 🙌 and COMMENT ✍ if you enjoy this idea! Also share your ideas and charts in the comments section below! This is best way to keep it relevant, support us, keep the content here free and allow the idea to reach as many people as possible. **
-------------------------------------------------------------------------------
💸💸💸💸💸💸
👇 👇 👇 👇 👇 👇
NASDAQ Potential Bullish ContinuationNASDAQ price action seems to exhibit signs of potential Bullish momentum as the price action may form a credible Higher Low with multiple confluences through key Fibonacci and Support levels which presents us with a potential long opportunity.
Trade Plan:
Entry : 23250
Stop Loss : 22560
TP 0.9 - 1: 23870 - 23940
S&P500 | 100 year bullish channel | GTradingMethodHello Traders - Happy Monday!
I thought this was a very interesting perspective on S&P500.
What they don’t want you to see... 👀
The S&P has been moving inside a bullish channel for nearly 100 years (since 1925).
Right now, price is breaking out of that channel but is it fakeout?
If it’s a fakeout, the implications are huge: we could be looking at a 70% drop back to the bottom of the channel.
⚠️ Chart is on the monthly timeframe with a logarithmic scale.
What do you think — breakout or fakeout? Very keen to hear all your thoughts
#TradingLife

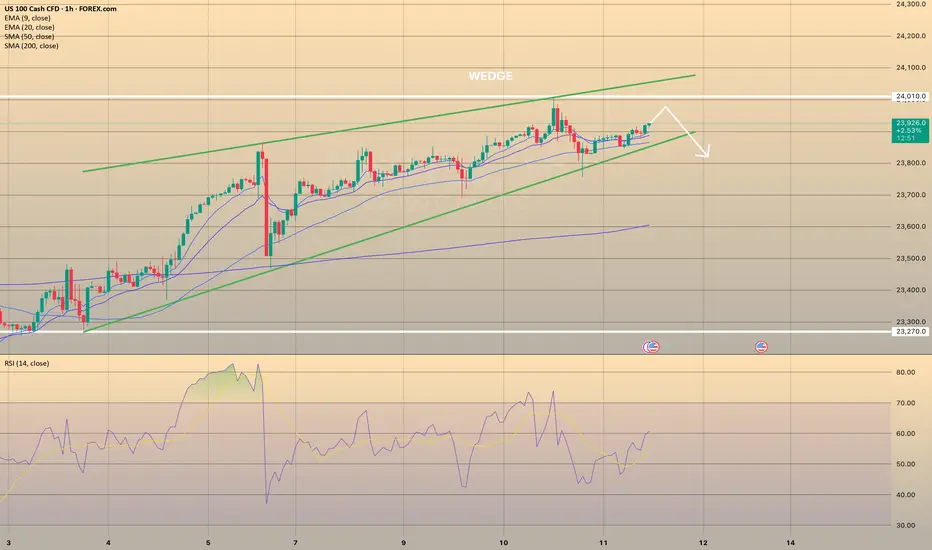
NAS100 - Stock Market, Waiting for Inflation Index?!The index is above EMA200 and EMA50 on the one-hour timeframe and is in its long-term ascending channel. If the drawn upward trend line is maintained, we can expect Nasdaq to reach its previous ATH. In case of its valid breakdown, its downward path will be smoothed to the specified demand zone, where it can be bought with appropriate risk-reward.
U.S. equities closed lower on Friday after a volatile session, capping off a turbulent week in negative territory. Initially, weaker-than-expected employment data fueled optimism that the Federal Reserve would move toward further rate cuts. However, growing fears of an economic recession quickly overshadowed that optimism and pushed the indexes into the red.
Following the labor market report, expectations for a 25-basis-point rate cut at the Fed’s September meeting are now virtually certain. The main question, however, is how fast subsequent cuts might unfold. Some analysts have even floated the possibility of a surprise 50-basis-point cut on September 17. Fed Chair Jerome Powell, speaking at the Jackson Hole symposium, stressed that risks stemming from labor market weakness may now outweigh inflation risks—a factor that could justify a shift in the central bank’s policy approach.
Nick Timiraos, a prominent Wall Street Journal reporter closely tracking Fed policy, noted that the sharp slowdown in job growth over the summer has likely cemented the Fed’s decision to cut rates by 25 basis points in the upcoming meeting.
Still, he made no explicit mention of a 50-basis-point move. While markets have raised the probability of that scenario to 14%, Timiraos believes the main focus remains on a more moderate reduction. He also observed that the latest jobs report has deepened uncertainty over the pace and scope of cuts beyond September—a challenge that policymakers and markets will grapple with in the months ahead.
Barclays Bank now projects the Fed will lower rates three times in 2025—each time by 25 basis points in September, October, and December. This is an upward revision from its earlier forecast of just two cuts in September and December.
President Donald Trump once again lashed out at Fed policy in a post on his social media platform, writing: “Jerome Powell should have cut rates long ago. But as usual, he has acted too late.”
Meanwhile, mounting concerns over ballooning fiscal deficits—not only in the U.S. but also in countries like Japan, France, and the U.K.—have placed added pressure on long-dated bonds. The yield on the 30-year U.S. Treasury briefly climbed to a one-and-a-half-month high last week. At the same time, the Treasury Department plans to issue new three-year, ten-year, and thirty-year securities next week, an event that could further fuel volatility in the bond market.
The coming week will be light in terms of data volume, yet the few scheduled releases will carry significant weight as inflation once again takes center stage. On Wednesday, the Producer Price Index (PPI) for August will be published. Forecasts suggest both the headline and core readings will show sharp declines compared to July.
On Thursday, the European Central Bank (ECB) will hold its policy meeting, where markets currently expect the deposit rate to remain unchanged at 2.15%. Shortly afterward, traders will turn their attention to the U.S. Consumer Price Index (CPI) for August, along with weekly jobless claims data—closely monitored for signs of potential weakness in the U.S. labor market.
Finally, on Friday, the preliminary University of Michigan Consumer Sentiment Index will be released. This survey has been a particularly important gauge of inflation expectations this year, offering deeper insights into how U.S. households perceive price trends.
The PPI, which reflects changes in goods prices at the factory gate, often provides more forward-looking signals than the CPI. As shown in July’s data, any unexpected surge in August’s numbers could temper investors’ optimism about the pace of rate cuts. For now, the impact of tariffs on goods prices appears limited, while the Fed’s main concern remains the risk of renewed inflationary pressures in the services sector. According to the Cleveland Fed’s Nowcast model, headline inflation rose 0.1% in August to reach an annualized rate of 2.8%, while core inflation held steady at 3.1%.

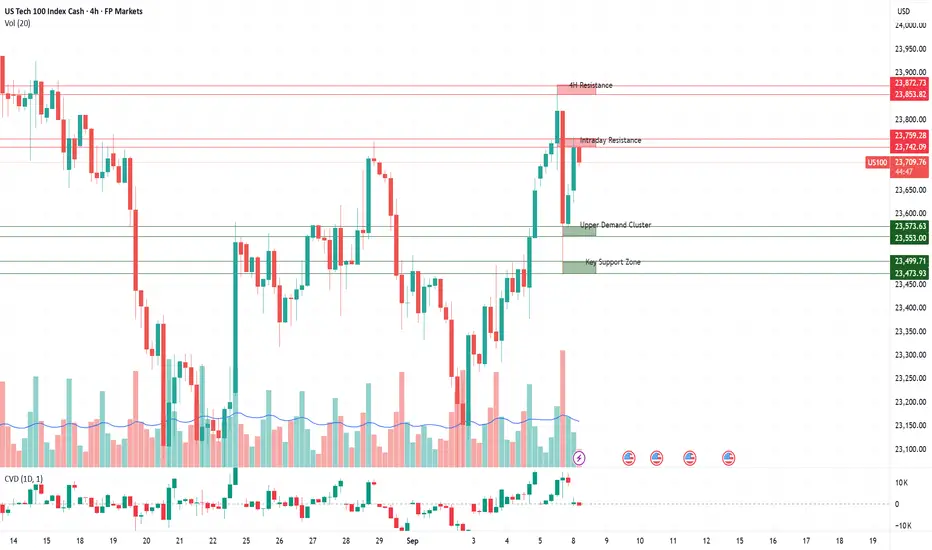
Nas100: Trading Levels in FocusSupply Zones (Red)
23,853 - 23,873
A strong supply zone near recent highs. Sellers are expected to defend aggressively here, making it a potential rejection area. A confirmed breakout and retest, however, could open the path toward new highs.
23,742 – 23,759
This zone reflects last week’s high-volume rejection. Acts as an intraday decision area: sharp rejections can trigger short setups, while a clean break and hold above would strengthen bullish momentum.
Demand Zones (Green)
23,553 – 23,573
A fresh demand zone aligned with recent breakout structure. Buyers may attempt to defend here for continuation longs. If broken, the zone flips into resistance, adding downside pressure.
23,473 – 23,500
Well-tested support area with prior absorption. Strong bounce potential, but multiple retests increase the risk of a breakdown. A failure here would likely accelerate bearish momentum.
Overall Sentiment: Cautiously Bullish on Fragile Ground
At its core, the market is cautiously optimistic right now. Positive momentum from Big Tech and expectations of looser monetary policy are fueling short-term upside potential. At the same time, consolidation and uncertainty around macro data keep sentiment restrained. Momentum is present but it relies on breakout moves holding.
US100 Technical Analysis! SELL!
My dear friends,
My technical analysis for US100 is below:
The market is trading on 23633 pivot level.
Bias - Bearish
Technical Indicators: Both Super Trend & Pivot HL indicate a highly probable Bearish continuation.
Target - 23440
About Used Indicators:
A pivot point is a technical analysis indicator, or calculations, used to determine the overall trend of the market over different time frames.
Disclosure: I am part of Trade Nation's Influencer program and receive a monthly fee for using their TradingView charts in my analysis.
———————————
WISH YOU ALL LUCK
BTC - Bullish continuation in the makingMarket Context
BTC has recently broken out of a long-standing descending trendline, marking a significant shift in sentiment. This breakout signals the end of the controlled downtrend and sets the stage for a possible bullish continuation. At the same time, the chart shows a clear sweep of sell-side liquidity at the lows, which often serves as the fuel for a reversal.
Trendline Breakout & Liquidity Sweep
The bullish breakout of the old upper trendline is an important technical event. Combined with the earlier sell-side liquidity sweep, this suggests that downside liquidity has been cleared and that the path of least resistance could now be higher. Such a combination often marks the start of a new leg in the trend.
Market Structure Shift Retest
Following the breakout, price has pushed higher and printed a market structure shift (MSS). The current retest of this MSS zone will be key — if it holds, it provides the ideal spot for bulls to reload positions. This retest acts as confirmation that the breakout is valid, not just a short-lived deviation.
Next Liquidity Grab & Upside Targets
Above the current range sits a clear buy-side liquidity pool. The next logical move would be a grab of that liquidity, which could extend into a more aggressive bullish expansion toward higher levels. The structure suggests a stair-step move higher: liquidity grab, retest, and then continuation toward 115k–117k zones.
Final Thoughts
The sell-side liquidity sweep, trendline breakout, and market structure shift all point to a bullish shift in momentum. The key lies in how price reacts to the retest — hold it, and the next liquidity levels are likely to be taken.
If this breakdown helped clarify the setup, a like is much appreciated — and let me know in the comments: are you playing the retest, or waiting for the liquidity grab above?

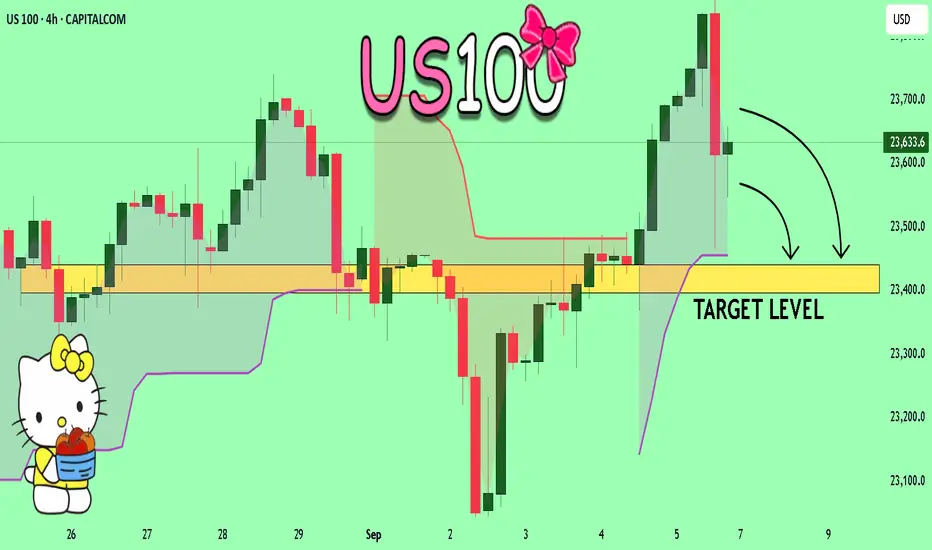
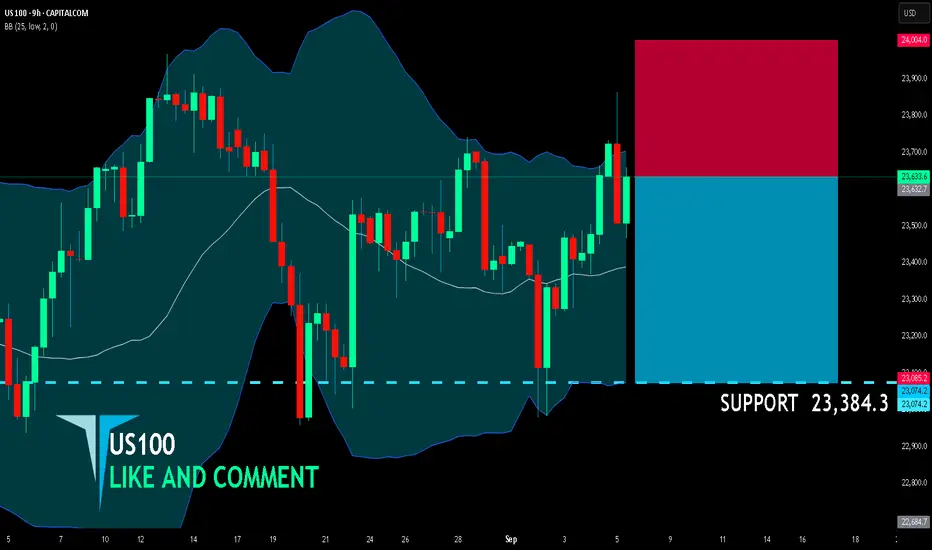
US100 SHORT FROM RESISTANCE
US100 SIGNAL
Trade Direction: short
Entry Level: 23,632.7
Target Level: 23,384.3
Stop Loss: 24,004.0
RISK PROFILE
Risk level: medium
Suggested risk: 1%
Timeframe: 9h
Disclosure: I am part of Trade Nation's Influencer program and receive a monthly fee for using their TradingView charts in my analysis.
✅LIKE AND COMMENT MY IDEAS✅
Nasdaq 100 (US100) – Short Opportunity Still AliveThe Nasdaq is still showing weakness at it's current level. There’s been more than enough time and news to push this market higher – but nothing happened. That, in itself, is a strong signal.
What we’re seeing now:
Weak jobs data: ADP and JOLTS both came in soft. Job openings hit the lowest level in nearly a year. That boosted rate-cut hopes – but the Nasdaq didn’t move.
Tech underperformance: Broader markets found some strength, but tech keeps lagging behind. Nasdaq isn’t leading like it used to – that’s bearish.
China IPO risks: New Nasdaq restrictions on Chinese listings are adding pressure to overall tech sentiment.
No follow-through: Even with dovish expectations and weak macro, bulls can’t lift the index. That says a lot.
Trade Setup (based on the chart):
Entry: between 23,480 and 23,520
Stop Loss: above 23,600 or if not high leverage even 23,720
Targets:
T1: 23,250
T2: 23,000
T3: will update depending on momentum
Why this short still makes sense:
The Nasdaq had multiple bullish triggers – weak data, Fed expectations, soft dollar – and didn’t move.
Sentiment is shaky, buyers aren’t stepping in.
Tech remains heavy while other sectors rotate.
Price is stalling right at resistance after a weak bounce.
Summary:
Plenty of chances to break out – but nothing happened. That’s a red flag.
I’m shorting between 23,480 and 23,520, with targets at 23,250 and 23,000.
Setup is invalid if we break cleanly above 23,720.
No financial advice – just how I see the chart right now.
