NASDAQ NAS100 Analysis and My Trade Plan📊 Currently analysing NAS100 (NASDAQ), we can see that price has broken structure to the upside, confirming bullish intent. Right now, NAS100 is retesting the value area and the Point of Control (POC) on the volume profile — a critical zone to watch 👀📈
⚠️ Price action is a bit precarious. After a strong impulsive move, we’ve now seen a deep and aggressive retracement, which opens the door for potential bearish movement this week.
📆 However, my higher-timeframe bias remains bullish, with the weekly chart still supporting upward continuation.
📌 My plan:
If price holds above the current POC, then breaks and retests cleanly, I’ll be looking for long opportunities. If it breaks below the POC, I will step aside and abandon the long bias 🚫
This is not financial advice — just my personal market outlook. 💬📉📈
Us100

NAS100 — 25,458 Liquidity Sweep, Target Revised to 24,989The NAS100 has completed a clear liquidity sweep at 25,458, taking out the previous swing high before rejecting the zone. This move confirms that the breakout above 25,458 was only a liquidity grab, not a structural shift. As long as price remains below this swept level, the bias stays bearish.
The rejection from 25,458 suggests that the market has collected buy-side liquidity and is now positioned to move toward the opposite side of the range. The first reaction zone is 25,054, but this level is likely to act only as an intermediate pause. The true downside magnet is now 24,989, where a deeper liquidity pool resides (lows + imbalance).
Key Level
25,458 — Sweep Liquidity Zone (bearish invalidation if reclaimed)
Targets
25,054 — Interim level
24,989 — Main target

US100 Free Signal! Buy!
Hello,Traders!
US100 shows price reacting inside a horizontal demand zone, with a clean liquidity sweep beneath recent lows. Structure suggests a retest of demand before expansion, aiming toward the next intraday target above.
--------------------
Stop Loss: 25,115
Take Profit: 25,601
Entry: 25,309
Time Frame: 5H
--------------------
Buy!
Comment and subscribe to help us grow!
Check out other forecasts below too!
Disclosure: I am part of Trade Nation's Influencer program and receive a monthly fee for using their TradingView charts in my analysis.

NASDAQ Santa Rally already underway.Nasdaq (NDX) has made a strong V-shaped recovery on its 1D MA100, as projected on our previous analysis and is extending the uptrend above the 4H MA200 (orange trend-line).
The rally may need a relief pull-back towards its 4H MA50 (blue trend-line) but technically, the seasonal end-of-the-year 'Santa Rally' is already underway.
V-shaped recovery and Inverse Head and Shoulders patterns typically target their 2.0 Fibonacci extensions. That is currently at 26600.
---
** Please LIKE 👍, FOLLOW ✅, SHARE 🙌 and COMMENT ✍ if you enjoy this idea! Also share your ideas and charts in the comments section below! This is best way to keep it relevant, support us, keep the content here free and allow the idea to reach as many people as possible. **
---
💸💸💸💸💸💸
👇 👇 👇 👇 👇 👇

NAS100 | Bullish Bounce Off Pullback SupportMomentum: Bullish
Price is currently above the ichimoku cloud.
Buy entry: 25,308.70
- Pullback support
- 23.6% Fib retracement
Stop Loss: 25,092.80
- Multi-swing low support
Take Profit: 25,553.90
- Swing high resistance
- 127.2% Fib extension
High Risk Investment Warning
Stratos Markets Limited (tradu.com/uk ), Stratos Europe Ltd (tradu.com/eu ):
CFDs are complex instruments and come with a high risk of losing money rapidly due to leverage. 70% of retail investor accounts lose money when trading CFDs with this provider. You should consider whether you understand how CFDs work and whether you can afford to take the high risk of losing your money.
Stratos Global LLC (tradu.com/en ): Losses can exceed deposits.
Please be advised that the information presented on TradingView is provided to Tradu (‘Company’, ‘we’) by a third-party provider (‘TFA Global Pte Ltd’). Please be reminded that you are solely responsible for the trading decisions on your account. Any information and/or content is intended entirely for research, educational and informational purposes only and does not constitute investment or consultation advice or investment strategy. The information is not tailored to the investment needs of any specific person and therefore does not involve a consideration of any of the investment objectives, financial situation or needs of any viewer that may receive it. Past performance is not a reliable indicator of future results. Actual results may differ materially from those anticipated in forward-looking or past performance statements. We assume no liability as to the accuracy or completeness of any of the information and/or content provided herein and the Company cannot be held responsible for any omission, mistake nor for any loss or damage including without limitation to any loss of profit which may arise from reliance on any information supplied by TFA Global Pte Ltd.

Tech bubble burst?The Head and Shoulders (H&S) pattern is a classic reversal formation, typically found after a mature uptrend. It represents a gradual loss of buying pressure and a transition toward a potential downward move.
The H&S pattern often signals the exhaustion of bullish momentum, a shift in control toward sellers, and the possible beginning of a deeper reversal (sell-off).

US100: Short Signal Explained
US100
- Classic bearish pattern
- Our team expects retracement
SUGGESTED TRADE:
Swing Trade
Sell US100
Entry - 25404
Stop - 25436
Take - 25348
Our Risk - 1%
Start protection of your profits from lower levels
Disclosure: I am part of Trade Nation's Influencer program and receive a monthly fee for using their TradingView charts in my analysis.
❤️ Please, support our work with like & comment! ❤️

US100 Technical Analysis! SELL!
My dear followers,
I analysed this chart on US100 and concluded the following:
The market is trading on 25404 pivot level.
Bias - Bearish
Technical Indicators: Both Super Trend & Pivot HL indicate a highly probable Bearish continuation.
Target - 25303
Safe Stop Loss - 25465
About Used Indicators:
A super-trend indicator is plotted on either above or below the closing price to signal a buy or sell. The indicator changes color, based on whether or not you should be buying. If the super-trend indicator moves below the closing price, the indicator turns green, and it signals an entry point or points to buy.
Disclosure: I am part of Trade Nation's Influencer program and receive a monthly fee for using their TradingView charts in my analysis.
———————————
WISH YOU ALL LUCK

US100 Bullish Bias! Buy!
Hello,Traders!
US100 is expanding from the demand zone after a clean mitigation and a shift in structure, with liquidity resting above the recent swing highs. Market is poised to draw toward the next premium target as inefficiencies get filled. Time Frame 5H.
Buy!
Comment and subscribe to help us grow!
Check out other forecasts below too!
Disclosure: I am part of Trade Nation's Influencer program and receive a monthly fee for using their TradingView charts in my analysis.

DOW JONES (US30): Pullback From Trend Line
US30 is testing a recently broken solid rising trend line
on a daily time frame.
I believe that odds are high that the market will retrace from that.
We can expect a pullback to 47300
❤️Please, support my work with like, thank you!❤️
I am part of Trade Nation's Influencer program and receive a monthly fee for using their TradingView charts in my analysis.

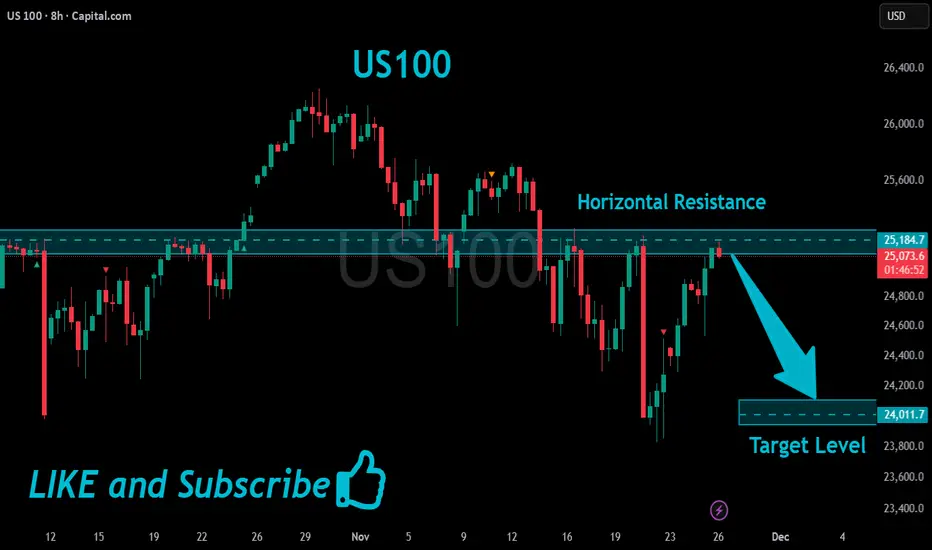
US100 Will Go Down!
HI,Traders !
#US100 already made a retest
Of the horizontal resistance
Of 25184.7 from where we
Are seeing a bearish reaction
And we will be expecting a
Further bearish move down !
Comment and subscribe to help us grow !
Weekly QQQ (NQ-US100) Outlook - Prediction (23 NOV)Weekly QQQ (NQ-US100) Outlook - Prediction
📊 Market Sentiment
Market sentiment is driven by fear at the moment. In my opinion, we are trading inside a bearish zone. Unless we get meaningful data or positive news, I expect the market to continue declining. Core PPI will be released on Tuesday at 08:30, which could create a minor bullish reaction; however, I personally do not think this will shift the overall sentiment. PPI is not a strong catalyst for a major sentiment change, so bearish conditions are likely to remain in play.
📈 Technical Analysis
Price ran the 613 level strongly and reversed aggressively on Thursday after NVDA earnings. This move trapped the bulls and filled institutional put positions. As I mentioned on Thursday evening, a weak bounce was possible and that is exactly what occurred.
📌 Outlook – Prediction
Scenario 1 (Bearish Scenario):
I believe this scenario is more likely to play out. I expect price to retrace toward 559. If we see strong bullish momentum on Monday, I will likely become more cautious with my puts.
Scenario 2 (Bullish Scenario):
If price shows strong momentum on Monday and reprices toward 614, then I will consider buying calls around 606, targeting all-time highs afterward.
Follow me for daily SPY–QQQ updates. I will update the idea based on evolving price action.
💬 For detailed insights and broader market context, please check my Substack link in profile.
⚠️ For educational purposes only. This is not financial advice.

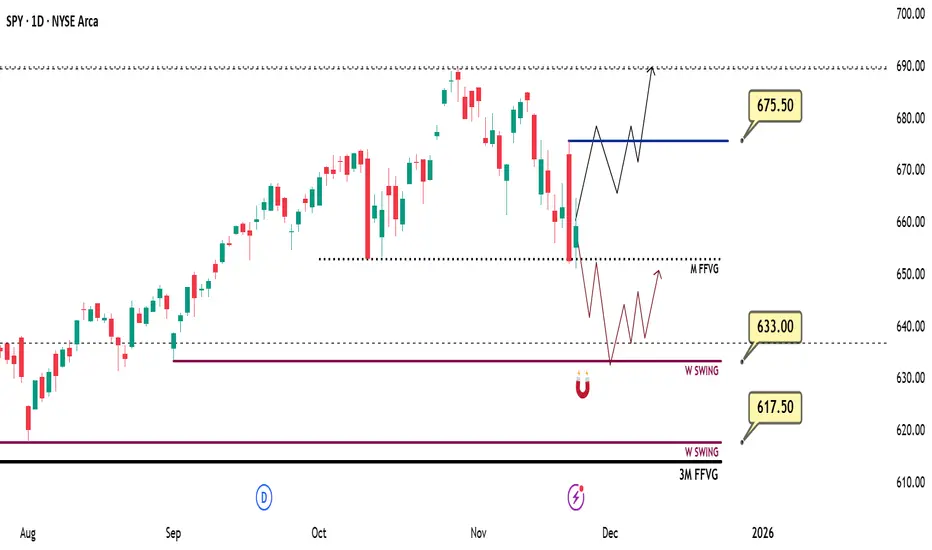
Weekly SPY (ES-US500-SPX) Outlook - Prediction (23 NOV)Weekly SPY (ES-US500-SPX) Outlook - Prediction
📊 Market Sentiment
Market sentiment is driven by fear at the moment. In my opinion, we are trading inside a bearish zone. Unless we get meaningful data or positive news, I expect the market to continue declining. Core PPI will be released on Tuesday at 08:30, which could create a small bullish reaction; however, I personally do not think this will shift overall sentiment. PPI is not a strong catalyst for a major sentiment change, so bearish conditions are likely to remain in play.
📈 Technical Analysis
Price ran 675.5, trapped the bulls, and then reversed sharply to the downside exactly as I anticipated in my previous weekly outlook. Price tapped 653 and bounced from that level, which aligned with Friday’s projection.
📌 Outlook – Prediction
Scenario 1 (Bearish Scenario):
I think this scenario is more likely early in the week. Price may retrace toward 633, which is a significant institutional liquidity pool for me. From there, price could gather energy for a higher expansion or bounce.
Scenario 2 (Bullish Scenario):
If price aggressively reprices back to 675, I will consider the bias short-term bullish. In that case, I will be buying after a retracement to 667.
Follow me for daily SPY–QQQ updates. I will update the idea based on evolving price action.
💬 For detailed insights and broader market context, please check my Substack link in profile.
⚠️ For educational purposes only. This is not financial advice.
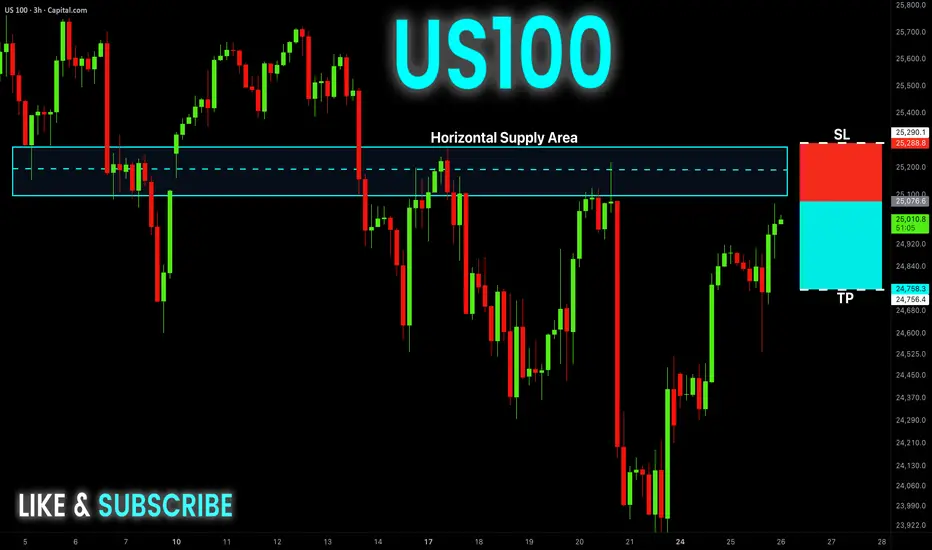
US100 Free Signal! Sell!
Hello,Traders!
US100 has swept internal liquidity and is now approaching the horizontal supply but hasn’t retested it yet. If the retest confirms distribution, SMC flow favors a drop toward the next sell-side liquidity zone.
--------------------
Stop Loss: 25,288
Take Profit: 24,756
Entry: 25,076
Time Frame: 3H
--------------------
Sell!
Comment and subscribe to help us grow!
Check out other forecasts below too!
Disclosure: I am part of Trade Nation's Influencer program and receive a monthly fee for using their TradingView charts in my analysis.
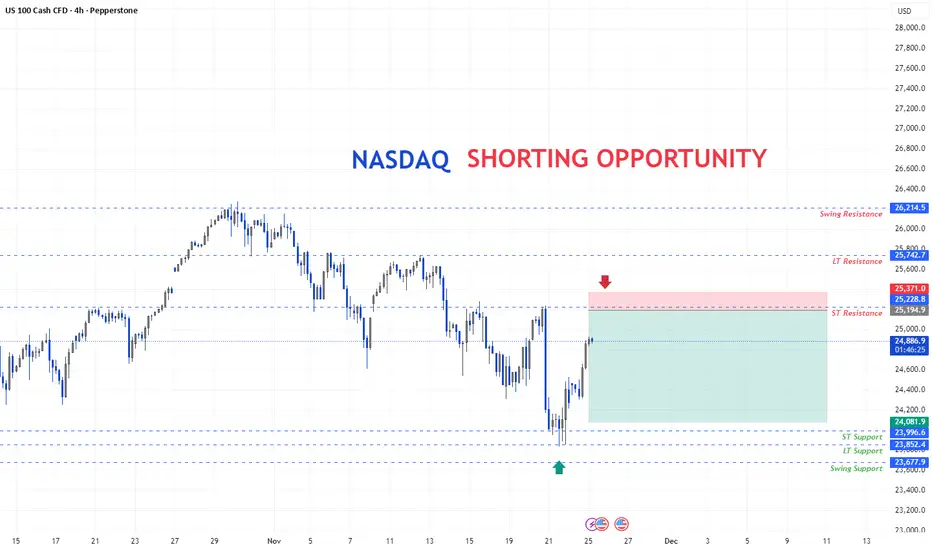
Nasdaq wait for the level for the short entry after market structure broken at the nasdaq, it give a sharp pullback, wait for the entry on the short side at the ST resistance.
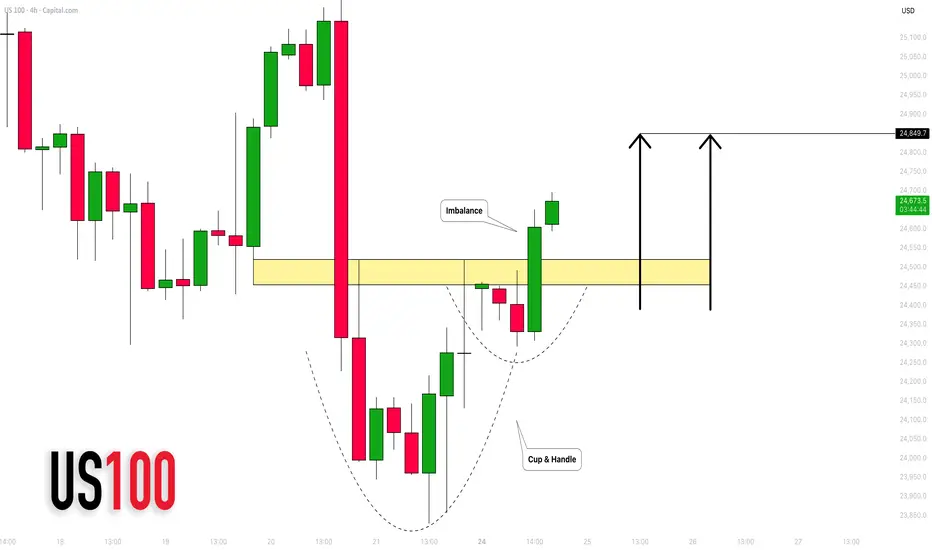
NASDAQ INDEX (US100): Strong Bullish Pattern
There is a high chance that US100 will rise
after a formation of a cup & handle pattern on a 4h time frame
with a breakout of its neckline with a bullish imbalance.
Expect a rise at least to 24850
❤️Please, support my work with like, thank you!❤️
I am part of Trade Nation's Influencer program and receive a monthly fee for using their TradingView charts in my analysis.
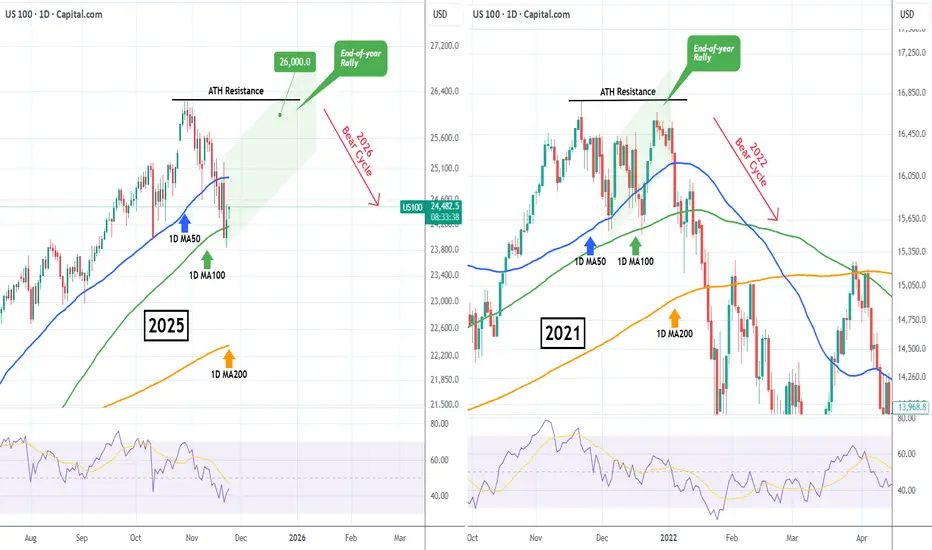
NASDAQ Santa Rally back to 26000 started?Nasdaq (NDX) rebounded on Friday after marginally breaching below its 1D MA100 (green trend-line) for the first time since May 09! The continuation today is a sign of a potentially strong rebound, the traditional end-of-year rally that is know as 'Santa's rally'.
Based on the 2021 Bull Cycle, which after touching its own 1D MA100 it started a final rally that almost tested its ATH Resistance, we can expect Nasdaq to now rise towards the end of the year to potentially 26000.
Could this be the last rally before a new Bear Cycle in 2026?
---
** Please LIKE 👍, FOLLOW ✅, SHARE 🙌 and COMMENT ✍ if you enjoy this idea! Also share your ideas and charts in the comments section below! This is best way to keep it relevant, support us, keep the content here free and allow the idea to reach as many people as possible. **
---
💸💸💸💸💸💸
👇 👇 👇 👇 👇 👇
Nasdaq NAS100 Analysis: The Conditions I Need Before Going ShortI'm keeping a close eye on NAS100 (Nasdaq) right now. 📉✨ On the 4H timeframe, price remains in a clean, sustained bearish trend, and I'm anticipating a potential continuation lower.
If price rejects the current level and fails to retrace through the 1H imbalance, and we see a rotation followed by a bearish break of structure, I'll be preparing for a short opportunity. 📊🔻
Not financial advice.

US100 Reversal Map – Hull MA + Heikin Ashi Confirmation🧠 US100 / NASDAQ100 Profit Pathway Setup — The Thief’s Bullish Escape Plan! 💰🚀
📊 Market Bias: Bullish (Day Trade Setup)
The Thief Trader has spotted a golden pathway in the NASDAQ100 (US100)!
Here’s the breakdown of the plan — straight from the thief’s vault 🕵️♂️📈
🎯 Plan Overview
Bias: Bullish continuation confirmed
Technical Confirmation:
✅ Double Pullback on Hull Moving Average
✅ Retest Zone successfully defended
✅ Heikin Ashi Bullish Doji signaled a trend reversal confirmation
💡 Momentum is shifting upward — the trend has officially changed!
💎 Entry Strategy (Layered Thief Style)
The Thief Strategy applies a layered entry method — multiple buy limits to average into strength.
📥 Buy Limit Layers:
25,300
25,400
25,500
25,600
(Traders can adjust or add more layers based on risk appetite and confirmation zones.)
🛡️ Stop-Loss Setup
This is the Thief SL @ 25,100
⚠️ Note to Thief OG’s:
I’m not recommending my SL as your SL — always customize risk and secure your own bag. Manage your position with discipline and independence! 💼
🎯 Take-Profit Zone
Target: 26,200
🚨 The Police Barricade Zone acts as a strong resistance — overbought levels spotted and potential bull trap alert!
Kindly exit with profit before the officers arrive. 😎
⚠️ Note: Profit-taking is at your discretion. Book and Run!
📈 Related Pairs to Watch (Correlation Insight)
NASDAQ:NDX / CAPITALCOM:US100 / NASDAQ:QQQ : All mirror NASDAQ movement.
SP:SPX / AMEX:SPY : Often correlate with NASDAQ’s momentum (watch divergence for clues).
TVC:VIX : If volatility spikes, expect pullbacks on tech-heavy indices.
TVC:DXY : A weak dollar often fuels US100 bullish legs — keep an eye on it.
NASDAQ:AAPL / NASDAQ:MSFT / NASDAQ:NVDA : Leading drivers of NASDAQ — if they pump, the index follows. 💪
🧩 Key Insights
Hull MA alignment confirms momentum shift.
Retest + bullish Heikin Ashi Doji = market reversal confirmation.
Layered entries give flexibility in volatile intraday conditions.
Dynamic risk management is key — never marry a position.
✨ “If you find value in my analysis, a 👍 and 🚀 boost is much appreciated — it helps me share more setups with the community!”
#US100 #NASDAQ100 #ThiefTrader #DayTrading #IndexTrading #HullMA #HeikinAshi #LayeredEntries #TechnicalAnalysis #TradingSetup #PriceAction #MarketReversal #TradingCommunity #BullishPlan #SmartMoneyFlow #TradeIdeas #ThiefStrategy

NASDAQ DEC 2025, Next week will unveil it all.I often like to use this approach, where I start from the most generic timeframe that still carries importance, moving into smaller timeframes narrowing the timeframe at each step, finally concluding with a short-term trade opportunity.
This post focuses solely on technical analysis, price action and trend behavior on the NDX. No fundamental expectations or macroeconomic interpretations are included.
I will be updating this post as trade opportunities develop.
A summary of this idea is provided at the end.
--- Long-Term Behavior ---
Long term outlook indicates that NDX had a strong bullish momentum until now, it pushed above the almost 5 year bullish trend marked with orange lines.
However, before it pushed above, NDX experienced a sharp decline. (marked with yellow circle)
But price carried back up with the yellow trend and created a much stronger bullish movement which managed to push further.
Now that stronger bullish movement is also over, NDX should be falling back for a retest. The last monthly candle was possibly the beginning of that retest movement.
After the retest two scenarios are possible, either it continues the bullish movement with a much higher pace or price fails to hold the retest and falls back toward the lower boundary of the previous long-term trend.
-- Short-Term Behavior --
In this section, I will be investigating the short-term movements to better predict a possible trade opportunity.
If we zoom into the yellow trend, the price was following a path estimated with the purple lines. Which also justifies the last months harsh fallback.
I expect NDX to start moving towards the lower boundary of the trend marked with yellow. (also, weekly RSI shows clear decrease in bullish momentum, indicating the yellow trend is coming to an end)
With all these in mind, to further predict the next 2-3 weeks movement, zooming into the last couple of months. NDX's last bearish movement, which I have shown with blue trend, can go two ways which the next weeks price movement will unveil. If the next week starts up bullish and the price fails to go down further NDX may rapidly rise. On the other hand, If it forms a steeper downtrend which I have shown in the second snapshot, it may possibly keep moving down for the long-term retest.
note that the trend drawings are estimations and may not be totally accurate.
-- Summary and Final Verdict --
Next week, we should see a clear directional bias for NDX
Bearish scenario: If price continues downward and establishes a steeper trend (as shown in the image), NDX is likely heading toward a full retest of the long-term breakout area.
Target: ~22,000
Bullish scenario: If the index shows clear signs of reversal and rejects further downside, a swift recovery toward previous highs is possible.
Target: ~26,500
I will be updating the post as we get a clearer image...

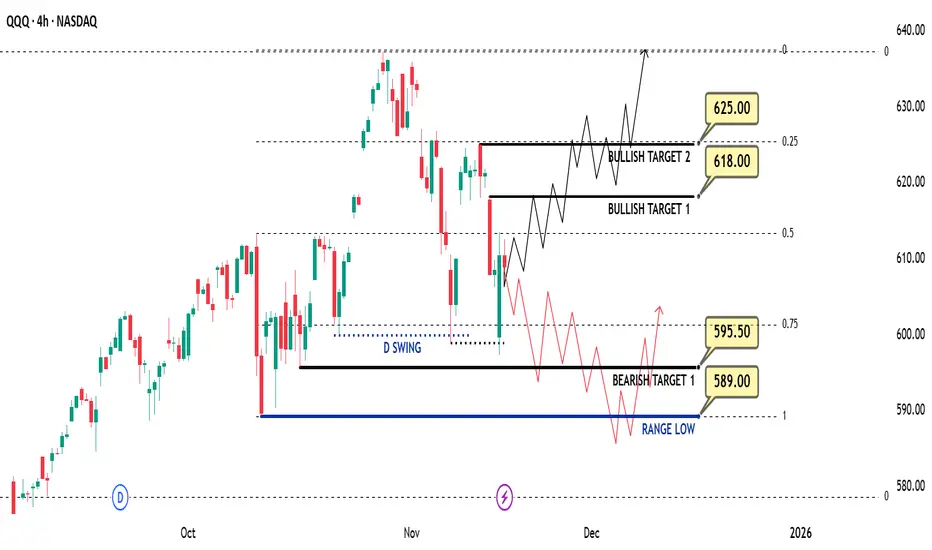
Weekly QQQ (US100-NQ) Outlook - Prediction (16 NOV)Weekly QQQ (US100-NQ) Outlook - Prediction (16 NOV)
📊 Market Sentiment
Market sentiment appears bearish right now, in my opinion. The FED may pause rate cuts in December, which has contributed to recent selling pressure and possible hedging flows. However, with the U.S. government reopening last week, we will start receiving updated economic data again. If employment data weakens and CPI comes in low or stable, it could trigger a renewed bullish momentum.
NVDA will report earnings this Wednesday after market close. I will be watching closely in my view, if NVDA were to miss expectations, QQQ and SPY could see a strong retracement. However, I think this is unlikely. I expect solid earnings growth and believe the AI cycle continues to support upside.
Additionally, U.S. Treasury Secretary Scott Bessent stated that the Trump administration aims to finalize its trade agreement with China by Thanksgiving (November 27). This could add further bullish sentiment to the market.
📈 Technical Analysis
The market showed a strong bounce on Friday after tapping the 599 level. RSI has also reset, meaning price is no longer overbought. We remain inside the weekly range, and price has reached the 0.75 max discount zone for the second time.
📌 Game Plan – Prediction
Bullish Scenario (Black Line):
I think this scenario is more likely. I want to see price close a 4H candle above 613. If that happens, I will be targeting 618 next. Price may run 618, pull back slightly, then eventually push toward 625 and potentially all-time highs around 637.
Bearish Scenario (Red Line):
If we see strong selling on Monday, I will assume price may follow the bearish path. In that case, I expect a move toward 595.5 and then the range low at 589. From there, we could see a bounce and a reclaim of 595.5.
💬For detailed insights and broader market context, please check my Substack link in profile.
⚠️ For educational purposes only. This is not financial advice.
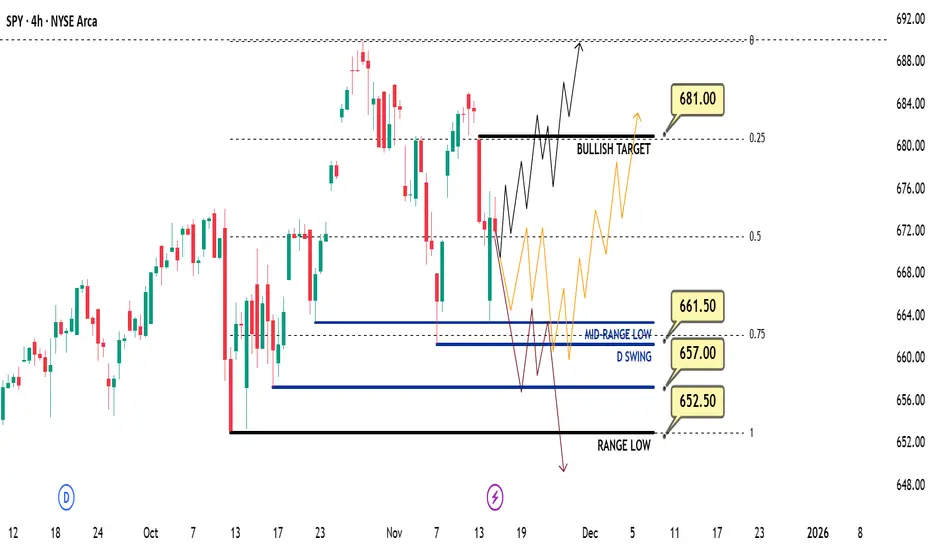
Weekly SPY (US500-ES-SPX) Outlook - Prediction (16 NOV)Weekly SPY (US500-ES-SPX) Outlook - Prediction (16 NOV)
📊 Market Sentiment
Market sentiment appears bearish right now, in my opinion. The FED may pause rate cuts in December, which has contributed to recent selling pressure and potential hedging flows. However, with the U.S. government reopening last week, we will begin receiving updated economic data again. If employment data weakens and CPI comes in low or stable, it could support renewed bullish momentum.
NVDA will report earnings this Wednesday after market close. I will be watching closely in my view, if NVDA were to miss expectations, both QQQ and SPY could see a strong retracement. However, I think this is unlikely. I expect solid earnings growth and believe the ongoing AI cycle will continue to support upside.
Additionally, U.S. Treasury Secretary Scott Bessent stated that the Trump administration aims to finalize its trade agreement with China by Thanksgiving (November 27). This could help bring additional bullish sentiment into the market.
📈 Technical Analysis
Price retraced into the 0.75 max discount zone, ran the mid-term range low, and closed back above it creating another higher expansion bounce. On Friday, we saw a second retest of the range low followed by another strong reaction. In my opinion, price remains strong here.
📌 Game Plan – Prediction
I currently see three scenarios:
Bullish Scenario (Black Line):
I believe this is the most likely scenario. I want to see price close above 675.5 and continue expanding higher. The first bullish target is 681. After clearing 681, a small retracement may occur, followed by a potential expansion toward all-time highs around 690.
Orange Scenario:
If the market opens less bullish on Sunday night, price may run 661 to gather more liquidity and energy for a move higher. If 661 is swept and a 4H candle closes back above it, I will assume this scenario is playing out.
Bearish Scenario (Red Line):
If price breaks aggressively below 661 and closes underneath it, that would indicate the market may want to move lower. In that case, I will exit my calls and buy puts, targeting a move toward at least 562.5.
💬 For detailed insights and broader market context, please check my Substack link in profile.
⚠️ For educational purposes only. This is not financial advice.