US100 Will Keep Growing!
HI,Traders !
#US100 made a bullish
Breakout of the key horizontal
Level of 177.327 and the
Breakout is confirmed so
We are bullish biased
And we will be expecting
A further bullish continuation !
Comment and subscribe to help us grow !
Us100

NAS100US100 created a NH as price is changing direction creating a bearish peanant, price to retrace back to resistance before it dumps..Trade safe and be Blessed..

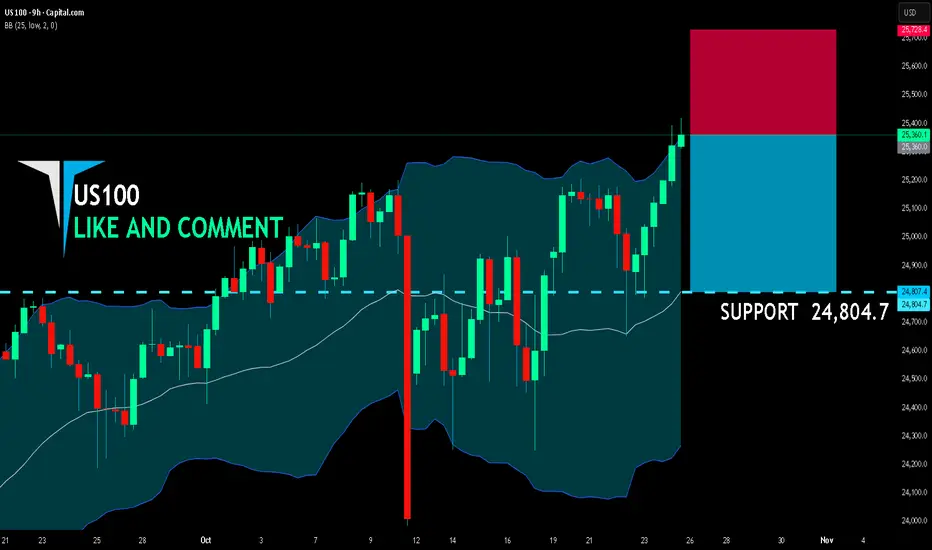
US100 SHORT FROM RESISTANCE
US100 SIGNAL
Trade Direction: short
Entry Level: 25,360.0
Target Level: 24,804.7
Stop Loss: 25,728.4
RISK PROFILE
Risk level: medium
Suggested risk: 1%
Timeframe: 9h
Disclosure: I am part of Trade Nation's Influencer program and receive a monthly fee for using their TradingView charts in my analysis.
✅LIKE AND COMMENT MY IDEAS✅
BTC - Liquidity Dynamics leading to new HighsMarket Context
Bitcoin has shown a constructive reaction from the recent lows, printing a clean double bottom structure that suggests short-term demand entering the market. After a previous buy-side liquidity sweep and rejection, price has rebalanced and is now challenging a fair value gap (FVG) that previously served as resistance. This marks a key decision zone where the next directional move will unfold.
Fair Value Gaps & Structure
The FVG overhead has already acted as resistance, capping the first impulsive move from the lows. Should price retrace slightly to take out the remaining sell-side liquidity below the double bottom before re-engaging higher, it would confirm the area as a springboard for a bullish continuation. A clean reclaim and hold above the FVG zone would signal a shift in order flow favoring buyers.
Liquidity Dynamics
The current setup offers both sides of the market clear liquidity targets: sell-side liquidity resting under the double bottom and buy-side liquidity resting above the prior high. Smart money could engineer a sweep of the lower side first to accumulate before expansion, or alternatively, break directly through resistance to trigger a larger bullish leg.
Final Thoughts
The structure reflects a balanced but bullish-leaning scenario — a classic accumulation and breakout setup. A deeper retest to clear out lower liquidity would strengthen the foundation for continuation, while sustained strength above the FVG opens the door for a reaction toward new highs.
If this analysis aligned with your view, drop a like — do you think we clear the lows first, or head straight for a bullish breakout?

NAS100 Why I'm Watching for a Countertrend Short on US100The NASDAQ (US100) has pushed aggressively into fresh all-time highs, tapping into a key liquidity zone where buy-side liquidity sits above previous swing highs. 📈💧
Price has extended without any meaningful pullback, suggesting we may soon see exhaustion and a corrective move. As we approach the end of the week, institutional traders often rebalance or close positions, which can trigger short-term retracements. 🏦🔄
If price breaks structure to the downside, I’ll be watching for a counter—
residing in a premium zone to—butter to the downside swings—for a potential countertrend—but—
🛑 Not financial advice. For educational purposes only.

NAS100 1H: Bulls vs Bears at the Line📊 NAS100 – 1 Hour Analysis
Hello friends,
Here’s my NAS100 analysis for you.
Looking at the 1-hour chart, I want to highlight a critical level.
👉 If NAS100 breaks above 25,038 and closes a candle there, the next move could point higher.
👉 If NAS100 fails to break 25,038, then a pullback toward 24,267 may come into play.
🙏 Every like is my biggest motivation to keep sharing these analyses.
Thanks to everyone supporting me!

US100 STRONG BREKAOUT|LONG|
✅US100 Price has successfully broken through the key resistance and all-time-high level, confirming bullish intent. As long as the breakout holds above structure, we anticipate continuation toward the next premium zone and liquidity resting at higher highs. Time Frame 3H.
LONG🚀
✅Like and subscribe to never miss a new idea!✅

24-10-2025 Intraday Plan (CPI + NY Open Scenario) – US30 5M/1M💬 Intraday Plan (CPI + NY Open Scenario) – US30 5M/1M
📍 Bias remains bullish above 46,700 (structure still forming higher lows).
📍 Expecting CPI at 13:30 to create a liquidity grab — ideally sweeping lows into the ascending trendline/support.
📍 After CPI spike settles, looking for a NY Open breakout above 46,850 (key resistance).
📍 If we get a break + retest of 46,850, I’ll look for long entries targeting:
✅ TP1: 47,000
✅ TP2: 47,100
✅ TP3: 47,200 (liquidity extension)
❌ If CPI breaks below 46,700 and fails to recover, I’ll reassess for a bearish scenario.
🕒 No trades during initial CPI spike – waiting for structure confirmation post-news & into NY session.
📌 Plan: CPI grab → NY breakout → retest entry → continuation.

USTECUSTEC price is in the resistance zone 25237-25264. If the price cannot break through the 25264 level, it is expected that the price will likely go down in the short term. Consider selling in the red zone.
🔥Trading futures, forex, CFDs and stocks carries a risk of loss.
Please consider carefully whether such trading is suitable for you.
>>GooD Luck 😊
❤️ Like and subscribe to never miss a new idea!

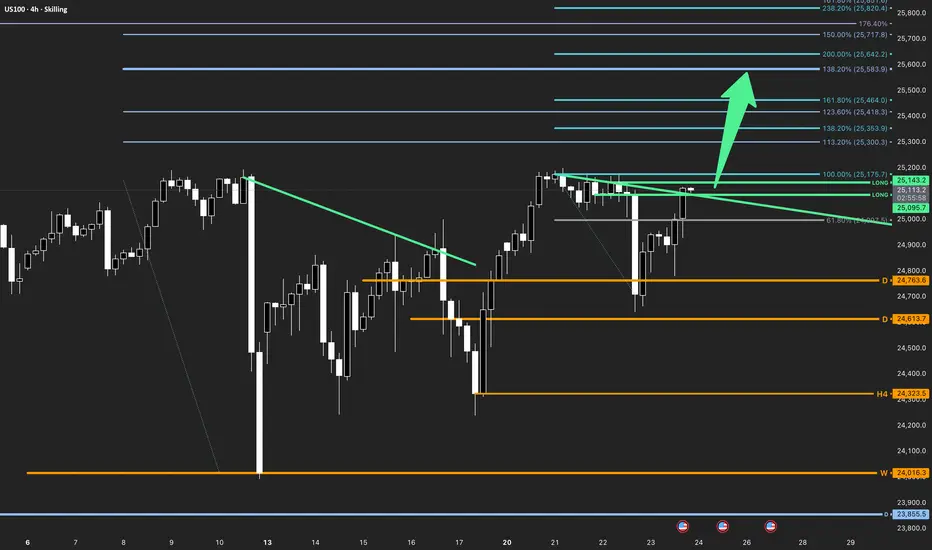
US100 | Expansion Phase Alignment
The Market Flow | Oct 23, 2025
Technical Overview
• Price confirms a breakout above the active countertrend trigger (green).
• All observed timeframes are in bullish alignment — wave structure expanding higher.
• Immediate resistance lies near 25,175 , where the 100% Fibonacci projection aligns.
• Clearing this zone opens continuation toward higher Fibonacci extensions — 25,353 , 25,418 , 25,464 , and 25,583+ .
• Structural pivots remain supportive above 24,763 and 24,613.7 (daily pivot zone).
Trade Structure & Levels
• Bias: Long above 24,613.7
• Trigger = 25,095–25,143 breakout zone
• Primary Invalidation = 24,613.7 (daily pivot)
• Secondary Invalidation = 24,323.5 (H4 pivot)
• Targets → Fibonacci extensions: 25,353 → 25,418 → 25,464 → 25,583
• Phase: Expansion
Risk & Event Context
• Focus remains on U.S. macro data and yield repricing.
• Short-term volatility expected around key data prints; sustained closes above the trigger confirm momentum continuation.
Conclusion
The US100 shows multi-timeframe bullish alignment, initiating an expansion phase above the countertrend trigger. As long as price holds above the daily pivot at 24,613.7, the structure supports progressive upside toward the Fibonacci expansion cluster.
Disclaimer
This analysis is for informational purposes only and does not constitute investment advice, an offer, or a recommendation. Market conditions and price behavior may change without notice. Past performance is not indicative of future results. Always conduct your own research or consult a licensed financial advisor before making investment decisions.
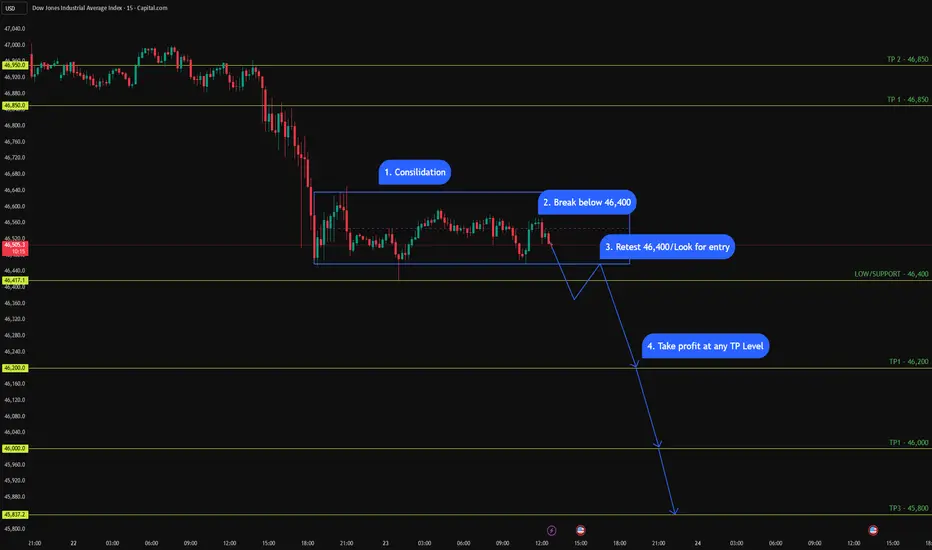
US30 (15M - 1M Daily Setup) - Bearish Bias US30 (15M - 1M Daily Setup) - Bearish Bias 📉
Price is consolidating under key resistance, forming lower highs. I’m watching 46,400 as the make-or-break level.
✅ Plan:
1️⃣ Consolidation phase complete
2️⃣ Looking for a clean break below 46,400
3️⃣ Retest → possible short entry
4️⃣ Target zones:
• TP1 → 46,200
• TP2 → 46,000
• TP3 → 45,800
📍 Bias stays bearish as long as price remains below 46,850 – 47,000.
Let’s see if the breakdown plays out. 👀
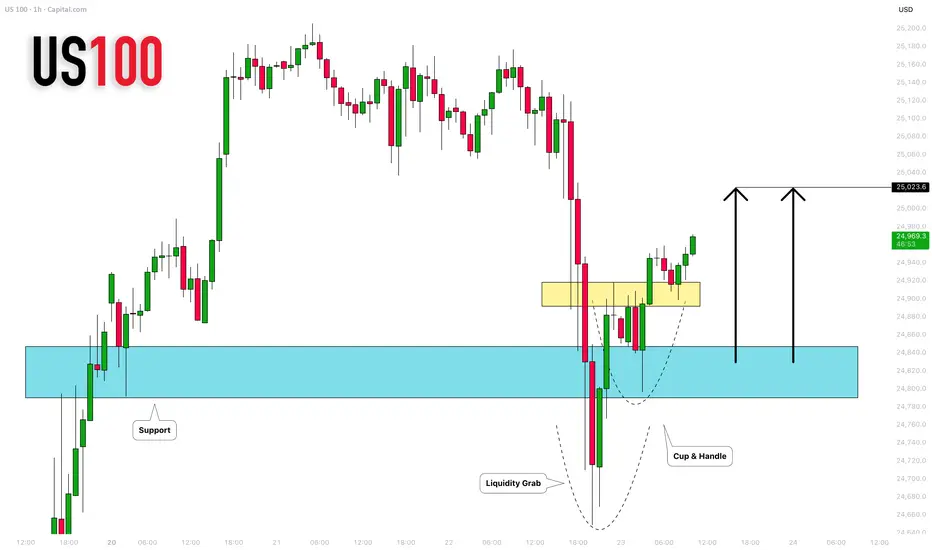
NASDAQ INDEX (US100): Bullish Move After the Trap
I see a confirmed liquidity grab below a key horizontal support
on an hourly time frame.
A formation of a cup & handle pattern and a breakout of its neckline
afterward suggest a strong buygin interest.
The market will rise more and reach at least 25023 level.
❤️Please, support my work with like, thank you!❤️
I am part of Trade Nation's Influencer program and receive a monthly fee for using their TradingView charts in my analysis.
US100 Will Go Down!
HI,Traders !
#US100 has made a retest
Of the horizontal resistance
Of 25169.1 and we are already
Seeing a bearish reaction so
We are bearish biased and
Therefore a local bearish
Pullback is to be expected !
Comment and subscribe to help us grow !

Will the second scenario come true? |October 17 2025Based on the evidence, price action, and fundamental news, it seems the second scenario is about to play out.
The Nasdaq index turned positive after recovering its losses when Trump responded “No” to a question about whether he would maintain the heavy tariffs on China.
From today, my outlook is bullish until the previous high gets hunted — after that, I’ll reassess whether we’re likely to see further downside or if the bullish outlook should remain.
If market conditions shift and a continuation of the downtrend becomes more likely, we can take a solid short position next week to catch the move.
But for now, my bias is bullish, and the second scenario will likely play out.
If price reaches the second high I marked in blue, we’ll probably see a reaction from that zone.
If I open a trade, I’ll share it with you.

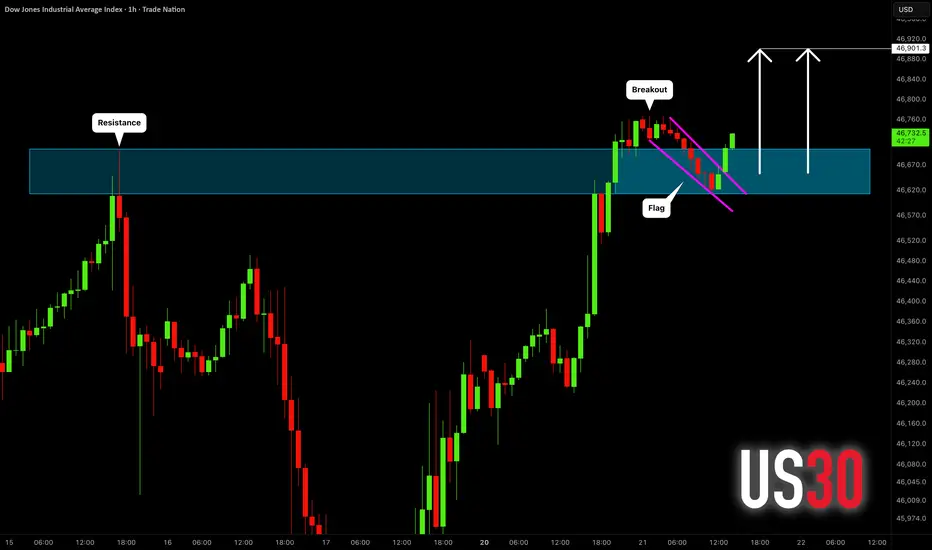
DOW JONES INDEX (US30): Bullish Continuation Confirmed
US30 index violated a major horizontal resistance yesterday.
The price started a correctional movement then, steadily
falling within a bullish flag pattern.
A breakout of its resistance line is a strong bullish signal.
Odds will be high, the index will hit 46900 level soon.
❤️Please, support my work with like, thank you!❤️
I am part of Trade Nation's Influencer program and receive a monthly fee for using their TradingView charts in my analysis.
US100: Needs a healthy pullback before breaking highs🧭 SKILLING:US100 (30-Min Chart) – The Market Needs a Pause Before the Breakout
After a strong recovery from the 24,200 area , the US100 has shown an impressive upward acceleration, forming a steep speed line that pushed price back toward the previous highs around 25,150 – 25,250 — a major resistance zone where sellers previously dominated.
However, as price reaches this area, the bullish momentum is starting to fade. Smaller candles and indecisive movements reveal hesitation — buyers are still in control, but the strength that carried the market this far is beginning to weaken.
If we look closely at the market structure, it’s clear that the index has been trying to reclaim the entire prior range, but that effort hasn’t come easy. After such a fast rally, the market looks overextended, and bulls may need a healthy pullback to gather enough energy for a real breakout.
________________________________________
🔍 Technical Outlook
• The 25,150 – 25,250 zone remains the key resistance area. If price keeps getting rejected here, short-term sellers might step in.
• A corrective move toward 24,850 – 24,950 (the pink zone) would not be surprising.
• That area should be watched closely — if buyers defend it strongly, it could become the launchpad for another push toward new highs.
________________________________________
🎯 Personal View
The overall structure still favors the bullish side, but momentum needs a reset.
A short-term pullback shouldn’t be seen as weakness — it’s an opportunity for the market to rebalance before the next leg up.
If the 24,850 zone holds, the probability of a true breakout above 25,250 increases significantly, potentially opening room toward 25,400 – 25,500 in the next sessions.
________________________________________
💬 In summary:
The US100 has worked hard to reclaim lost ground, but breaking above the previous top will require fresh momentum. A short-term correction could be exactly what the market needs to build a stronger foundation for a sustainable rally.
Please like and comment below to support our traders. Your reactions will motivate us to do more analysis in the future 🙏✨
Harry Andrew @ ZuperView

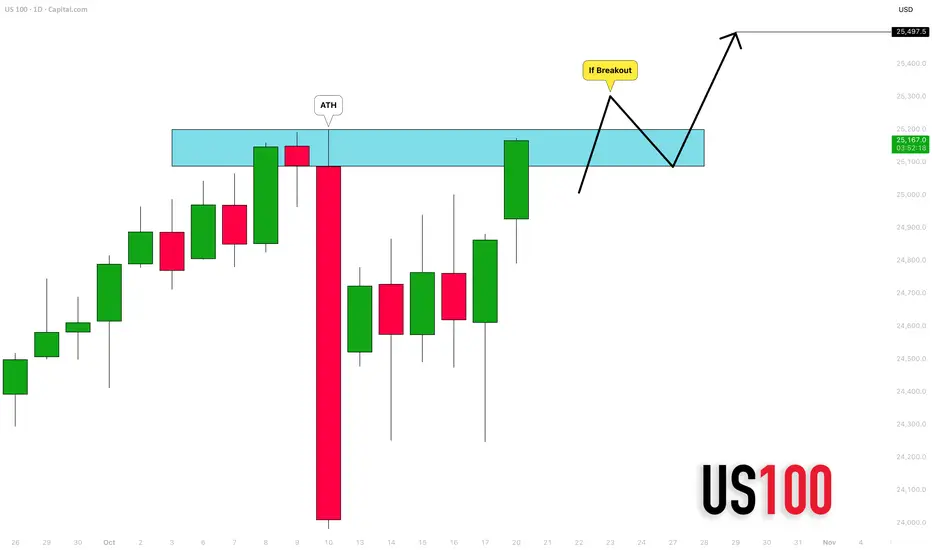
NASDAQ INDEX (US100): Get Ready for Breakout
Nasdaq index is currently testing a resistance based on a current
all-time high.
With a high probability, the market is going to break that.
A daily candle close above will confirm a violation.
A further growth will be expected at least to 25500 level then.
❤️Please, support my work with like, thank you!❤️
I am part of Trade Nation's Influencer program and receive a monthly fee for using their TradingView charts in my analysis.
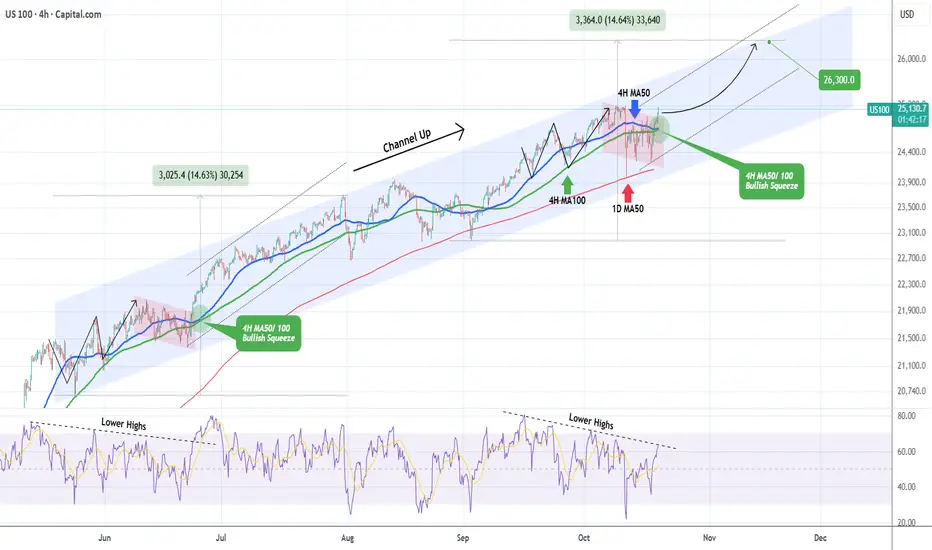
NASDAQ This bullish squeeze can push it to 26300.Nasdaq (NDX) has been trading within a Channel Up since the May 23 Low on its 4H MA100 (green trend-line). It appears that the index is getting out of the red Bearish Leg, which on the whole pattern serves as a Bull Flag for the next rally (Bullish Leg). Once the 4H RSI breaks above its Lower Highs trend-line, it will confirm the new Bullish Leg.
The last such RSI Lower Highs break-out was on June 23 when a similar 4H MA50/ 100 Bullish Squeeze took place. That was almost in the middle of a +14.63% rally in total before the index pulled back to its 1D MA50 (red trend-line).
As a result, once the 4H RSI break-out is finalized, we expect this run to reach at least 26300 (+14.63%).
-------------------------------------------------------------------------------
** Please LIKE 👍, FOLLOW ✅, SHARE 🙌 and COMMENT ✍ if you enjoy this idea! Also share your ideas and charts in the comments section below! This is best way to keep it relevant, support us, keep the content here free and allow the idea to reach as many people as possible. **
-------------------------------------------------------------------------------
💸💸💸💸💸💸
👇 👇 👇 👇 👇 👇
NASDAQ 100 Resistance Reaction and Countertrend Short SetupThe NASDAQ 100 has rallied strongly and is now trading near the top of its current range 📊. Price is approaching a key resistance level, and I’m expecting a potential reaction from liquidity above the highs, followed by a retracement back to equilibrium — around 50% of the current price swing 📉.|
A countertrend short setup could be considered here, with the option to take partial profits early to reduce risk 💡. Full details of the trade idea and execution are explained clearly in the video.
⚠️ Disclaimer: This is for educational purposes only and not financial advice.

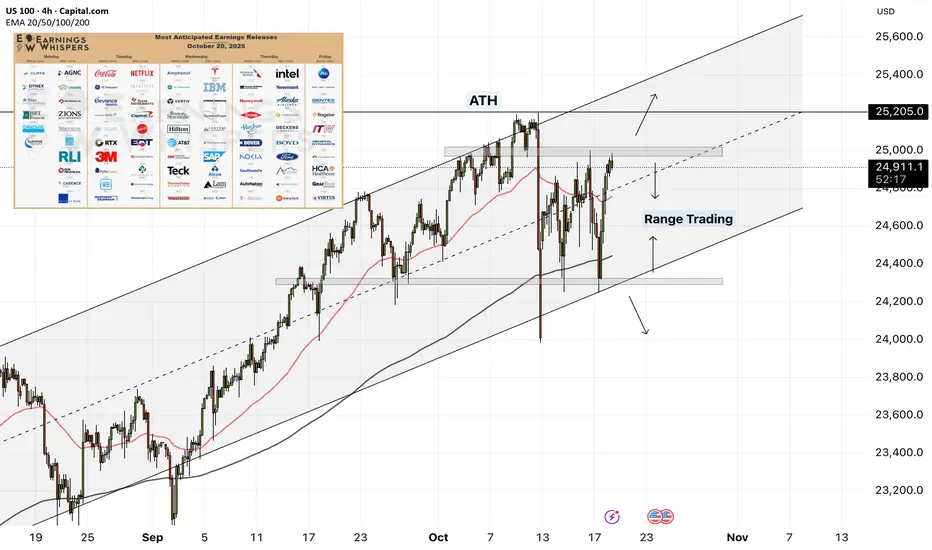
NAS100 - Stock Market, Waiting for a Decisive Week?!The index is above the EMA200 and EMA50 on the four-hour time frame and is in its long-term ascending channel. As long as the Nasdaq is in its range, you can be a seller at the top of the range and a buyer at the bottom. If this range is broken, you can look for new trends in the Nasdaq.
The U.S. Bureau of Labor Statistics (BLS) announced that the Consumer Price Index (CPI) report for September 2025 will be released on Friday, October 24 at 8:30 a.m. New York time (4:00 p.m. Tehran time). This release comes as most other economic data have been delayed due to the ongoing federal government shutdown, which has suspended normal operations.
The CPI report is particularly important for the U.S. Social Security Administration, as it serves as the basis for calculating annual adjustments to retirement benefits and other statutory payments.
In a statement released on Friday, the agency confirmed that it would temporarily recall a limited number of furloughed employees to ensure the timely publication of the CPI report. Originally scheduled for October 15, the release has now been rescheduled for October 24.
This CPI release will be among the few remaining economic datasets published by federal agencies during the shutdown. Since October 1, most data-producing institutions have ceased operations amid political deadlock between Democrats and Republicans that has halted large portions of federal services.
With the federal shutdown continuing, U.S. markets are increasingly relying on private-sector data to gauge the state of the economy. In the upcoming week, indicators such as housing sales and private manufacturing surveys will be released, serving as alternative references for traders and analysts.
Without access to official government data, investors, businesses, and consumers face a heightened level of uncertainty, making it difficult to plan for spending, hiring, and saving decisions.
The CPI report could play a crucial role in shaping the Federal Reserve’s monetary policy decisions, as the FOMC will have access to the data ahead of its October 28–29 policy meeting. Fed officials are currently debating whether to cut interest rates further, and if so, how quickly.
In September, the Federal Reserve lowered its benchmark interest rate to support a weakening labor market by reducing borrowing costs across short-term loans. Another rate cut is widely expected in October, though elevated inflation could slow or prevent further easing.
The Chief Financial Officer of Bank of America (BOFA) stated that the bank expects two additional rate cuts by the Fed before the end of this year.
Meanwhile, Fed Chair Jerome Powell recently warned about downside risks to the labor market, sparking speculation that he might have had early access to the yet-unreleased September employment report. However, a closer examination of his remarks shows no confirmation or denial of such access.
The key takeaway from Powell’s speech was his firm reaffirmation of market expectations for a rate cut later this month, delivered without any sign of hesitation or opposition — a clear and confident signal to investors.
In another commentary, Bank of America highlighted that the current boom in AI data centers is fundamentally different from the dot-com bubble of the early 2000s. The bank attributed today’s expansion to strong semiconductor utilization, healthy cash flows, lower valuations, and a more favorable interest rate environment.
Nonetheless, it acknowledged ongoing concerns about excessive spending and stretched valuations in certain AI sectors.
Finally, the October Bank of America investor survey revealed that recession fears have fallen to their lowest level since February 2022, while optimism about economic growth has seen its strongest jump since 2020:
• 33% expect a “no-landing” scenario (up from 18%)
• 54% foresee a “soft landing” (down from 67%)
• 8% anticipate a “hard landing” (down from 10%).
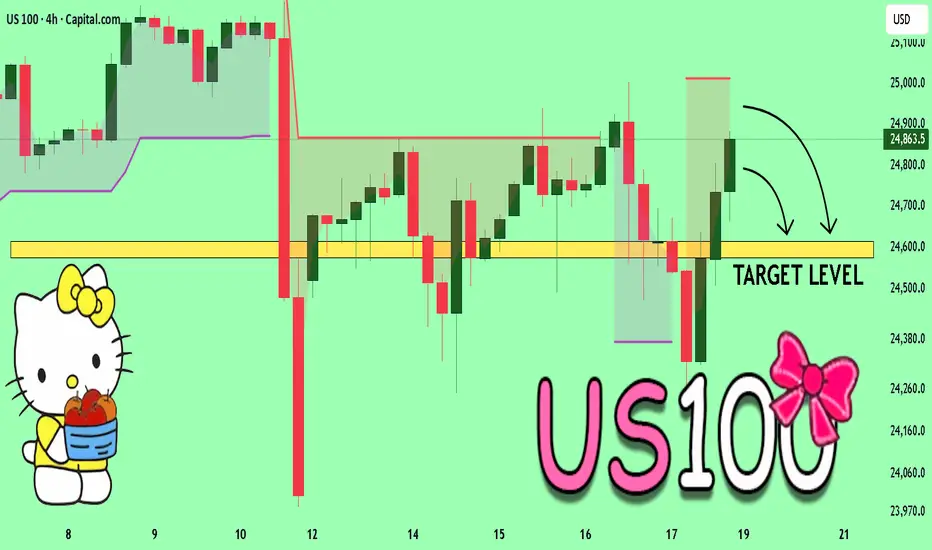
US100 A Fall Expected! SELL!
My dear friends,
Please, find my technical outlook for US100 below:
The instrument tests an important psychological level 24.863
Bias - Bearish
Technical Indicators: Supper Trend gives a precise Bearish signal, while Pivot Point HL predicts price changes and potential reversals in the market.
Target - 24.615
About Used Indicators:
Super-trend indicator is more useful in trending markets where there are clear uptrends and downtrends in price.
Disclosure: I am part of Trade Nation's Influencer program and receive a monthly fee for using their TradingView charts in my analysis.
———————————
WISH YOU ALL LUCK
US100 Bearish Bias!
HI,Traders !
#US100 keeps growing
But a horizontal resistance
Level of 25039.3 is nearby
So after the retest of the
Level we will be expecting
A local bearish correction
On Monday !
Comment and subscribe to help us grow !

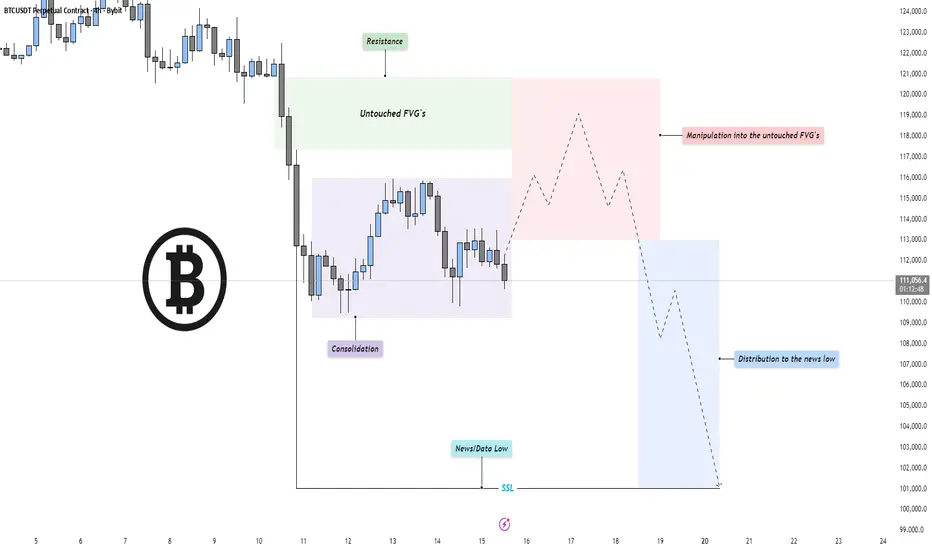
BTC - Perfect Power of 3 setup!Market Context
Bitcoin has entered a phase of compression after an extended bearish leg, with price currently consolidating near recent lows. The previous selloff created a clean structure of inefficiencies and untouched fair value gaps (FVGs) above, now acting as potential magnet zones for short-term retracements. The broader context remains bearish until those imbalances are efficiently mitigated.
Fair Value Gaps & Manipulation Zones
A clear pocket of untouched FVGs sits above the current range, aligning with resistance from prior breakdown points. Price could engineer a manipulation move into this zone, enticing late buyers before resuming the macro bearish direction. Such a move would serve as a liquidity grab and offer premium pricing for distribution before continuation lower.
Liquidity Dynamics
The market structure shows resting sell-side liquidity (SSL) below the recent “news/data low,” marked as a potential target for a deeper sweep. Once manipulation into the upper inefficiencies completes, the market could shift momentum to the downside, distributing into that liquidity and seeking new lows for rebalancing.
Final Thoughts
The current structure points toward a classic bearish continuation setup: consolidation, manipulation into premium inefficiencies, and a drive toward sell-side liquidity. Unless price breaks decisively above the untouched FVG chain, the expectation remains for a redistribution phase leading into the news low or beyond.
If this breakdown helped frame your bias, a like goes a long way — do you think price runs the FVG first, or dives straight into the liquidity below?