NASDAQ (US100) - Short from resistance ✅Hello traders!
⁉️This is my analysis on US100.
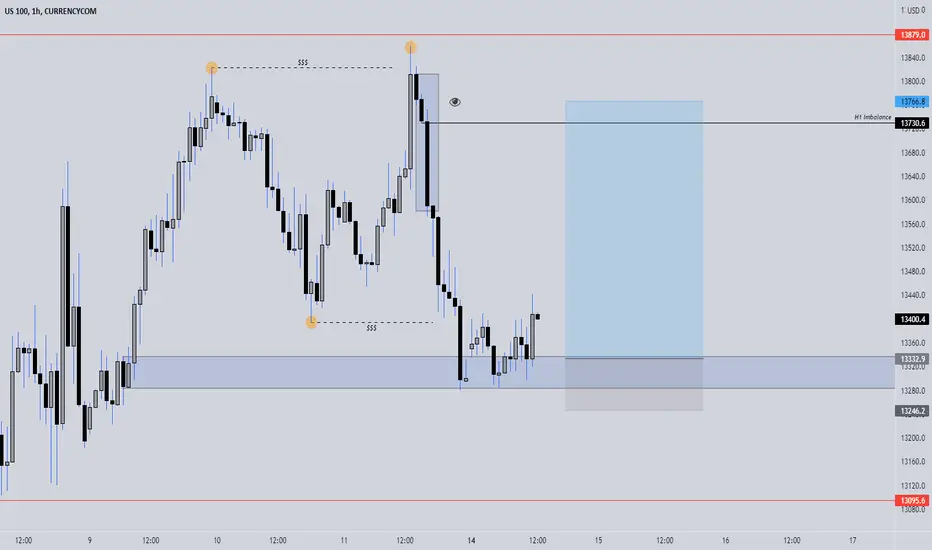
Even if we have a strong bullish momentum here, on a higher timeframe we are in a bearish market structure. I expect price to continue the retracement to fill the imbalance and then to reject from resistance.
Like, comment and subscribe to be in touch with my content!
Us100idea

NASDAQ-True analysisAccurate analysis. That's an update. Based on my analysis for US30 on Aug 17.
To be Notified about the analysis, follow me and contact me if you have any comments or questions. (I will answer whenever I have time).

US100...SHORT (12%)After a clear breakout from my trendline, expecting NAsDaq to fall to 14th July's low probably at 11600....due to the increasing strength of USd.
there's a possibility for us100 moving back to the breakout range before its deep.

NASDAQ-US100If the price breaks the trend according to my idea and then the price has a correction, then by rechecking the chart you can decide to trade.
Observe the money management and the stop loss, to know about Analysis, follow me And contact me if you have any comments or questions. (I will answer whenever I have time).
Wait for the update.

NASDAQOpportunity to Buy. This is an analysis based on price action and wave analyses. The price goes up on Daily and breaks the trend-line, and pulls back approximately happen; It has an excellent chance to buy till the top up to the targets specified in the chart.

US30 and US100 top down analysisHello traders, this is the full breakdown of this pair. We will take this trade if all the conditions are satisfied as discussed in the analysis. Smash the like button if you find value in this analysis and drop a comment if you have any questions or let me know which pair to cover in my next analysis.

US100 4HR TimeframeAnd that's how the study was
341 PIPS all the way up hope u took it traders
It was an amazing trade

US100 4HR TimeframeIt might be a good opportunity to buy at 11780
Its forming an inverted Head And Sholder
And breaking a strong resistance
And its gonna be breaking 0.382 Fibonacci

US100 DAILY TIMEFRAMEUS100 might have a good sell after it break 11780 that is 0.382 on fibonacci target 12210 that is 0.618 on fibonnacci
after reaching historical level it reversed now breaking that resistance is good and its still have gap to fill
and its still bouncing between the channel
as on the weekly timeframe we have divergence on cci and %R
have confirmations before taking the trade when it brake see how its breaking and the candles
and do ur own risk management and secure profits always

NASDAQ LONGS 📉📉📉Expecting bullish price action on NASDAQ as price makes the draw on liquidity on the weekl lows, and we have a lot of bearish imbalances on the H4/D1 that should be filled, VIX should go down meaning the decrease in the volatility and the rise in the NASDAQ COMPOSITE
What do you think ? Comment below..

NASDAQ LONGS 📉📉📉Expecting bullish price action on NASDAQ as price makes the draw on the weekly lows liquidity taking out the retail stops from that area. We have a lot of bearish imbalances that should be filled asap and i expect that to be seen for today or tomorrow because all it depends on the volatility we have in the markets, another bullish confluence there is that the VIX made a bullish GAP meaning it should go down to make the retracement and this could speed up the bullish movement on the indexes.
What do you think ? Comment below..

US100 LONGS ADDING 📉📉📉📉 I will add to my winning position on NASDAQ moving the first entry's stop loss to the breakeven region. We have a manipulation belowe sell side liquidity and price hopefully rejects from this orderblock bullish area.
What do you think ? Comment below..

NASDAQ LONGS 📉📉📉NASDAQ/USTECH 100 - Market Analysis for the upcoming week.
What do you think ? Comment below..

NASDAQ LONGS 📉📉📉📉 Expecting bullish price action on NASDAQ as price takes out old lows liquidity and right now is rejecting a bullish orderblock area + POC(point of control) on the VolumeProfile Indicator. We have a lot of bearish imbalances that has to be filled asap somewhere around 13730.
What do you think ? Comment below...
NASDAQ LONGS 📉📉📉📉 Expecting bullish price action on NASDAQ as price takes out weekly low stops aka sell side liquidity and closing on the area with a high momentum bullish candlestick on h4 meaning that bulls took control in that area after the manipulation of the stops, we have a institutional figure 14.000 where price made a liquidity spike probably taking out more stops that were there. An important demand area h4 orderblock bullish is in this area as well.
Always remember to buy when price takes out weekly lows meaning it's a bullish weeek and vice versa for taking out weekly highs
Asian/European session opened bullish meaning for today, meaning we are in a RISK ON market sentiment meaning LONG INDEXES
What do you think we go next on NASDAQ chart?


Nas100 long term sellsAfter nas100 did a small liquidity sweep and left behind a good institutional candle for us ,i will be buying up to my OB area on the daily and from there i will swing my sells down to my three targets.

| NASDAQ | Head and Shoulder patternaccording to my observation the pattern seems to be a Head & Shoulder pattern and 50Moving Average is also aligning with the prices highlighted, I am watching this carefully for the confirmation of this structure before taking any position.

US100 / NASDAQ: SIGNAL TRADINGHere is my idea, to take benefit from reversal
Use your money management wisely


NASDAQ : Short Key level ConfirmationI expected nas100 to short for this daily analysis. We take a look and enter fast. Descending channel in formation

NAS100 HEADING TO HIGHER HIGHSBased on the MACD and Volume analysis we see divergence occurring on the histogram. With appropriate stops expect price to create newer highs. Perfect time to enter.

