Bullish bounce off overlap support?Dow Jones (US30) is falling towards the pivot and could bounce to the 1st resistance which acts as a swing high resistance.
Pivot: 44,596.08
1st Support: 44,267.57
1st Resistance: 45,106.42
Risk Warning:
Trading Forex and CFDs carries a high level of risk to your capital and you should only trade with money you can afford to lose. Trading Forex and CFDs may not be suitable for all investors, so please ensure that you fully understand the risks involved and seek independent advice if necessary.
Disclaimer:
The above opinions given constitute general market commentary, and do not constitute the opinion or advice of IC Markets or any form of personal or investment advice.
Any opinions, news, research, analyses, prices, other information, or links to third-party sites contained on this website are provided on an "as-is" basis, are intended only to be informative, is not an advice nor a recommendation, nor research, or a record of our trading prices, or an offer of, or solicitation for a transaction in any financial instrument and thus should not be treated as such. The information provided does not involve any specific investment objectives, financial situation and needs of any specific person who may receive it. Please be aware, that past performance is not a reliable indicator of future performance and/or results. Past Performance or Forward-looking scenarios based upon the reasonable beliefs of the third-party provider are not a guarantee of future performance. Actual results may differ materially from those anticipated in forward-looking or past performance statements. IC Markets makes no representation or warranty and assumes no liability as to the accuracy or completeness of the information provided, nor any loss arising from any investment based on a recommendation, forecast or any information supplied by any third-party.
US30

GOLD - SHORT TO $2,880 (UPDATE)Gold 'Sell Trade' running 1,130 PIPS in profit to start the week. I hope you are all taking advantage of this free analysis & profiting from Gold's downside. Amazing move to start the new week, with much more downside expected.
Drop me a message @XTBCAP for Account Management & Investment opportunities✅

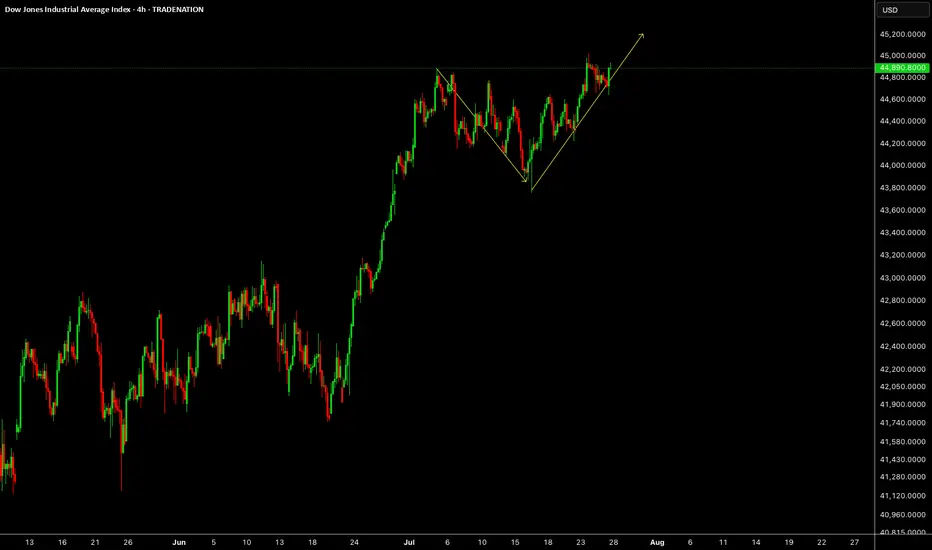
US30: : Local Bullish Bias! Long!
My dear friends,
Today we will analyse US30 together☺️
The recent price action suggests a shift in mid-term momentum. A break above the current local range around 44,802.50 will confirm the new direction upwards with the target being the next key level of 44,914.32 and a reconvened placement of a stop-loss beyond the range.
❤️Sending you lots of Love and Hugs❤️
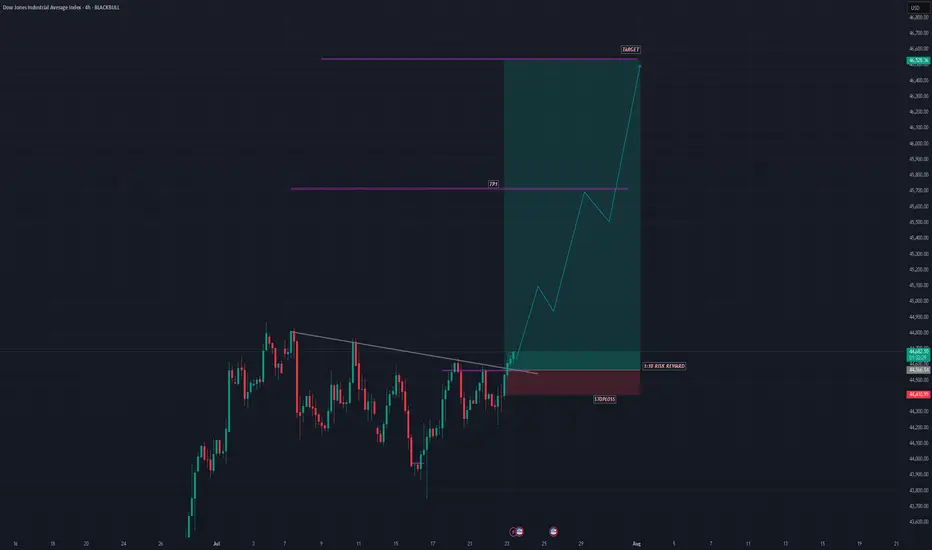
US30 SHOWING A GOOD UPWARD MOVE WITH 1:10 RISK REWARDUS30 SHOWING A GOOD UPWARD MOVE WITH 1:10 RISK REWARD
DUE TO THESE REASON
A. its following a rectangle pattern that stocked the market
which preventing the market to move any one direction now it trying to break the strong resistant lable
B. after the break of this rectangle it will boost the market potential for break
C. also its resisting from a strong neckline the neckline also got weeker ald the price is ready to break in the outer region
all of these reason are indicating the same thing its ready for breakout BREAKOUT trading are follows good risk reward
please dont use more than one percentage of your capital follow risk reward and tradeing rules
that will help you to to become a better trader
thank you
"We are going higher than 45,135.78The Dow Jones has the potential to start an upward move from the 44,811.77 and 44,732 levels, aiming for 45,135.78." CMCMARKETS:US30

US30 Forecast: Target Locked, Buy Zones in Sight!Good morning friends ☀️
I've prepared a fresh analysis for US30 (Dow Jones).
My current target is 45,470. Even if the price dips to 45,050 or 44,800, I fully expect it to reach that 45,470 mark.
These levels represent strong buying zones and powerful retest regions—don’t forget that.
Every like from you is my biggest source of motivation to keep posting these insights. 💬📊
Big thanks to everyone supporting with a thumbs-up.

OVERVIEW The price is currently undergoing a bearish correctionUS30 OVERVIEW
The price is currently undergoing a bearish correction, targeting 44910. To confirm a bearish trend continuation, the price must break below 44770, which would likely lead to a move toward 44610.
However, if the price stabilizes above 44910 on the 4H timeframe, a bullish reversal may begin. A confirmed break above 45100 would strengthen bullish momentum and open the path toward 45290.
Key Levels:
• Pivot Line: 45045
• Support: 44910 – 44770 – 44610
• Resistance: 45100 – 45290

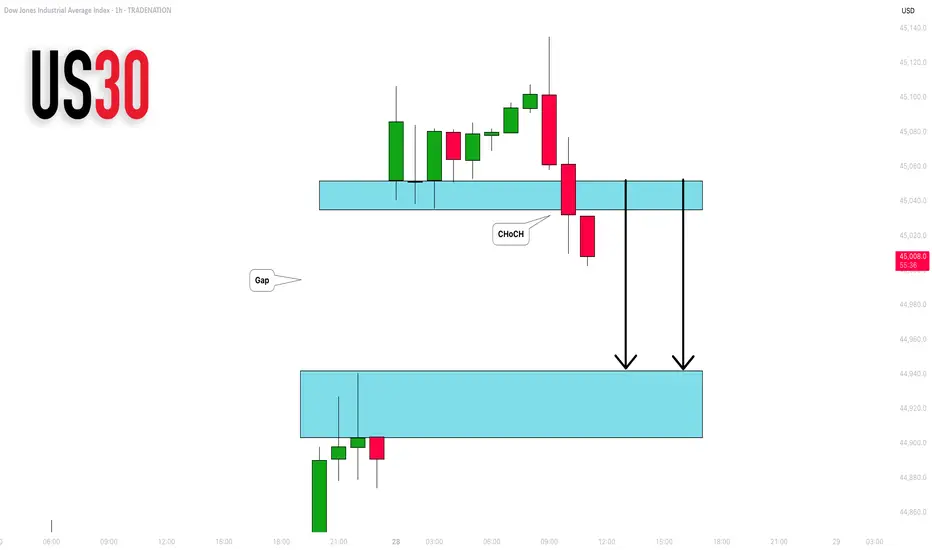
DOW JONES INDEX (US30): Another Gap For Today?
I see another gap up opening on US30 Index.
I think it will be filled today. A formation of an intraday
bearish CHoCH on an hourly time frame suggests
a highly probable bearish continuation.
Goal - 44943
❤️Please, support my work with like, thank you!❤️
I am part of Trade Nation's Influencer program and receive a monthly fee for using their TradingView charts in my analysis.
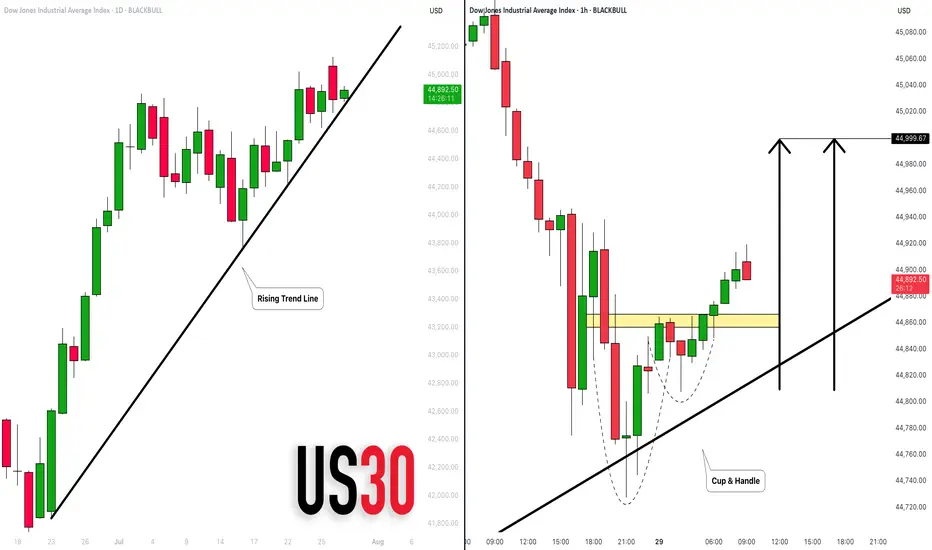
DOW JONES INDEX (US30): Bullish Move From Trend Line
There is a high probability that US30 will continue rising today,
following a test of a solid rising trend line on a daily.
As a confirmation, I see a cup & handle on that after its test
on an hourly time frame.
Goal - 45000
❤️Please, support my work with like, thank you!❤️
US30US30 needs some more upside short term towards 45.2K level.
Disclosure: We are part of Trade Nation's Influencer program and receive a monthly fee for using their TradingView charts in our analysis.
Do you agree with a big profit in US30?
Hello friend
Do you think the orange line will break?
What if it breaks?
Just wait and collect the money.
If you liked my analysis, please support me by liking, commenting and subscribing. Thanks friend

Dow Jones Potential UpsidesHey Traders, in the coming week we are monitoring US30 for a buying opportunity around 44,650 zone, Dow Jones is trading in an uptrend and currently is in a correction phase in which it is approaching the trend at 44,650 support and resistance area.
Trade safe, Joe.

US30: Local Bearish Bias! Short!
My dear friends,
Today we will analyse US30 together☺️
The in-trend continuation seems likely as the current long-term trend appears to be strong, and price is holding below a key level of 44,774.9 So a bearish continuation seems plausible, targeting the next low. We should enter on confirmation, and place a stop-loss beyond the recent swing level.
❤️Sending you lots of Love and Hugs❤️

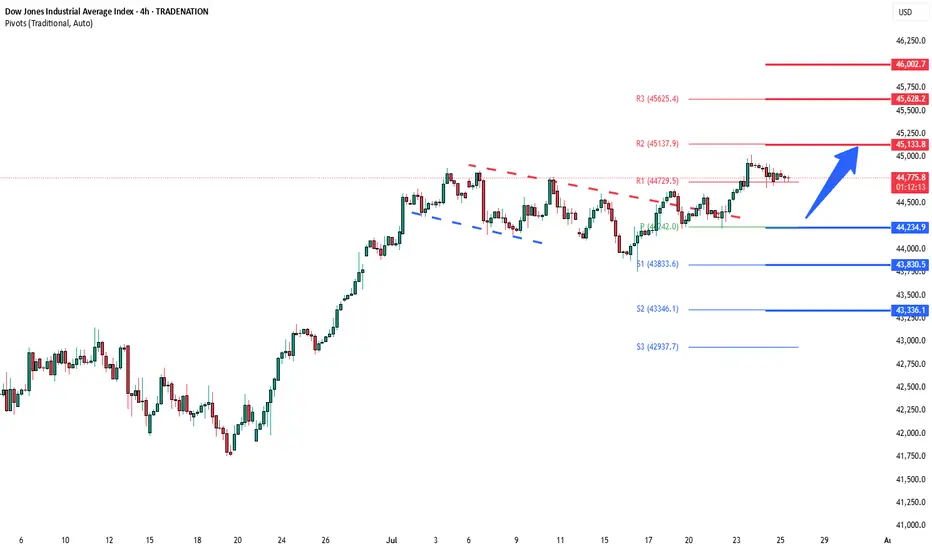
DowJones bullish breakout support at 44240Key Support and Resistance Levels
Resistance Level 1: 45135
Resistance Level 2: 45630
Resistance Level 3: 46000
Support Level 1: 44240
Support Level 2: 43830
Support Level 3: 43340
This communication is for informational purposes only and should not be viewed as any form of recommendation as to a particular course of action or as investment advice. It is not intended as an offer or solicitation for the purchase or sale of any financial instrument or as an official confirmation of any transaction. Opinions, estimates and assumptions expressed herein are made as of the date of this communication and are subject to change without notice. This communication has been prepared based upon information, including market prices, data and other information, believed to be reliable; however, Trade Nation does not warrant its completeness or accuracy. All market prices and market data contained in or attached to this communication are indicative and subject to change without notice.
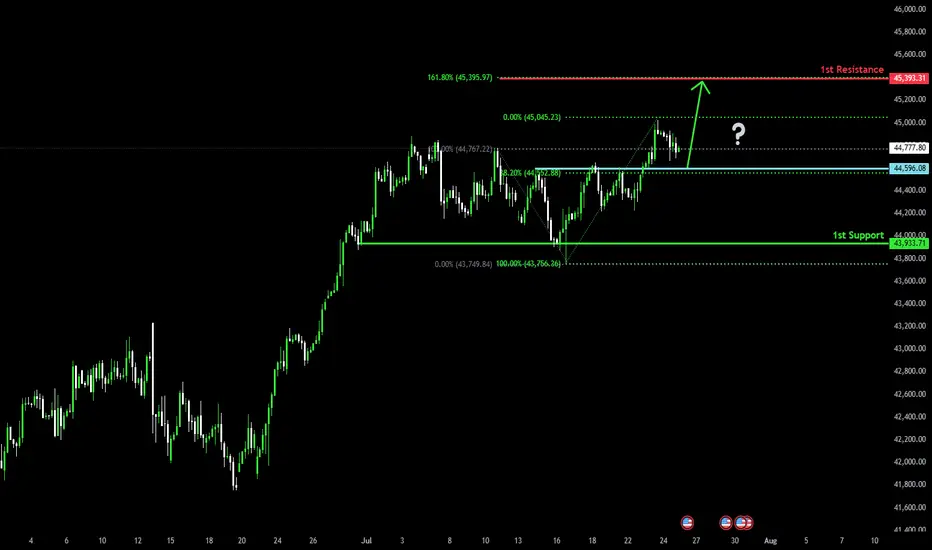
Bullish bounce off pullback support?Dow Jones (US30) is falling towards the pivot and could bounce to the 161.8% Fibonacci resistance.
Pivot: 44,596.08
1st Support: 43,933.71
1st Resistance: 45,393.31
Risk Warning:
Trading Forex and CFDs carries a high level of risk to your capital and you should only trade with money you can afford to lose. Trading Forex and CFDs may not be suitable for all investors, so please ensure that you fully understand the risks involved and seek independent advice if necessary.
Disclaimer:
The above opinions given constitute general market commentary, and do not constitute the opinion or advice of IC Markets or any form of personal or investment advice.
Any opinions, news, research, analyses, prices, other information, or links to third-party sites contained on this website are provided on an "as-is" basis, are intended only to be informative, is not an advice nor a recommendation, nor research, or a record of our trading prices, or an offer of, or solicitation for a transaction in any financial instrument and thus should not be treated as such. The information provided does not involve any specific investment objectives, financial situation and needs of any specific person who may receive it. Please be aware, that past performance is not a reliable indicator of future performance and/or results. Past Performance or Forward-looking scenarios based upon the reasonable beliefs of the third-party provider are not a guarantee of future performance. Actual results may differ materially from those anticipated in forward-looking or past performance statements. IC Markets makes no representation or warranty and assumes no liability as to the accuracy or completeness of the information provided, nor any loss arising from any investment based on a recommendation, forecast or any information supplied by any third-party.
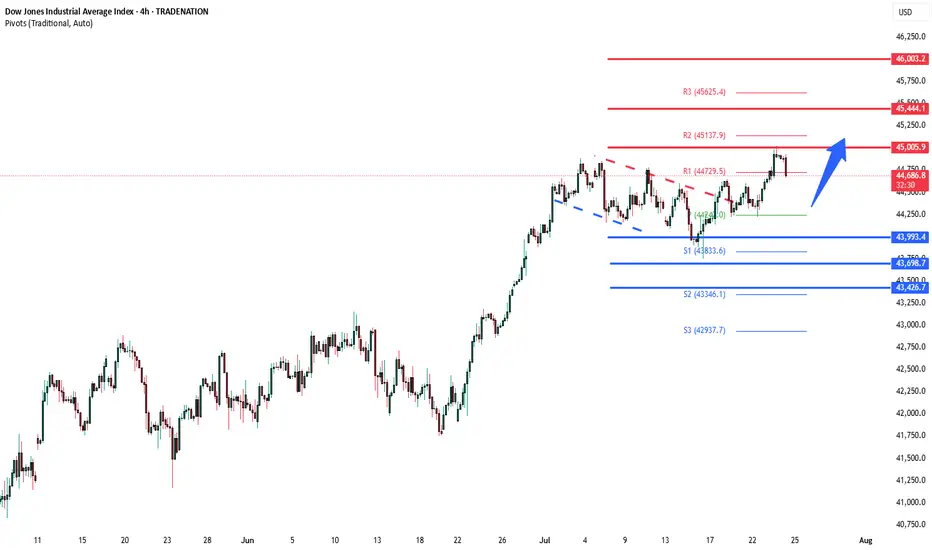
DowJones uptrend support at 43990Key Support and Resistance Levels
Resistance Level 1: 45000
Resistance Level 2: 45444
Resistance Level 3: 46000
Support Level 1: 43990
Support Level 2: 43700
Support Level 3: 43426
This communication is for informational purposes only and should not be viewed as any form of recommendation as to a particular course of action or as investment advice. It is not intended as an offer or solicitation for the purchase or sale of any financial instrument or as an official confirmation of any transaction. Opinions, estimates and assumptions expressed herein are made as of the date of this communication and are subject to change without notice. This communication has been prepared based upon information, including market prices, data and other information, believed to be reliable; however, Trade Nation does not warrant its completeness or accuracy. All market prices and market data contained in or attached to this communication are indicative and subject to change without notice.
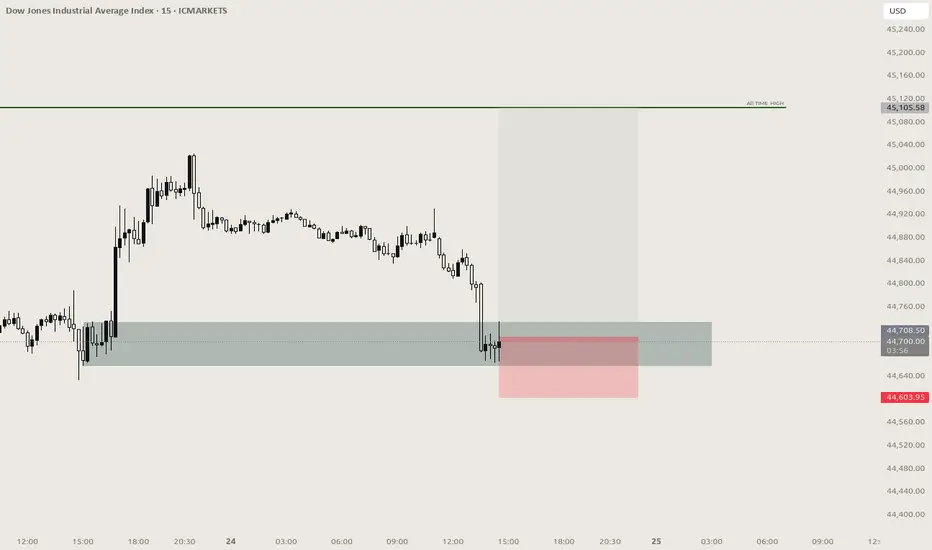
US30 Hits New All-Time High – What’s Next?US30 | OVERVIEW
The price has printed a new all-time high, exactly reaching our target at 45,090, as previously anticipated.
Today, we may see a correction toward 44,770 and 44,610. If the price stabilizes above these levels, another bullish leg is expected.
On the upside, a break above 44,910 would confirm a bullish continuation toward 45,090 and 45,250.
Key Levels:
Support: 44,770 · 44,610 · 44,370
Resistance: 45,090 · 45,250
previous idea:

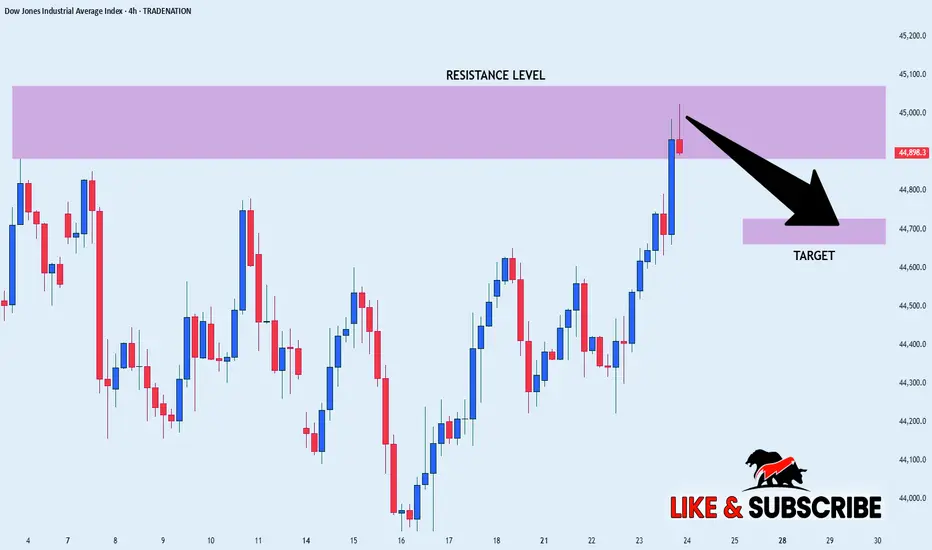
US30 SHORT FORM RESISTANCE|
✅DOW JONES index keeps
Growing in a strong uptrend
And we are bullish biased long-term
However the price has hit an all-time-high
Resistance level of 45,072(which can be seen
Further left you zoom out on higher TF)
So as we are already seeing a local
Bearish reaction we will be
Expecting a local bearish correction
SHORT🔥
✅Like and subscribe to never miss a new idea!✅
Disclosure: I am part of Trade Nation's Influencer program and receive a monthly fee for using their TradingView charts in my analysis.
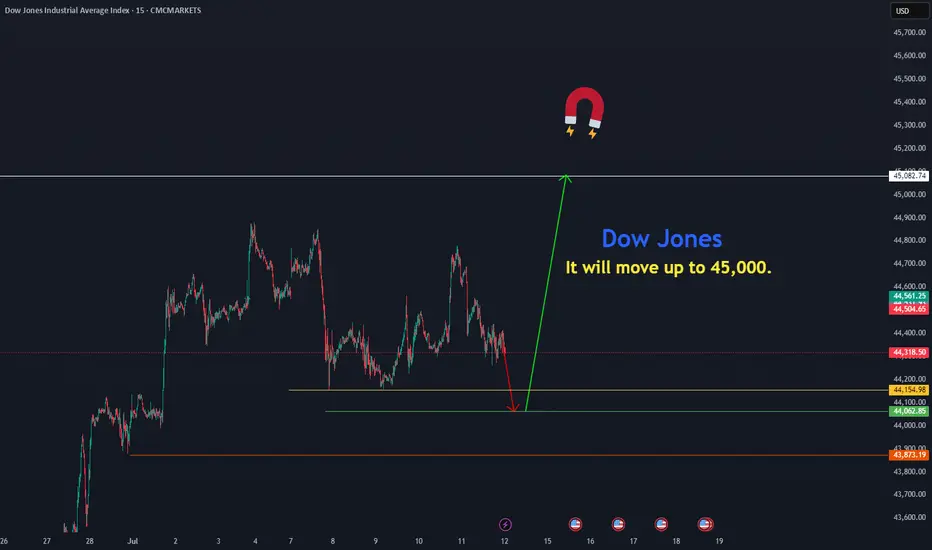
Dow Jones move upThe Dow Jones is resuming its rally toward 45,082 from the price zones of 44,154.97 and 44,000.
CMCMARKETS:US30
US30 Massive Bullish Breakout!
HI,Traders !
#US30 is trading in a strong
Uptrend and the price just
Made a massive bullish
Breakout of the falling
Resistance line and the
Breakout is confirmed
So after a potential pullback
We will be expecting a
Further bullish continuation !
Comment and subscribe to help us grow !

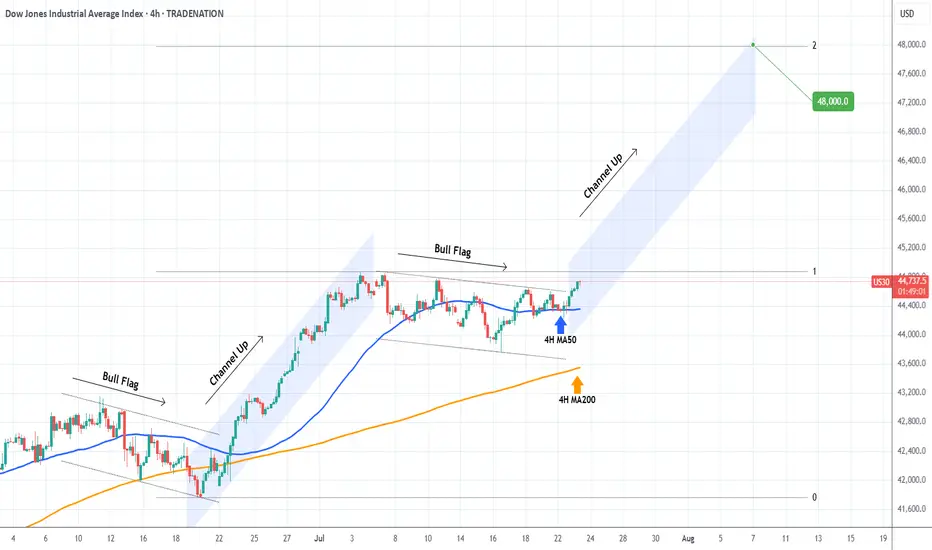
DOW JONES Strong rebound on its 4H MA50.Dow Jones (DJI) is having a strong rebound exactly on its 4H MA50 (blue trend-line). This is taking place just after the price broke above the Bull Flag that served as the accumulation pattern following the previous Channel Up.
This is a repetitive pattern and most likely we will now see the new Channel Up starting. The technical Target on such formations is the 2.0 Fibonacci extension at 48000.
-------------------------------------------------------------------------------
** Please LIKE 👍, FOLLOW ✅, SHARE 🙌 and COMMENT ✍ if you enjoy this idea! Also share your ideas and charts in the comments section below! This is best way to keep it relevant, support us, keep the content here free and allow the idea to reach as many people as possible. **
-------------------------------------------------------------------------------
Disclosure: I am part of Trade Nation's Influencer program and receive a monthly fee for using their TradingView charts in my analysis.
💸💸💸💸💸💸
👇 👇 👇 👇 👇 👇
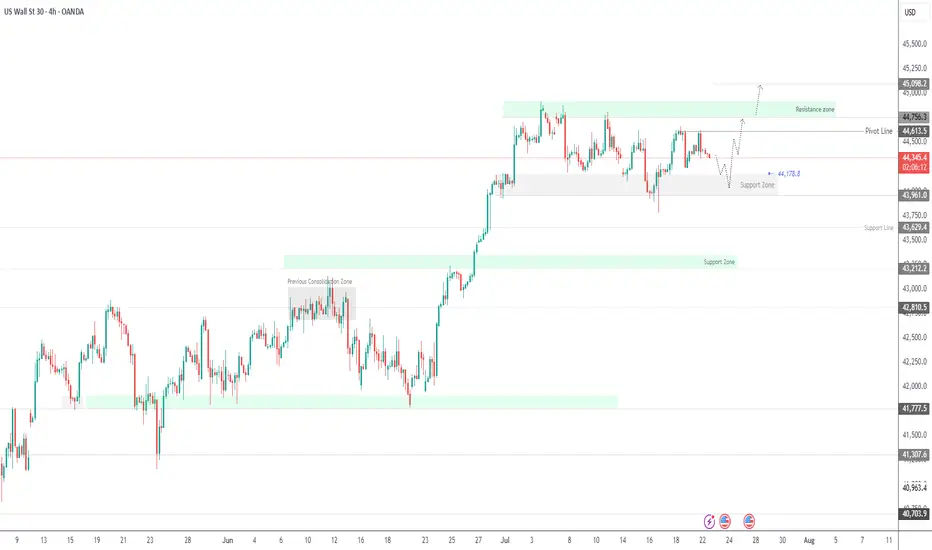
Dow Set for Volatile Move as Earnings, Tariff Risks CollideUS30 OVERVIEW
The price is currently consolidating between 44,180 and 44,620, awaiting a catalyst. Today’s earnings reports are expected to heavily influence Dow Jones price action.
If earnings come in strong, the index is likely to push toward 44,620 and 44,760. A confirmed stability above 44,620 would strengthen the bullish case, potentially opening the path toward a new all-time high near 45,100.
However, a break below 44,180 would signal bearish momentum, with potential downside toward 43,960. Additional pressure could come from escalating tariff tensions, further weakening sentiment.
Resistance: 44,620 · 44,760 · 45,100
Support: 44,180 · 43,960 · 43,630
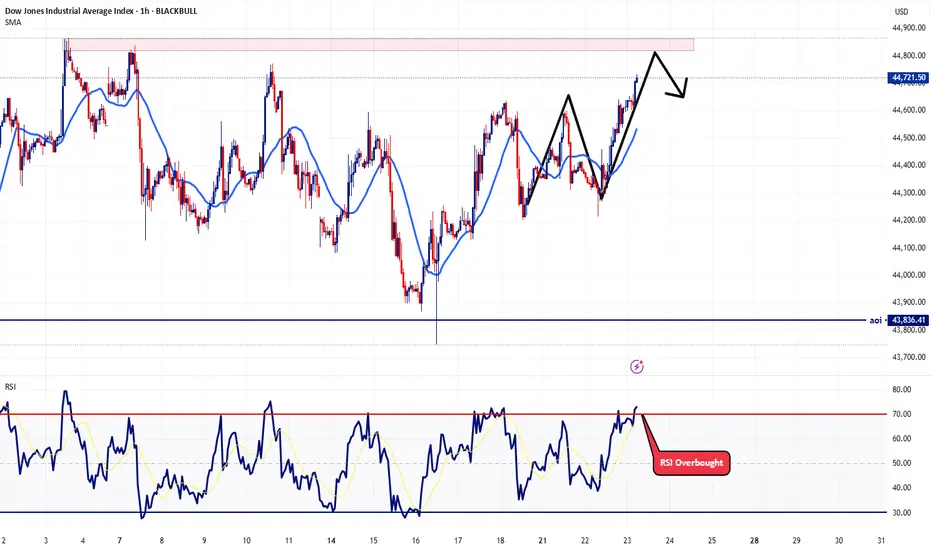
US30 - What I believe will happen todayConsidering today is now Wednesday and Wednesday's have a consistency of being one of those off days. Primarily because usually there are Fed speeches on this day that manipulate the market. With that said, I'm expecting price action to play out how I plotted the arrows on the chart. I believe there is still some further upside for today but then I believe we might get that intraday correction around 11:am - noon EST.
Let's see how today plays out. Trade safe