US30 Momentum Rebuild: Breakout Retest Signals Potential Upside📈 DJI30 / US30 – Dow Jones Industrial Average Trade Opportunity Guide
🏛️ Market Context
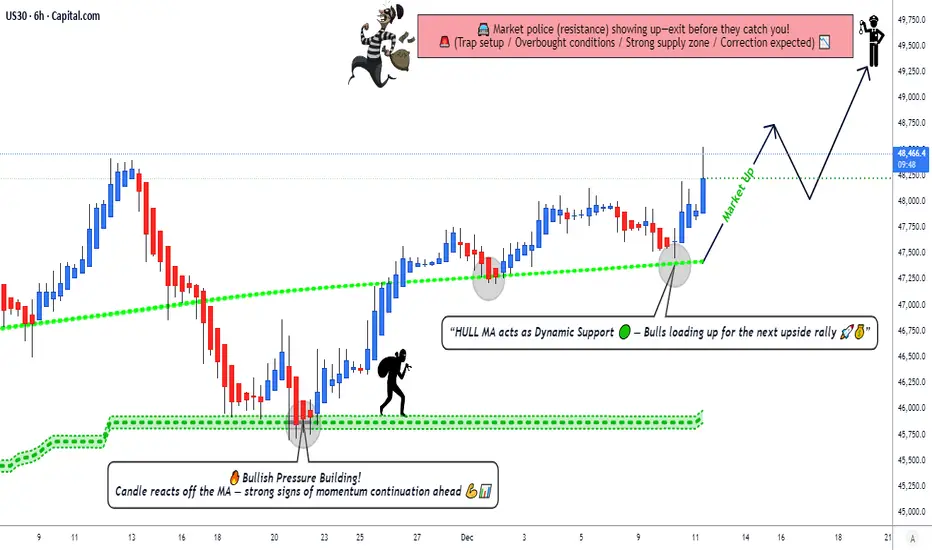
The index is showing strong accumulation pressure, with buyers stepping back in as volatility narrows. Momentum tools and trend metrics continue to lean toward the upside, creating a setup where disciplined layering becomes highly effective for precision entries.
🔥 Trade Plan – Bullish Strategy in Play
✅ Technical Confirmation
KIJUN MA accumulation indicates steady buy-side pressure building beneath price.
HULL Moving Average breakout completed with a clean pullback + retest, confirming trend continuation strength.
Market structure remains constructive with higher lows forming consistently.
🎯 Entry Plan (Layering Method Included)
Any price level can be used, but this plan uses Thief Layering Strategy for controlled scaling:
💠 Buy Limit Layers:
47,000
47,250
47,500
47,750
48,000
(Traders can add more layers depending on personal risk and capital allocation style.)
🛡️ Stop Loss (SL)
Thief SL → 46,750
Dear Ladies & Gentlemen (Thief OGs): Please adjust according to personal strategy and risk. This SL is an example, not a fixed rule. Trade with your own management principles.
🎯 Target (TP)
Main Target → 49,500
The market is approaching major moving-average resistance + overbought zones + potential trap regions. It’s wise to secure profits as the index reaches upper supply levels.
Again, Ladies & Gentlemen (Thief OGs): TP is flexible. Manage your profit bookings based on your personal approach.
🌍 Related Pairs to Watch & Correlations
1️⃣ SP:SPX / S&P 500
Often moves in high correlation with US30.
Strong bullish momentum here typically supports US30 upside.
Watch for divergence → if SPX stalls while US30 pushes, upside may weaken.
2️⃣ NASDAQ:NDX / NAS100 (Nasdaq 100)
Tracks tech sentiment, which influences overall US risk appetite.
If NAS100 shows weakness while Dow is rising, expect mixed flows → Dow may slow down but still hold structure.
3️⃣ TVC:VIX (Volatility Index)
Inverse correlation to US30.
Falling VIX = stronger risk-on behavior, supporting bullish Dow positions.
Sudden VIX spikes signal caution on existing long positions.
4️⃣ TVC:DXY (US Dollar Index)
Strong Dollar sometimes suppresses equity momentum.
If DXY drops, US30 tends to gain strength as liquidity flows to equities.
5️⃣ CBOT_MINI:YM1! (Dow Futures)
The closest real-time mirror of US30 price action.
Useful for re-entry timing during pullbacks and session gaps.
🧭 Final Notes
Stay disciplined with your own SL/TP logic, manage exposure through layered entries, and monitor correlation assets for confirmation. This is a flexible play designed for DAY & Swing traders who thrive in momentum-driven environments.
Us30long
US30 Trade Set Up Dec 12 2025Price remains bullish making ATH so i will want to see price first sweep internal London lows or lower SSL first before looking for 1m-5m IFVG/CISD to continue higher

US30 Risky Long!
HI,Traders !
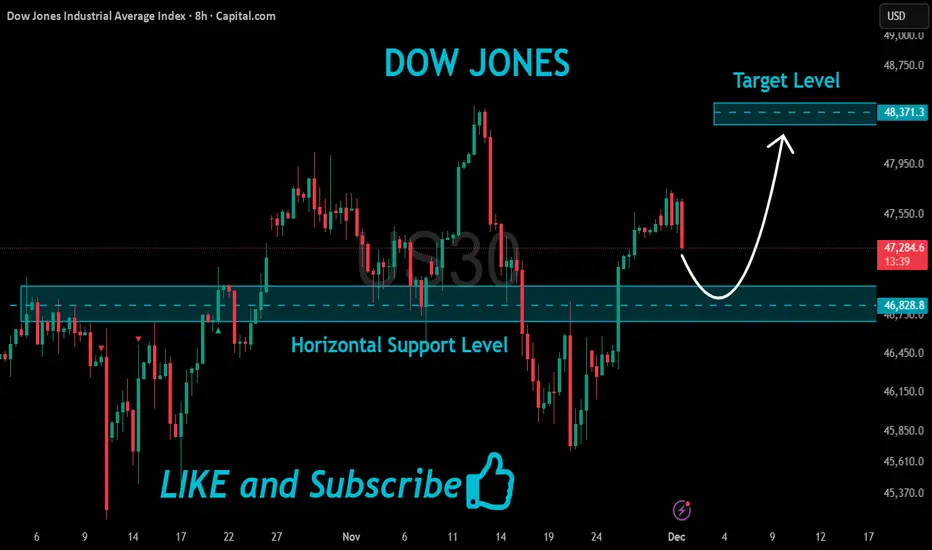
#US30 is about to retest
A horizontal support level
Of 46828.8 while trading
In a local uptrend so
We will be expecting a
Local bullish rebound
And a further move up !
Comment and subscribe to help us grow !
US30 Trade Secured 1500 Pipsperfect trade, sweeping London lows then IFVG on the 2m to target 1h FVG

GET READY FOR DOW30 HIGH PROBABILITY BUY SETUP SOON!!!🚨US30 HIGH PROBABILITY BUY SETUP 🚨
* Here We Can See Clearly The Next Potential Moves For DJ30 Coming Hours/Days.
* Keep Your Eyes Close On Your Trading Positions.
* Happy PIP Hunting Traders.
FXKILLA.

DOW/US30 - BEAUTIFUL CHART Team, I am looking at the US30/DOW - whatever you call it
look beautiful on the 5/15 minutes channel
Sorry, i been too lazy to post because lately I've been doing scalping
I am about to prove another challenge where $1000 turns into a million
Last account $1000 turned into 100k, took 6 months
But this challenge, I am not sure.
Anyway lets focus on the trade right now
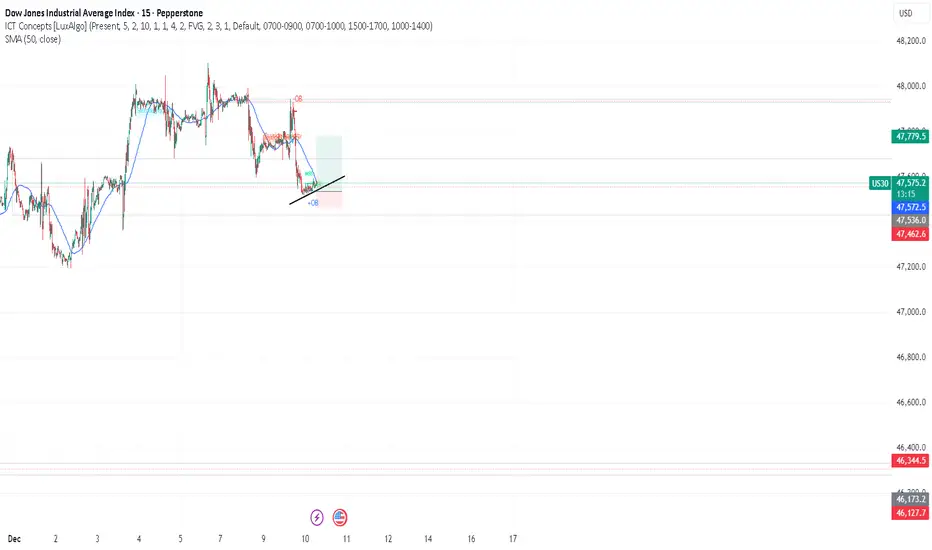
the price is 47590-99 - long entry
STOP LOSS at 47550
Target 1 at 47650-47666
Target 2 at 47701-47715
Target 3 at 47760-47781
LETS GO
US30 Trade Set Up Dec 8 2025Price is currently in a 1h range so first i want to see either a sweep of SSL/Asia and London lows to then look for 1m-5m IFVG/CISD to target BSL and supply

Can the Dow Jones Continue Its Bullish Momentum This Week?🚀 US30/DJI Dow Jones - Bullish Pullback Opportunity 📈
Professional Market Blueprint | Swing Trade Setup
📊 TRADE OVERVIEW
Asset: US30/DJI - Dow Jones Industrial Average Index
Timeframe: Swing Trade (4H-Daily)
Bias: 🟢 BULLISH - Hull MA Pullback Strategy
Confirmation: Heikin Ashi Reversal Candle Pattern
🎯 ENTRY STRATEGY - "LAYERING METHOD" 🎯
Approach: Multiple limit orders (Professional Risk Distribution)
Layer Entry Points:
Layer 1: 46,600 🔵
Layer 2: 46,800 🔵
Layer 3: 47,000 🔵
Layer 4: 47,200 🔵
💡 Tip: Adjust additional layers based on your risk tolerance and account size
🛑 RISK MANAGEMENT
Stop Loss: 46,400
⚠️ DISCLAIMER: This is a reference level only. You manage your own risk. Adjust SL according to your strategy and risk profile.
Take Profit Target: 48,800
📌 Rationale: Moving Average resistance + Overbought zone + Trap detection
⚠️ DISCLAIMER: This is a reference level only. You manage your own risk. Take profits at your own discretion.
📈 TECHNICAL CONFLUENCE
✅ Hull Moving Average - Bullish alignment & pullback structure
✅ Heikin Ashi Reversal - Confirmation candle pattern at entry zones
✅ Moving Average Resistance - Strong rejection level near TP
✅ Overbought Divergence - Potential trap for trap traders
✅ Risk/Reward Ratio - Favorable 1:3+ setup potential
🔗 RELATED PAIRS TO WATCH - CORRELATION ANALYSIS
📍 AMEX:SPY - S&P 500 ETF (Positive Correlation - 0.92)
US30 follows broad market sentiment. SPY strength = DJI bullish momentum.
📍 NASDAQ:QQQ - Nasdaq-100 ETF (Positive Correlation - 0.85)
Tech sector performance impacts overall market. Monitor for divergence signals.
📍 AMEX:IWM - Russell 2000 (Small Cap) (Positive Correlation - 0.88)
Small-cap rotations precede index moves. Early trend confirmation signal.
📍 AMEX:GLD - Gold Spot Price (Inverse Correlation - -0.45)
Risk-on sentiment (bullish DJI) = weaker gold. Inverse hedge setup.
📍 TVC:VIX - Volatility Index (Inverse Correlation - -0.70)
Rising VIX = market fear = DJI pullback risk. Monitor at entry zones.
📍 TVC:US10Y Yield (Negative Correlation - -0.55)
Rising yields pressure equities. Check yield strength before entries.
📍 TVC:DXY - US Dollar Index (Weak Negative - -0.30)
Stronger dollar = export headwinds. Minor impact, secondary indicator.
⚡ KEY TRADING RULES
🔴 BEFORE ENTRY:
Confirm Hull MA slope is positive
Wait for Heikin Ashi reversal candle close
Check VIX & SPY alignment
Ensure no major economic events
🟢 AT ENTRY:
Use layering strategy (don't chase)
Build position gradually across 4 layers
Scale risk based on account size
Document entry price & time
🟡 DURING TRADE:
Trail stop loss after +1% profit
Monitor related pairs for divergence
Close 50% at +2% for risk-free trade
Let remainder run to target
🔵 EXIT PLAN:
Target: 48,800 (reference level)
Or: Exit on Heikin Ashi reversal signal
Or: Close on MA resistance rejection
Never hold into major news events

US30 Trade Set Up Dec 4 2025Price remains bullish so i am expecting price to sweep SSL and/or tap into 4h FVG to then look for internal 1m-5m IFVG/CISD to continue higher to PDH and higher BSL/supply

US30 Trade Set Up Dec 2 2025Price swept PDL, engulfed bearish 1h and 4h candles and is now testing 1h FVG so i will look for internal 1m-5m bullish structure followed by IFVG/CISD to take buys to PDH

US30 H1 | Bullish Bounce Off Pullback SupportMomentum: Bullish
Price is currently above the ichimoku cloud.
Buy entry: 47,553.30
- Pullback support
- 50% Fib retracement
Stop Loss: 47,362.17
- Swing low support
Take Profit: 47,750.49
- Swing high resistance
High Risk Investment Warning
Stratos Markets Limited (tradu.com/uk ), Stratos Europe Ltd (tradu.com/eu ):
CFDs are complex instruments and come with a high risk of losing money rapidly due to leverage. 70% of retail investor accounts lose money when trading CFDs with this provider. You should consider whether you understand how CFDs work and whether you can afford to take the high risk of losing your money.
Stratos Global LLC (tradu.com/en ): Losses can exceed deposits.
Please be advised that the information presented on TradingView is provided to Tradu (‘Company’, ‘we’) by a third-party provider (‘TFA Global Pte Ltd’). Please be reminded that you are solely responsible for the trading decisions on your account. Any information and/or content is intended entirely for research, educational and informational purposes only and does not constitute investment or consultation advice or investment strategy. The information is not tailored to the investment needs of any specific person and therefore does not involve a consideration of any of the investment objectives, financial situation or needs of any viewer that may receive it. Past performance is not a reliable indicator of future results. Actual results may differ materially from those anticipated in forward-looking or past performance statements. We assume no liability as to the accuracy or completeness of any of the information and/or content provided herein and the Company cannot be held responsible for any omission, mistake nor for any loss or damage including without limitation to any loss of profit which may arise from reliance on any information supplied by TFA Global Pte Ltd.

US30 H4 | Bullish Bounce Off Key SupportMomentum: Bullish
Price is currently above the ichimoku cloud.
Buy entry: 46,850
- Strong pullback support
- 38.2% Fib retracement
- 61.8% Fib projection
- Fair Value Gap
Stop Loss: 46,316.29
- Swing low support
Take Profit: 47,519.70
- Swing high resistance
High Risk Investment Warning
Stratos Markets Limited (tradu.com/uk ), Stratos Europe Ltd (tradu.com/eu ):
CFDs are complex instruments and come with a high risk of losing money rapidly due to leverage. 70% of retail investor accounts lose money when trading CFDs with this provider. You should consider whether you understand how CFDs work and whether you can afford to take the high risk of losing your money.
Stratos Global LLC (tradu.com/en ): Losses can exceed deposits.
Please be advised that the information presented on TradingView is provided to Tradu (‘Company’, ‘we’) by a third-party provider (‘TFA Global Pte Ltd’). Please be reminded that you are solely responsible for the trading decisions on your account. Any information and/or content is intended entirely for research, educational and informational purposes only and does not constitute investment or consultation advice or investment strategy. The information is not tailored to the investment needs of any specific person and therefore does not involve a consideration of any of the investment objectives, financial situation or needs of any viewer that may receive it. Past performance is not a reliable indicator of future results. Actual results may differ materially from those anticipated in forward-looking or past performance statements. We assume no liability as to the accuracy or completeness of any of the information and/or content provided herein and the Company cannot be held responsible for any omission, mistake nor for any loss or damage including without limitation to any loss of profit which may arise from reliance on any information supplied by TFA Global Pte Ltd.

US30 Trade Secured 1500 PipsSet up played out perfectly, sweeping SSL/Asia Lows, engulfed on the 5m-15m to push higher to -4.25/-4.5 fib

US30 Trade Set Up Nov 28 2025Price remains bullish. Price action isnt the cleanest due to the CME shutdown but i will want to see price sweep PDL, tap into daily FVG to then form 1m-5m IFVG/CISD to continue higher to BSL

US30 Trade Secured 1500 PipsTrade played out perfectly, sweeping SSL in London session, inverting and engulfing on the 15m and 1h to the upside followed by a HL on the 15m to target daily FVG

US30 Trade Set Up Nov 26 2025Price remains in a bullish trend in the 1h so as long as price keeps making HL i will want to see a retest of 1h IFVG or internal SSL to then make 1m-5m IFVG/CISD to continue to fill the daily FVG and sweep BSL

US30 Trade Set Up Nov 25 2025Price remains bullish and has swept SSL already in Asia and London followed by a 1h engulfing and CISD so i will wait for more internal bullish structure on the 5m before looking for buys above PDH to target BSL

US30 Trade Secured 2500 PipsPlayed out perfectly, sweeping SSl and London lows to then engulf and invert on the 5m to target PDL/BSL

US30 Trade Set Up Nov 24 2025Price has swept 1h SSL in London and engulfed 1h bearish candle so i want to see a internal 15m SSL swept followed by 1m-5m IFVG/CISD to target PDH

US30 Trade Secured 1500 PipsSet up played out perfectly, BOS on the 1h, sweep SSL, 5m IFVG and engulfing candle to move up towards BSL

US30 Trade Set Up Nov 19 2025Us30 is still in a overall bearish trend but there is a lot of daily imbalance above that needs to be filled eventually if we sweep SSL and stay closed above, i will look for internal 1m-5m IFVG/CISD to target BSL/PDH

US30 Trade Set Up Nov 17 2025Price has left a daily FVG that will need to be filled this week but first i want to see a sweep of SSL or PDL followed by internal 1m-5m IFVG/CISD to target BSL

US30 LongsBias: Bullish continuation, but with caution given proximity to resistance.
Setup: If price breaks cleanly above the resistance zone with momentum (i.e., a strong bullish candle, minimal wick, decent follow-through) then a long entry is justified. Entry could be placed just above the breakout candle high.
Alternative: If price rejects the resistance zone (e.g., bearish pin bar, engulfing candle, then broken trendline) then a short counter-trend trade might be viable — but only for experienced traders with tight risk control, because the broader trend is still up.
Stop-loss: For the long trade, consider placing a stop just below the breakout candle low or below the trendline pivot, whichever is tighter. For the short trade, a stop above the recent swing high/resistance zone.
Target: For the long trade, the next logical target is the next major supply area (perhaps historical highs or measured move from the consolidation). For the short trade, target near the trendline support or prior swing lows.
The chart shows a clear uptrend over the intermediate term, with a series of higher highs and higher lows.
Price has respected key structure zones (off the weekly and daily frames) and is now approaching a significant resistance region.
Volume data is not shown, but the price action suggests momentum has been backing this move (i.e., relatively strong candles, visible follow-through after retests).
