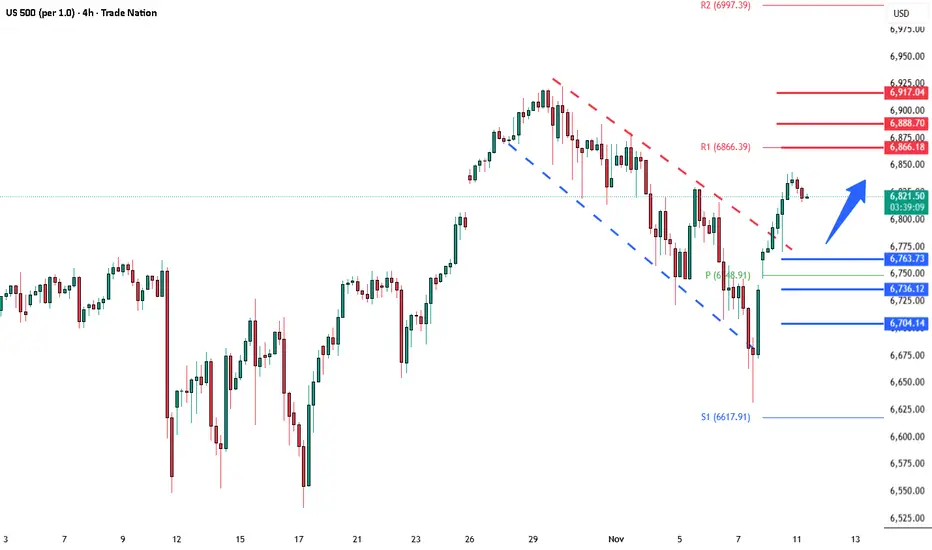
S&P Key Trading LevelsKey Support and Resistance Levels
Resistance Level 1: 6866
Resistance Level 2: 6890
Resistance Level 3: 6920
Support Level 1: 6704
Support Level 2: 6675
Support Level 3: 6650
This communication is for informational purposes only and should not be viewed as any form of recommendation as to a particular course of action or as investment advice. It is not intended as an offer or solicitation for the purchase or sale of any financial instrument or as an official confirmation of any transaction. Opinions, estimates and assumptions expressed herein are made as of the date of this communication and are subject to change without notice. This communication has been prepared based upon information, including market prices, data and other information, believed to be reliable; however, Trade Nation does not warrant its completeness or accuracy. All market prices and market data contained in or attached to this communication are indicative and subject to change without notice.
Us500
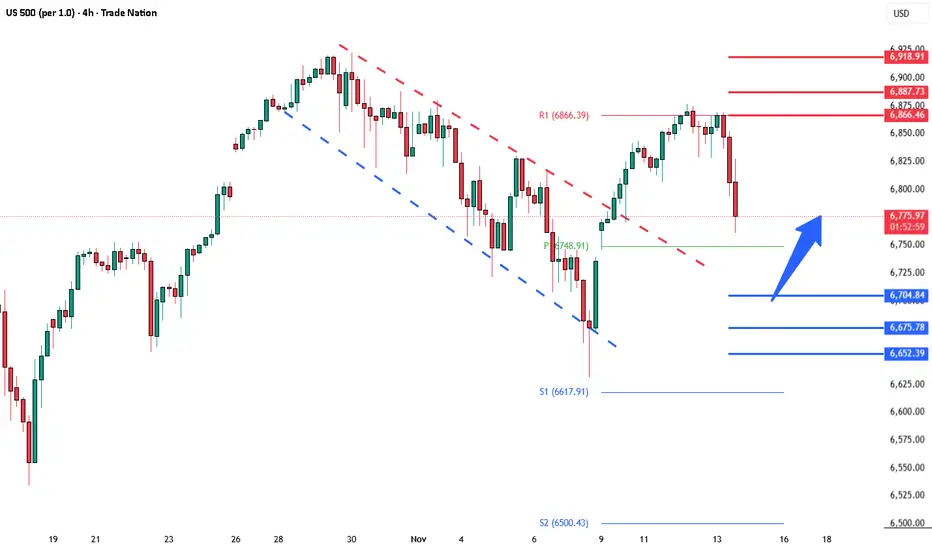
S&P500 The Week Ahead Key Trading Levels Key Support and Resistance Levels
Resistance Level 1: 6866
Resistance Level 2: 6890
Resistance Level 3: 6920
Support Level 1: 6704
Support Level 2: 6675
Support Level 3: 6650
This communication is for informational purposes only and should not be viewed as any form of recommendation as to a particular course of action or as investment advice. It is not intended as an offer or solicitation for the purchase or sale of any financial instrument or as an official confirmation of any transaction. Opinions, estimates and assumptions expressed herein are made as of the date of this communication and are subject to change without notice. This communication has been prepared based upon information, including market prices, data and other information, believed to be reliable; however, Trade Nation does not warrant its completeness or accuracy. All market prices and market data contained in or attached to this communication are indicative and subject to change without notice.

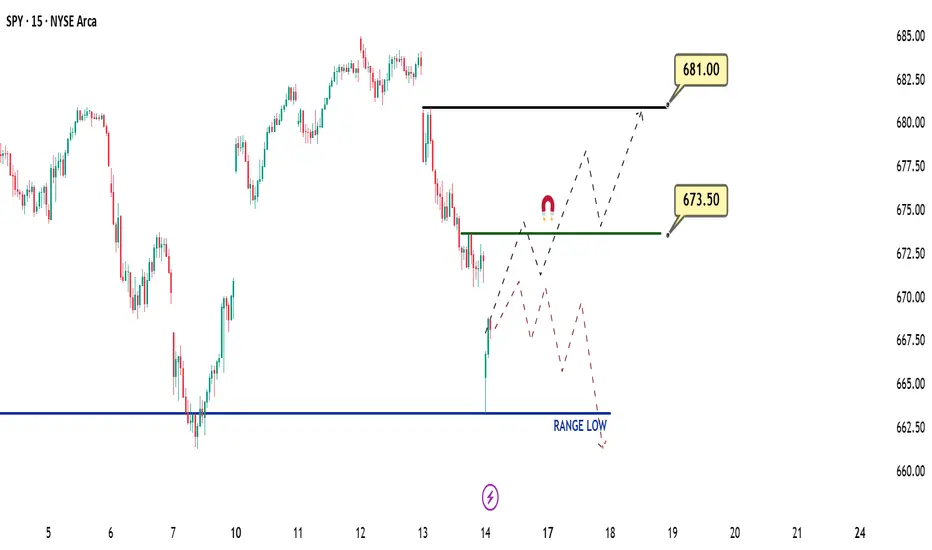
Daily SPY (US500-ES-SPX) Outlook - Prediction (14 NOV)Daily SPY (US500-ES-SPX) Outlook - Prediction (14 NOV)
📊 Market Sentiment
Market sentiment appears neutral, in my opinion. The U.S. government is expected to reopen soon; however, officials have decided not to release previous economic data. This creates uncertainty for traders — without key data, it becomes difficult to anticipate the FED’s next policy decision.
📈 Technical Analysis
QQQ ran the weekly swing low at the 687 level and was rejected there. SPY retested the 637 zone, which is the range low for me, and reacted perfectly with a strong bounce. At the moment, price is showing clear upward momentum, suggesting that a stronger move may develop into the afternoon session. NVDA and AAPL are currently leading the market higher.
📌 Game Plan
Bullish Scenario: I bought calls and I’m targeting a minimum of 673.5. My second target is 681 for a runner. Once price reaches 673.5, I will move my stops to break-even.
Bearish Scenario: If price gets rejected at the 671 level, I will exit my calls and switch to puts, targeting the 661 zone.
💬For detailed insights and broader market context, please check my Substack link in profile.
⚠️ For educational purposes only. This is not financial advice.
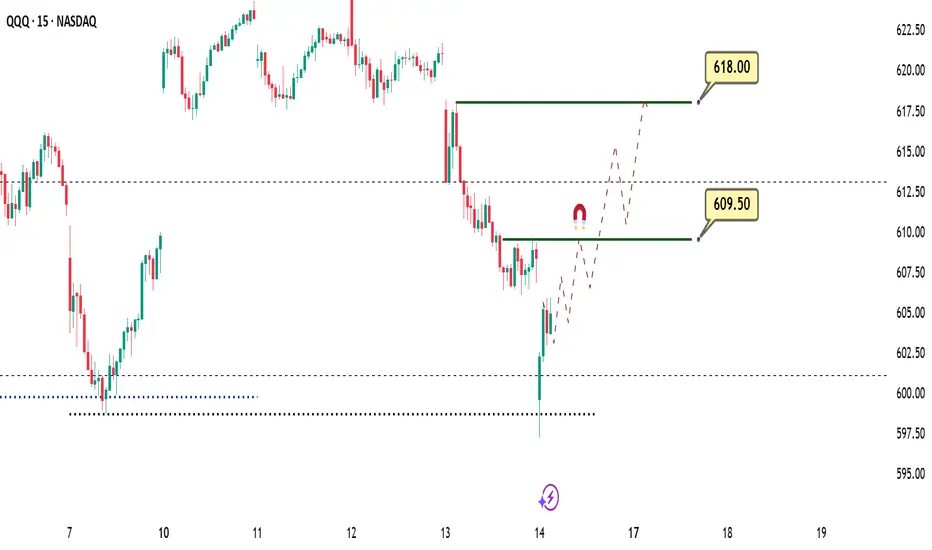
Daily QQQ (US100-NQ) Outlook - Prediction (14 NOV)Daily QQQ (US100-NQ) Outlook - Prediction (14 NOV)
📊 Market Sentiment
Market sentiment appears neutral, in my opinion. The U.S. government is expected to reopen soon; however, officials have decided not to release previous economic data. This creates uncertainty for traders without key data, it becomes difficult to anticipate the FED’s next policy decisions.
📈 Technical Analysis
QQQ tapped the weekly swing low at 687 and was rejected from that level. SPY retested the 637 zone, which is the range low for me, and reacted with a strong bounce. At the moment, price is showing clear upward momentum, suggesting that a stronger move may develop into the afternoon session. NVDA and AAPL are currently leading the market higher.
📌 Game Plan
I bought calls around 601, and I expect to see 609.5 first, and if we get a strong continuation, possibly the 618 level.
At 609.5, I will close half of my position, trail my stop-loss to breakeven, and target 618 for the remainder.
💬For detailed insights and broader market context, please check my Substack link in profile.
⚠️ For educational purposes only. This is not financial advice.
SP500 Santa Claus rally - just backwardsIt is time to short the waaaaay needed correction on the stock market.

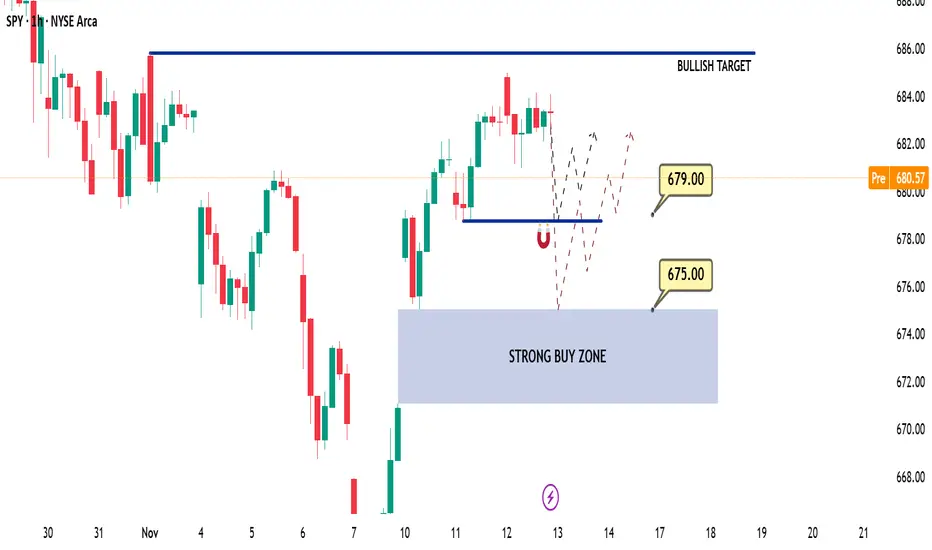
Daily SPY (US500-SPX) Outlook - Prediction (13 NOV)Daily SPY (US500-SPX) Outlook - Prediction (13 NOV)
📊 Market Sentiment
Market sentiment appears neutral, in my opinion. The U.S. government is expected to reopen soon; however, officials have decided not to release previous economic data. This adds uncertainty for traders without data, it becomes difficult to gauge the FED’s next policy decision.
📈 Technical Analysis
SPY experienced a range-bound session yesterday, consolidating between 680 and 685. On higher timeframes, price action still suggests a desire to expand higher, but momentum has temporarily slowed.
📌 Game Plan
In my opinion, the market may show slight bearish pressure early in the session, followed by a moderate bullish bounce.
Scenario 1: SPY may drop to 679 and bounce from there, returning to the 682–685 range.
Scenario 2: If SPY breaks 679 aggressively, I expect a retracement toward 675. At that level, I plan to load calls for a potential bullish move.
💬 For detailed insights and broader market context, please check my Substack link in profile.
⚠️ For educational purposes only. This is not financial advice.
Daily QQQ (US100-NQ) Outlook - Prediction (13 NOV)Daily QQQ (US100-NQ) Outlook - Prediction (13 NOV)
📊 Market Sentiment
Market sentiment appears neutral, in my opinion. The U.S. government is expected to reopen soon; however, officials have decided not to release previous economic data. This creates uncertainty for traders without key data, it becomes difficult to anticipate the FED’s next policy decision.
📈 Technical Analysis
QQQ experienced a range-bound session yesterday, while the Dow Jones carried most of the market’s momentum. Compared to SPY, QQQ showed more weakness throughout the session. However, the higher-timeframe structure remains bullish, and I will continue following that bias.
📌 Game Plan
Scenario 1: Price may dip to the 616–617 zone and bounce from there, returning to the 621–623 range.
Scenario 2: If price breaks 617 aggressively, it may retrace toward 613 before bouncing back into the 620–625 zone.
In my opinion, calls may work better on SPY today, while puts could perform better on QQQ.
💬 For detailed insights and broader market context, please check my Substack link in profile.
⚠️ For educational purposes only. This is not financial advice.

S&P500 (US500): Important Breakout & Bullish Continuation
US500 likely completely a correctional movement,
breaking a resistance line of a bullish flag pattern on a 4H time frame.
I think that a bullish wave is going to start soon
and the market will reach at least to 6917 level.
❤️Please, support my work with like, thank you!❤️
I am part of Trade Nation's Influencer program and receive a monthly fee for using their TradingView charts in my analysis.

SPX500 TIME TO BUY NOWSPX500 is in a clear upwards channel and has broken the last bit of resistance (white line shown) - this is a clear confirmation that the next target will be the next resistance zone to the upside shown above (this is a great buy trade opportunity) - Time to buy!

ES Buy Signal Supply-Demand And Support ResistanceSee picture for analysis
Seasonality = bullish
Fundamnetals = bullish
Sentiment = mixed
Technicals = long-term bullish/ short-term choppy
Price created 1timeframe demand level reacting
off of support.
Demand can also be used as HTF and wait for LTF confirmation.
Odds of full TP hit maybe around 28-32%

Bullish continuation in play?S&P500 (US500) has bounced off the pivot and could potentially rise to the 1st resistance.
Pivot: 6,827.13
1st Support: 6,745.48
1st Resistance: 7,006.51
Disclaimer:
The opinions given above constitute general market commentary and do not constitute the opinion or advice of IC Markets or any form of personal or investment advice.
Any opinions, news, research, analyses, prices, other information, or links to third-party sites contained on this website are provided on an "as-is" basis, are intended to be informative only, and are not advice, a recommendation, research, a record of our trading prices, an offer of, or solicitation for, a transaction in any financial instrument and thus should not be treated as such. The information provided does not involve any specific investment objectives, financial situation, or needs of any specific person who may receive it. Please be aware that past performance is not a reliable indicator of future performance and/or results. Past performance or forward-looking scenarios based upon the reasonable beliefs of the third-party provider are not a guarantee of future performance. Actual results may differ materially from those anticipated in forward-looking or past performance statements. IC Markets makes no representation or warranty and assumes no liability as to the accuracy or completeness of the information provided, nor any loss arising from any investment based on a recommendation, forecast, or any information supplied by any third party.

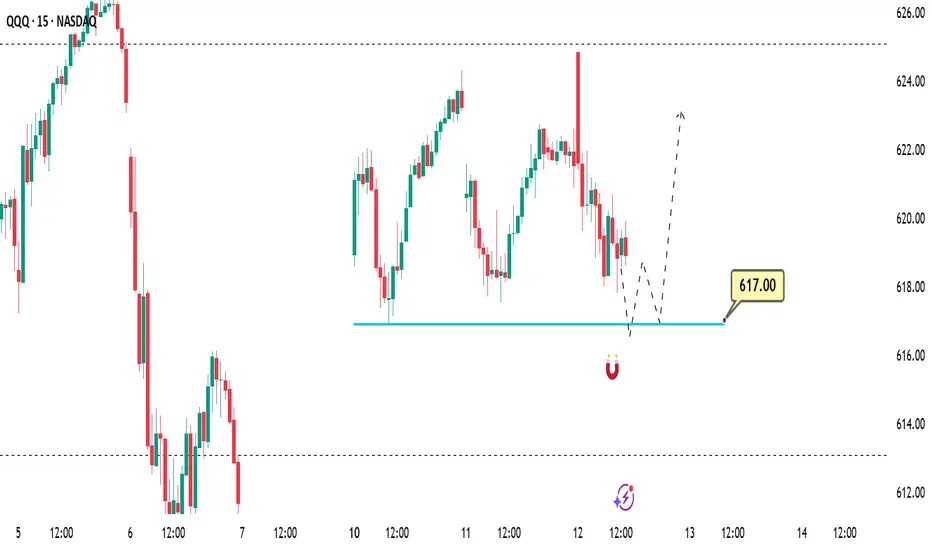
QQQ (NQ/US100) Quick Trade Idea - (12 NOV)📌 Prediction / Game Plan
In my opinion, the price is currently attempting to reprice the gap around the 617 level.
If the price reaches this zone, we may see a rejection-bounce toward 620 first, followed by 625.
I’ll be closely watching the 617 zone for a potential call entry setup.
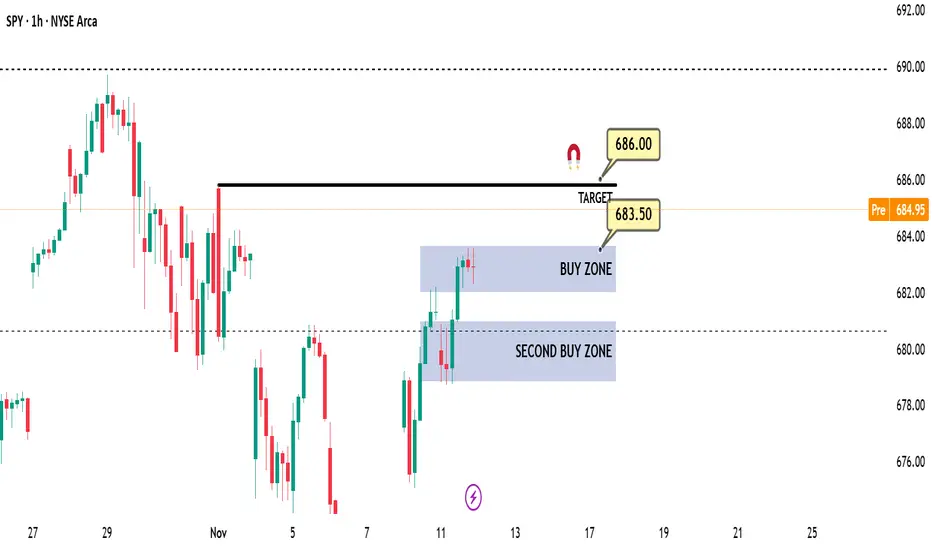
Daily SPY (US500) Outlook - Prediction (12 NOV)Daily SPY (US500) Outlook - Prediction (12 NOV)
📊 Market Sentiment
The market continues to lean bullish following the potential resolution of the U.S. government shutdown, along with the proposed $2,000 incentives for U.S. citizens. These developments could drive stronger inflows into equities and sustain short-term positive sentiment.
📈 Technical Analysis
Price moved higher overnight, likely targeting the 686 level, supported by strong momentum carried over from the Dow Jones (US30).
📌 Game Plan
In my opinion, I will look to buy if the price retraces to the 683.5–682 zone for a potential continuation move toward 686.
However, if we see a strong breakout below 682 and a 4H candle close beneath that level, I plan to exit my position. Another possible bounce could occur around 681, but confirmation would be required before entering such a trade.
💬For detailed insights and broader market context, please check my Substack link in profile.
⚠️ For educational purposes only. This is not financial advice.
S&P500 New Bullish Leg confirmed targeting 7150.The S&P500 index (SPX) offered us, as we mentioned on our last analysis, an excellent buy opportunity last Friday as it hit its 1D MA50 (blue trend-line) and bounced.
Having broken and closed yesterday above its 4H MA50 (red trend-line), it has technically confirmed the new Bullish Leg of the 6-month Channel Up. Based on all previous ones, it should target the 2.5 Fibonacci extension at 7150, which remains our long-term Target for the end of the year.
Notice also how similar the 1D RSI patterns are of October and August. Steady rise is expected for November getting into December.
---
** Please LIKE 👍, FOLLOW ✅, SHARE 🙌 and COMMENT ✍ if you enjoy this idea! Also share your ideas and charts in the comments section below! This is best way to keep it relevant, support us, keep the content here free and allow the idea to reach as many people as possible. **
---
💸💸💸💸💸💸
👇 👇 👇 👇 👇 👇

S&P500 Positive sentiment from tech reboundOverview:
Wall Street rallied strongly yesterday, led by tech stocks. The NASDAQ gained +2.27%, and the Magnificent 7 surged +2.79%, with Nvidia (+5.79%) leading after its biggest jump since April. Broader gains were more moderate — the equal-weight S&P 500 rose +0.52%, and Russell 2000 +0.94% — showing the rally was concentrated in large-cap tech.
Drivers of Sentiment:
Tech rebound: Nvidia’s recovery and strong performance in other mega-caps fueled optimism.
Trade optimism: Trump said the US is “pretty close” to trade deals with India and Switzerland, potentially reducing tariffs.
Political progress: The US government funding deal advanced in the Senate, easing shutdown concerns.
Market Takeaway for Today:
S&P 500 likely to open steady to slightly higher, supported by risk-on momentum from tech.
Focus on whether the rally broadens beyond mega-caps — equal-weight S&P lagging suggests narrow leadership.
Short-term tone: Positive sentiment from tech rebound, trade deal hopes, and easing US political risk, but watch for consolidation after strong gains.
Key Support and Resistance Levels
Resistance Level 1: 6866
Resistance Level 2: 6889
Resistance Level 3: 6917
Support Level 1: 6763
Support Level 2: 6736
Support Level 3: 6700
This communication is for informational purposes only and should not be viewed as any form of recommendation as to a particular course of action or as investment advice. It is not intended as an offer or solicitation for the purchase or sale of any financial instrument or as an official confirmation of any transaction. Opinions, estimates and assumptions expressed herein are made as of the date of this communication and are subject to change without notice. This communication has been prepared based upon information, including market prices, data and other information, believed to be reliable; however, Trade Nation does not warrant its completeness or accuracy. All market prices and market data contained in or attached to this communication are indicative and subject to change without notice.
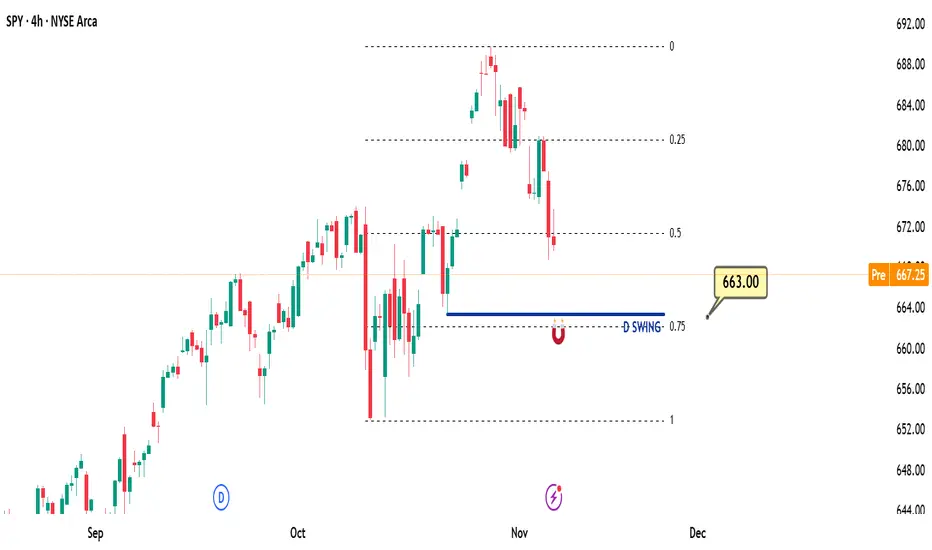
Weekly SPY (US500) Outlook - Prediction (09 NOV)Weekly SPY Outlook - Prediction (09 NOV)
📊 Market Sentiment
Market sentiment remains slightly bearish as expectations for a December rate cut may be pushed into 2026. We have seen some sell-offs, likely due to hedging or profit-taking activity. However, the market experienced a healthy bounce last Friday, as anticipated in my previous Daily SPY Outlook on November 7.
Today, Trump announced that American citizens, excluding high-income individuals, will receive a $2,000 payment. This news could inject additional liquidity into risk assets, similar to what occurred during his first term. In my opinion, this development may create a short-term bullish narrative for the markets.
📈 Technical Analysis
Price retraced throughout the week and reached the 663 level, where it bounced as expected from my November 7 outlook. The 663 zone represents the most discounted range (based on my quarterly range theory, 0.75 fib level), which I consider an optimal buy area. This level also coincides with daily swing liquidity, and the reaction suggests a potential move toward new all-time highs.
📌 Game Plan
I’m considering two possible scenarios for this week:
Scenario 1 (Black Line):
In my opinion, the price now has enough momentum to extend higher and create new all-time highs. Therefore, I’ll be watching for a daily close above the 671 level. If confirmed, I plan to buy SPY calls targeting new highs.
Scenario 2 (Red Line):
If the price fails to close above 671, it may indicate that more accumulation is needed before another upward move. In that case, I’ll look to short (buy puts) toward the 657 level and observe whether we can bounce from there. Should that happen, I’ll then switch to calls and target higher levels.
💬For detailed insights and broader market context, please check my Substack link in profile.
⚠️ For educational purposes only. This is not financial advice.

Daily SPY (US500) Outlook - Prediction (10 NOV)📊 Market Sentiment
Market sentiment remains slightly bearish as expectations for a December rate cut may be postponed into 2026. We have seen some sell-offs, likely due to hedging or profit-taking activity. However, the market experienced a healthy bounce last Friday, as anticipated in my previous Daily SPY Outlook on November 7.
Trump announced that American citizens, excluding high-income individuals, will receive a $2,000 payment. This news could inject additional liquidity into risk assets, similar to what occurred during his first term. In my opinion, this may create a short-term bullish narrative for the markets.
📈 Technical Analysis
The ES market is showing strong pre-market inflows. I think the price may continue seeking higher levels, possibly targeting the 681 zone today.
📌 Game Plan
In my opinion, calls may perform well today. I plan to buy at the market open and take profits around the 681 level.
💬For detailed insights and broader market context, please check my Substack link in profile.
⚠️ For educational purposes only. This is not financial advice.

Daily SPY Outlook - Prediction (07 NOV)Daily SPY Outlook - Prediction (07 NOV)
📊 Market Sentiment
Market sentiment is slightly bearish as expectations for a December rate cut may be delayed into 2026. We have seen some sell-offs, likely due to hedging or profit-taking activity.
📈 Technical Analysis
Price is currently pulling back from the all-time high and moving within the equilibrium zone near the 670 level, which acts as short-term support. This is where I think accumulation may occur.
📌 Game Plan
In my opinion, price could reach the 663 level before showing a potential rebound. Therefore, I plan to stay short-biased toward 663, as puts might perform well today — unless I see a strong 4H candle close after the market open.
💬For detailed insights and broader market context, please check my Substack link in profile.
⚠️ Disclaimer: For educational purposes only. This is not financial advice.
S&P 500: Multiple Bearish Signals AlignS&P 500 index chart shows multiple bearish signals on the weekly time frame
1. The price has hit the upside of the long-term uptrend and it was rejected
2. Bearish Reversal Evening Star Candlestick pattern appeared on the top
3. RSI has built the Bearish Divergence as it did not confirm the new peak
There are 3 support levels:
1. Double support of trend channel's mid-line and previous top around $6,147
2. Bottom of the channel between $5,300 and $5,400
3. "Die-hard" multiple support that was built since 2021 around $4,819
What are your thoughts?

S&P500 resilient US data reignited riskRisk appetite returned to markets over the last 24 hours, with the S&P 500 rising +0.37% as stronger US data and optimism over a potential end to the government shutdown lifted sentiment.
The ADP private payrolls report surprised to the upside at +42k (vs. +30k expected), while the ISM Services index jumped to 52.4 (vs. 50.8 expected) with new orders at a 12-month high, easing fears of an economic slowdown after Monday’s weak manufacturing data.
The improved tone triggered a broad risk-on rally:
US HY spreads tightened (-9bps) for the first time in a week.
Bitcoin rebounded (+3.38%) after recent losses.
Asian equities followed through overnight, with the Nikkei up +1.48% and Hang Seng +1.61%.
Despite solid data, Treasuries rallied as markets priced a higher chance of a December Fed rate cut, sending the USD to its biggest 3-week drop.
In corporate news, SpaceX agreed to buy EchoStar’s AWS-3 spectrum licenses for $2.6bn in stock, while EchoStar booked a $16.5bn non-cash charge tied to its 5G network wind-down.
However, some valuation concerns are re-emerging — the “Buffett Indicator” now shows US equities worth over twice GDP, with total market cap around $72tn, underscoring stretched levels after a +36% rally since April lows.
Bottom line: The S&P 500 regained momentum as resilient US data reignited risk appetite and rate-cut hopes, though extended valuations remain a potential headwind.
This communication is for informational purposes only and should not be viewed as any form of recommendation as to a particular course of action or as investment advice. It is not intended as an offer or solicitation for the purchase or sale of any financial instrument or as an official confirmation of any transaction. Opinions, estimates and assumptions expressed herein are made as of the date of this communication and are subject to change without notice. This communication has been prepared based upon information, including market prices, data and other information, believed to be reliable; however, Trade Nation does not warrant its completeness or accuracy. All market prices and market data contained in or attached to this communication are indicative and subject to change without notice.

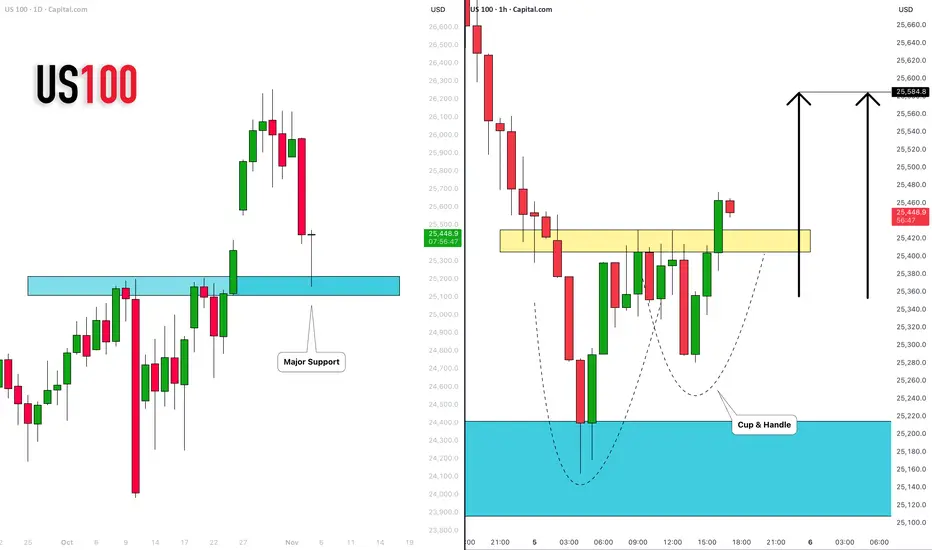
NASDAQ INDEX (US100): Time to Recover
US100 index dropped yesterday, as I predicted.
The market is recovering now, after a test of a major daily support cluster.
A formation of a cup & handle pattern on that and a breakout of its neckline
indicate a strong buying pressure.
With a high probability, the market will rise and reach 25580 level soon.
❤️Please, support my work with like, thank you!❤️
I am part of Trade Nation's Influencer program and receive a monthly fee for using their TradingView charts in my analysis.
S&P500 Possibly the last buy signal before Bull Cycle ends.The S&P500 index (SPX) has been trading within a 5-month Channel Up and is currently about to complete its latest Bearish Leg. All such pull-back sequences have reached at least the 4H MA200 (orange trend-line) before rebounding and kick-starting the next Bullish Leg, with the 1D MA50 (red trend-line) providing the ultimate Support of this pattern.
As a result, especially since the 4H RSI also hit the 30.00 oversold barrier, we expect the index to initiate the new Bullish Leg and aim for a Higher High near the 2.5 Fibonacci extension. Our Target is 7150.
-------------------------------------------------------------------------------
** Please LIKE 👍, FOLLOW ✅, SHARE 🙌 and COMMENT ✍ if you enjoy this idea! Also share your ideas and charts in the comments section below! This is best way to keep it relevant, support us, keep the content here free and allow the idea to reach as many people as possible. **
-------------------------------------------------------------------------------
💸💸💸💸💸💸
👇 👇 👇 👇 👇 👇

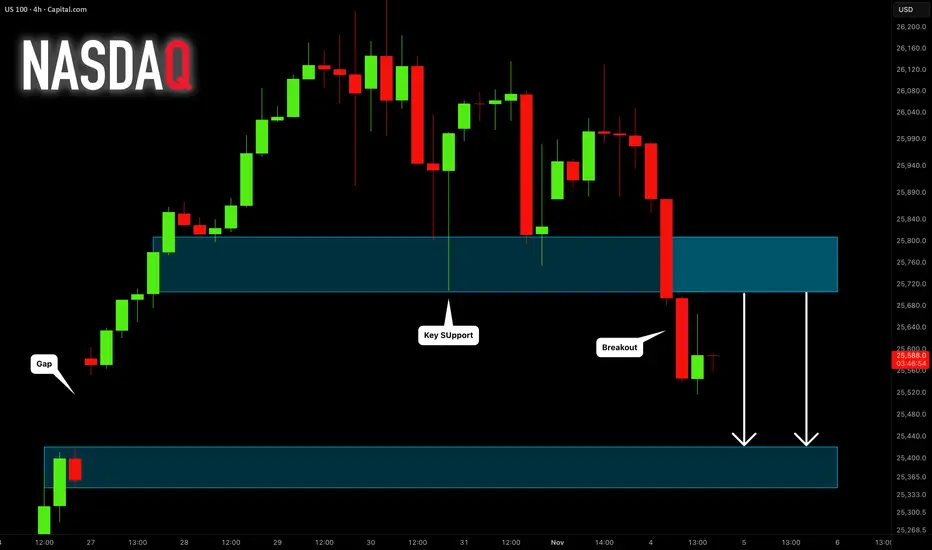
NASDAQ INDEX (US100): Forgotten Gap
A week ago, US100 formed a gap up opening.
It looks like the index is finally ready to fill it.
A breakout of a major horizontal support is a strong bearish signal.
Expect a bearish continuation to 25420.
❤️Please, support my work with like, thank you!❤️
I am part of Trade Nation's Influencer program and receive a monthly fee for using their TradingView charts in my analysis.