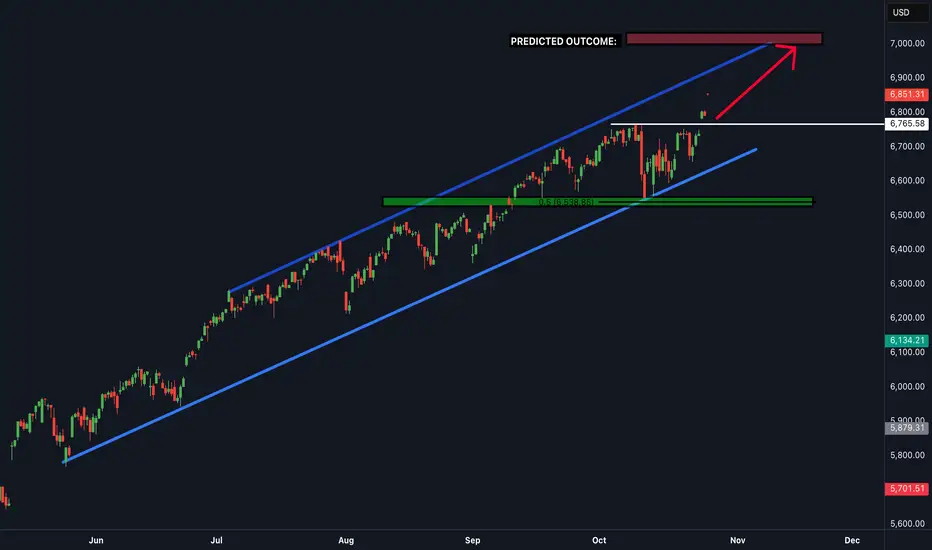
SPX - clear bullish signs ahead..SPX Has recently tested major support levels but struggled to break through below and bounced back up to the upside. The price also broke through the resistance trendline to the upside which is a major clear sign that SPX will be hitting the next upward target (fibonacci extension) shown on the chart
Us500

META Buy Opportunity – KZDZ ModelMETA Game Plan – KZDZ Model
📊 Market Sentiment
On 29/10, the FED lowered rates by 25BPS, as expected. However, Powell’s remarks added uncertainty around further cuts in December, stating that future decisions will be data-dependent.
One FED member dissented, preferring no cut this cycle — a notable shift from September’s unanimous decision.
Following this, rate-cut expectations dropped from 95% to 68%, sparking short-term bearish sentiment as traders took profits and hedged exposure.
Despite this volatility, the mid-to-long term outlook remains bullish given the broader liquidity cycle and easing policy stance.
📈 Fundamental
META earnings missed expectations, triggering a sharp sell-off. While short-term sentiment is bearish, the long-term outlook remains supported by ongoing AI development initiatives.
📈 Technical Analysis
1-Hit oversold RSI on the daily timeframe.
2-Retraced to the 0.5 Fibonacci equilibrium zone (≈ $640).
3-Tested a major HTF Key Zone around $625, signaling potential accumulation.
📘 Model in Use – Key Zone with Discount Zone (KZDZ Model)
The KZDZ Model identifies areas where discounted Fibonacci levels align with strong HTF liquidity zones, offering high-probability reversal opportunities.
1️⃣ Identify HTF Key Zone
2️⃣ Align with Discount Zone (0.5–0.75 range)
3️⃣ Look for confirmation structure on LTF
4️⃣ Execute and manage risk accordingly
📌 Game Plan
Scenario 1 (Black Path): Watch for price to hit $625 and close above $640 (daily). Upon confirmation, plan to buy C640 options targeting $680–$700.
Scenario 2 (Red Path): If price fails to reclaim $640, monitor for a deeper move to $560, then look for weekly rejection above that zone. Entry via C560 options, targeting $620–$700.
🎯 Setup Trigger
Scenario 1 → Daily close above $640 after retesting $625.
Scenario 2 → Weekly close above $560 zone.
📋 Trade Management
Scenario 1: Buy C640 Calls → take profits at $680–$700.
Scenario 2: Buy C560 Calls → partial profits $620–$640, rest at $680–$700.
Move stop to breakeven after first target is hit.
💬If this META breakdown supports your outlook, like, comment, and follow.
For deeper sentiment and strategy updates, subscribe to my Substack free access available.
⚠️ This analysis is for educational purposes only and does not constitute financial advice. Always conduct your own research before trading or investing.

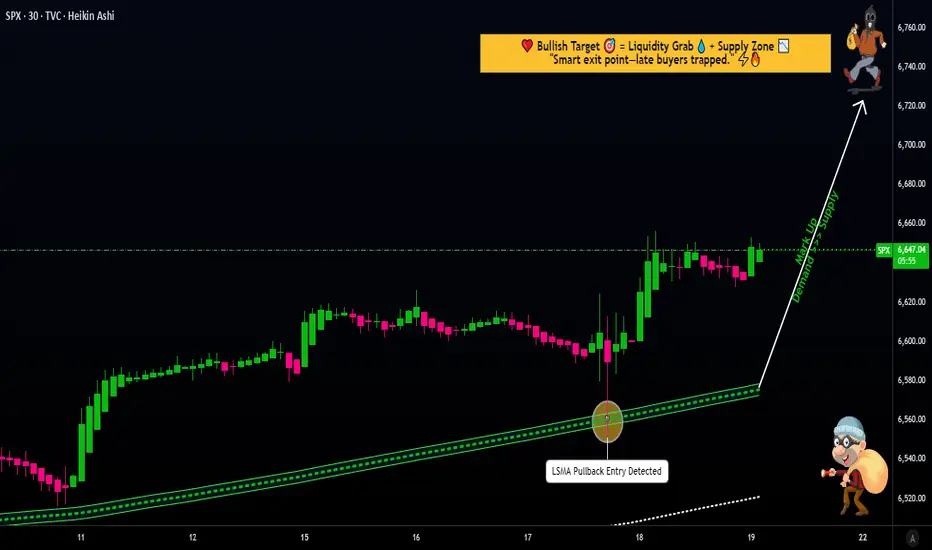
SPX500 Trading Strategy Explained: From Entry to Exit⚡ SPX500 “STANDARD & POOR” Indices Market Wealth Strategy Map ⚡
(Swing / Day Trade Plan – Thief OG Style)
🧭 Plan
📈 Bias: Bullish confirmed with 30m LSMA pullback + 0.786 Fibonacci-based MA confluence.
💡 Entry Approach (Thief Layering Strategy™):
Instead of one-shot entry, I place multiple buy-limit layers to average into strength. Example setup:
Buy limit: 6600
Buy limit: 6620
Buy limit: 6640
👉 You can extend or adjust the layering based on your own strategy.
🎯 Stop Loss (SL)
This is my Thief SL @6560.
⚠️ Note to Ladies & Gentlemen (Thief OG’s): This SL is not a recommendation. Use your own judgment — protect your loot at your own risk.
💰 Target (TP)
📌 6750 — sitting at strong resistance + overbought zone + possible bull-trap.
⚠️ Again, OG’s — this is not financial advice. Take profit when it fits your plan. Secure the bag, then enjoy the loot!
🔍 Related Pairs to Watch
Keep an eye on these correlated assets to confirm the SPX500’s move:
NASDAQ:NDX (Nasdaq 100): Tech-heavy index with strong correlation to SPX500. If tech stocks are pumping, it’s a bullish signal for our trade. 📊
TVC:DXY (US Dollar Index): A weaker dollar often boosts equities. Watch for inverse correlation—DXY dropping could mean SPX500 is ready to fly! 🚀
TVC:VIX (Volatility Index): Low VIX levels signal market calm, supporting our bullish setup. A spike in VIX could warn of trouble, so stay sharp! ⚡
Key Correlation Insight: SPX500 often moves in tandem with NASDAQ:NDX due to shared tech giants (think Apple, Microsoft). If NASDAQ:NDX is rallying, it’s a tailwind for our trade. Conversely, a rising TVC:DXY or TVC:VIX could signal caution.
📝 Thief Note
Dear Ladies & Gentlemen (Thief OG’s):
This map is my personal swing/day trade playbook — not a fixed recommendation. Layer entries, cut losers fast, and loot when you can. Market moves are wild; manage risk like a true OG.
✨ “If you find value in my analysis, a 👍 and 🚀 boost is much appreciated — it helps me share more setups with the community!”
⚠️ Disclaimer: This is a Thief-style trading strategy shared just for fun & educational vibes. Not financial advice. DYOR & trade responsibly.
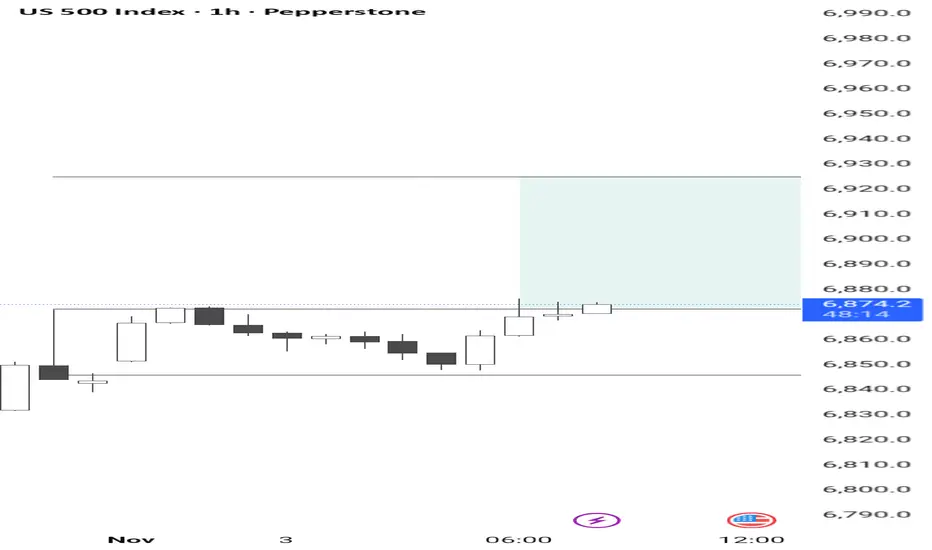
S&P 500 INDEX | Institutional Technical Analysis Masterpiece🔥 US500 S&P 500 INDEX | Institutional Technical Analysis Masterpiece | 6,843.7 🔥
📈 ELITE MULTI-TIMEFRAME BREAKDOWN | NOVEMBER 3-7, 2025 TRADING ROADMAP 📈
Current Level: 6,843.7 | Analysis Date: November 1, 2025, 00:54 UTC+4
Hello, TradingView community! 👋 The S&P 500 has been on an absolute tear, closing the week at a staggering 6,843.7 . The big question on everyone's mind is: Are we witnessing a final euphoric push before a correction, or is this simply a pause before the next leg up? This week, from November 3rd to 7th, will be critical.
Let's break down the multi-timeframe picture, blending classic theories with modern indicators to build a comprehensive trading plan for both intraday and swing traders. 🧠
═══════════════════════════════════════════════════════════════════
🎯 MARKET INTELLIGENCE EXECUTIVE SUMMARY
The S&P 500 stands at 6,843.7 , navigating a historic technical confluence zone that will determine the market's trajectory through year-end 2025. Our algorithmic and classical analysis fusion reveals bullish continuation potential with measured risk parameters. This week presents asymmetric opportunities as institutional positioning, technical patterns, and macro catalysts align for potentially explosive moves.
Critical Support Infrastructure: 🛡️
Immediate Floor: 6,820 - 6,830 (Algorithmic bid zone)
Secondary Base: 6,800 - 6,810 (Institutional accumulation)
Major Support: 6,750 - 6,770 (Weekly pivot nexus)
Ultimate Defense: 6,700 - 6,720 (Psychological fortress)
Resistance & Target Architecture: 🎯
First Ceiling: 6,860 - 6,870 (Intraday supply)
Secondary Wall: 6,900 - 6,910 (Round number magnet)
Breakout Zone: 6,950 - 6,970 (Pattern objective)
Major Extension: 7,000 - 7,020 (Psychological milestone)
═══════════════════════════════════════════════════════════════════
📊 WEEKLY TIMEFRAME (1W) - MACRO MARKET STRUCTURE
Elliott Wave Grand Architecture: 🌊
We're positioned in Minor Wave 3 of Intermediate Wave (5) within the secular bull market. The impulsive structure projects targets at 7,100-7,200 based on Fibonacci extensions. Critical validation: maintaining above 6,720 preserves the bullish count.
Primary Count: Wave 3 of (5) targeting 7,100
Alternative: Wave B of expanded flat, risk below 6,650
Invalidation: Weekly close below 6,600
Time projection: Completion by late November
Wyckoff Accumulation Schematic: 📚
Phase D - Markup Beginning
- Preliminary Supply (PSY): 6,920 tested
- Buying Climax (BC): 6,950 rejection
- Automatic Reaction (AR): 6,750 hold
- Last Point of Support (LPS): Current 6,843
- Sign of Strength (SOS): Pending above 6,870
Ichimoku Cloud Mastery: ☁️
Tenkan-sen: 6,815 (9-period support)
Kijun-sen: 6,780 (26-period base)
Senkou A: 6,850 (cloud top resistance)
Senkou B: 6,720 (cloud bottom support)
Chikou Span: Clear above price (bullish)
Cloud status: Thick and ascending
Advanced Harmonic Patterns: 🦋
Developing Bullish Gartley with precision ratios:
- XA leg: 6,500 to 6,950 (450 points)
- AB retracement: 0.618 at 6,672 ✅
- BC extension: Testing 0.786 at 6,845 (current)
- D completion: 0.786 XA at 6,850-6,870
- Target upon completion: 7,050-7,100
═══════════════════════════════════════════════════════════════════
📉 DAILY TIMEFRAME (1D) - SWING TRADING COMMAND CENTER
Japanese Candlestick Mastery: 🕯️
Yesterday's Doji Star at resistance signals equilibrium. Today's action critical:
- Close above 6,860 = Three White Soldiers continuation
- Close below 6,820 = Evening Star reversal warning
- Current bias: Neutral-bullish pending confirmation
Master Pattern Recognition:
Cup and Handle formation nearing completion:
- Cup low: 6,650 (October)
- Cup high: 6,920 (Recent peak)
- Handle forming: 6,820-6,870 range
- Breakout target: 7,190 (270-point measured move)
- Volume requirement: 25% above 20-day average
Bollinger Bands Configuration: 📊
Upper Band: 6,875 (immediate resistance)
Middle Band (20-SMA): 6,810 (dynamic support)
Lower Band: 6,745 (oversold boundary)
Band Width: Expanding (volatility increasing)
%B Indicator: 0.68 (upper half, bullish bias)
RSI Multi-Timeframe Analysis:
Daily RSI: 59 (room for upside)
Hidden bullish divergence vs price action
Support trend line from September intact
Resistance at 70 provides 11-point runway
═══════════════════════════════════════════════════════════════════
⚡ 4-HOUR TIMEFRAME (4H) - TACTICAL EXECUTION FRAMEWORK
Gann Theory Application: 📐
Current Gann Angles:
1x1: 6,825 (45-degree support)
2x1: 6,850 (current resistance)
1x2: 6,790 (major support)
Square of 9: 6,889 (next target)
Gann Box: 6,750-6,950 range
Time cycles: Nov 5 critical date
Dow Theory Confirmation Checklist: ✅
Primary Trend: Bullish (new highs achieved)
Secondary Trend: Consolidation/Correction
Volume Confirmation: Accumulation on dips
Breadth Analysis: 65% stocks above 50-DMA
Sector Rotation: Technology leading (bullish)
Transportation Confirmation: Pending
Moving Average Symphony:
- EMA 8: 6,838 (ultra-short support)
- EMA 21: 6,825 (short-term support)
- EMA 50: 6,810 (medium support)
- SMA 100: 6,785 (strong support)
- SMA 200: 6,750 (major trend support)
Pattern Alert: 🚨
Ascending Triangle resolution imminent:
- Horizontal resistance: 6,860-6,870
- Rising support: 6,820-6,830
- Apex convergence: November 4
- Breakout projection: 6,950+
═══════════════════════════════════════════════════════════════════
🎪 1-HOUR TIMEFRAME (1H) - PRECISION TRADING LABORATORY
Micro Pattern Development: 🔬
Double Bottom forming at 6,825:
- First bottom: 6,823 (10:00 UTC)
- Second bottom: 6,826 (14:00 UTC)
- Neckline resistance: 6,855
- Pattern target: 6,885 (30-point move)
VWAP Trading Matrix:
Daily VWAP: 6,841
Weekly VWAP: 6,825
Monthly VWAP: 6,795
Upper Band 1: 6,858 (first resistance)
Upper Band 2: 6,875 (second resistance)
Lower Band 1: 6,824 (first support)
Lower Band 2: 6,807 (second support)
Support & Resistance Precision Grid:
R4: 6,890 (Major resistance)
R3: 6,875 (Daily upper BB)
R2: 6,860 (Pattern neckline)
R1: 6,850 (Immediate resistance)
PIVOT: 6,843.7 (Current Price)
S1: 6,835 (Micro support)
S2: 6,825 (VWAP support)
S3: 6,810 (Major support)
S4: 6,795 (Monthly VWAP)
═══════════════════════════════════════════════════════════════════
⚡ 30-MINUTE TIMEFRAME (30M) - SCALPING COMMAND POST
Microstructure Analysis: 🎯
Bull Flag pattern developing:
- Pole: 6,810 to 6,855 (45 points)
- Flag consolidation: 6,835-6,845
- Breakout trigger: 6,846
- Target: 6,890 (45-point measured move)
Volume Profile Intelligence: 📊
POC (Point of Control): 6,837
VAH (Value Area High): 6,848
VAL (Value Area Low): 6,828
HVN (High Volume Node): 6,835-6,840
LVN (Low Volume Node): 6,855-6,860 (breakout zone)
Scalping Execution Zones:
Buy Zones:
• Zone 1: 6,835-6,838 (POC test)
• Zone 2: 6,828-6,831 (VAL support)
• Zone 3: 6,820-6,823 (Strong bid)
Sell Zones:
• Zone 1: 6,848-6,851 (VAH resistance)
• Zone 2: 6,858-6,861 (Supply zone)
• Zone 3: 6,868-6,871 (Major resistance)
═══════════════════════════════════════════════════════════════════
🏃 15-MINUTE & 5-MINUTE HYPERSPEED SCALPING
15-Minute Lightning Analysis: ⚡
Wedge pattern near apex:
- Upper trendline: 6,847
- Lower trendline: 6,839
- Breakout direction: 70% probability upward
- Quick target: 6,855 (+12 points)
- Stop: 6,835 (-8 points)
5-Minute Algorithmic Signals:
Long Entry Conditions:
RSI(5) < 30 AND Price > VWAP = BUY
MACD crossover AND Volume > Average = BUY
Price touches EMA(20) from above = BUY
Short Entry Conditions:
RSI(5) > 70 AND Price < VWAP = SELL
MACD crossunder AND High volume = SELL
Price rejected at resistance = SELL
Exit Rules:
Take profit: 8-10 points
Stop loss: 5-6 points
Time stop: 15 minutes max hold
Session Volatility Map: 🕐
Asian: 10-15 point range (quiet)
London Open: 20-30 point expansion
NY Premarket: 25-35 point volatility
NY Open: 40-50 point moves
NY Afternoon: 20-30 point consolidation
═══════════════════════════════════════════════════════════════════
📅 WEEKLY STRATEGIC FORECAST (NOVEMBER 3-7, 2025)
Monday, November 3: 🚀
Opening gap probability: 60% bullish
Strategy: Buy weakness to 6,830, target 6,870
Key levels: Support 6,820, Resistance 6,880
Expected range: 50 points
Tuesday, November 4: 🗳️
Election Day - Extreme volatility expected
Strategy: Straddle/strangle positions
Potential range: 6,750-6,920 (170 points!)
VIX spike likely above 25
Wednesday, November 5: 💥
Post-election directional resolution
Strategy: Trade the breakout aggressively
Bullish above 6,880 → Target 6,950
Bearish below 6,800 → Target 6,720
Thursday, November 6: 📊
FOMC minutes and economic data
Strategy: Fade first move, trade reversal
Expected consolidation: 6,850-6,900
Options gamma concentration: 6,875
Friday, November 7: 🎯
Weekly options expiration dynamics
Strategy: Theta decay trades around 6,850
Pin risk: 6,850 strike concentration
Weekly close above 6,870 = Bullish next week
═══════════════════════════════════════════════════════════════════
⚖️ INSTITUTIONAL RISK MANAGEMENT PROTOCOLS
Intraday Risk Framework: 🛡️
Position sizing: 0.5-1% risk per trade
Risk-Reward: Minimum 1:2.5 ratio
Daily loss limit: -2% portfolio max
Consecutive losses: 3 max, then pause
Profit trailing: 60% of maximum gain
Breakeven stop: At 10-point profit
Scaling strategy: 3 entries maximum
Swing Position Architecture: 💼
Core position: 50% at 6,820-6,830
Add-on levels: 25% at 6,800, 25% at 6,780
Stop loss: Below 6,750 (all positions)
Target 1: 6,900 (25% exit)
Target 2: 6,950 (35% exit)
Target 3: 7,000 (25% exit)
Runner: 7,050+ (15% hold)
═══════════════════════════════════════════════════════════════════
🔴 RISK SCENARIOS & CIRCUIT BREAKERS
Bearish Invalidation Levels: 🐻
15-min close below 6,835 = Micro caution
Hourly close below 6,820 = Intraday bearish
4H close below 6,800 = Swing bearish shift
Daily close below 6,750 = Trend reversal risk
Weekly close below 6,700 = Major bear signal
Tail Risk Considerations: 🦢
• Geopolitical shock (100+ point gap risk)
• Fed policy surprise (2-3% moves)
• Tech earnings disasters (sector rotation)
• Credit event contagion (systemic risk)
• AI bubble concerns (valuation reset)
═══════════════════════════════════════════════════════════════════
💎 ELITE CONFLUENCE TRADING ZONES
Premium Buy Zone: ✅
6,820-6,830
(Multi-timeframe support + Fibonacci 61.8% + VWAP + Moving average cluster)
Optimal Sell Zone: ❌
6,870-6,880
(Resistance confluence + Pattern targets + Round number + Options barrier)
Breakout Trigger: 🚀
6,870-6,875
(Triangle apex + Bollinger Band + Volume breakout zone)
═══════════════════════════════════════════════════════════════════
🏆 MASTER TRADER'S FINAL VERDICT
The S&P 500 at 6,843.7 presents a high-conviction bullish opportunity with exceptional risk-reward dynamics. Technical confluence across multiple timeframes, combined with constructive market internals and seasonal factors, supports upside continuation toward 6,900-6,950 initially, with 7,000+ potential.
Top 3 Highest Probability Trades: 🎯
Swing Long: 6,820-6,830 → Target: 6,950 (RR 1:4)
Breakout Long: Above 6,870 → Target: 6,920 (RR 1:3)
Scalp Long: VWAP 6,841 → Target: 6,855 (RR 1:2.5)
Trading Wisdom: 🧠
Position for probability, not possibility. Size for survival, not home runs. The best traders are risk managers who happen to trade.
"Markets can remain irrational longer than you can remain solvent. Trade the chart, not the opinion!" 💡
═══════════════════════════════════════════════════════════════════
📍 ACTIONABLE INTELLIGENCE SUMMARY
Bull market intact above 6,750. Accumulate dips toward 6,820. Target 7,000 by month-end. Risk management is paramount during election week volatility.
Trade with discipline. Prosper with patience. 💰
═══════════════════════════════════════════════════════════════════
#SPX #SP500 #US500 #TechnicalAnalysis #Trading #StockMarket #Indices #DayTrading #SwingTrading #ElliottWave #Wyckoff #HarmonicPatterns #OptionsTrading #VIX #MarketStructure #OrderFlow #InstitutionalTrading #AlgorithmicTrading #TradingView #MarketForecast #SPY #ES_F
🔔 Follow for Institutional-Grade Analysis | Precision • Discipline • Profits 📊
Disclaimer: This analysis is educational only. Trading carries substantial risk of loss. Past performance does not guarantee future results. Always conduct independent research and employ proper risk management.

S&P500 Earnings to drive market volatilityThe S&P 500 closed flat (-0.004%) as Powell tempered expectations for another Fed rate cut in December, while upbeat Trump–Xi trade talks and Nvidia’s milestone $5trn valuation buoyed sentiment. Yields spiked (+10.1bps on 10yr Treasuries) as the BoJ held steady and tech gains drove the NASDAQ (+0.55%) and Mag-7 (+1.03%) to new highs. US equity futures are modestly higher ahead of today’s key events — Apple and Amazon earnings, which will steer Nasdaq direction, and the ECB’s policy decision, where rates are expected to remain unchanged at 2%. Broader attention will also be on results from Eli Lilly, Merck, and Gilead in pharma, alongside major releases in energy and industrials.
Key Support and Resistance Levels
Resistance Level 1: 6904
Resistance Level 2: 6923
Resistance Level 3: 6950
Support Level 1: 6832
Support Level 2: 6806
Support Level 3: 6783
This communication is for informational purposes only and should not be viewed as any form of recommendation as to a particular course of action or as investment advice. It is not intended as an offer or solicitation for the purchase or sale of any financial instrument or as an official confirmation of any transaction. Opinions, estimates and assumptions expressed herein are made as of the date of this communication and are subject to change without notice. This communication has been prepared based upon information, including market prices, data and other information, believed to be reliable; however, Trade Nation does not warrant its completeness or accuracy. All market prices and market data contained in or attached to this communication are indicative and subject to change without notice.

THE SPX (S&P500) IS HEADING UPWARDS! time to buyThe SPX has been stuck inside an upward channel for many weeks and has been bouncing between both support and resistance levels. It has recently broken through a powerful resistance zone which was holding it... which means it is now very likely to keep heading to the upside.

US500US500 – Opportunity at Support
The price is consolidating between 6,880 and 6,920. The support region shows a buying reaction, which could generate a new impulse towards the resistance at 6960.

S&P500 Is it approaching the end of this Cycle?The S&P500 index (SPX) has been trading within a Bullish Megaphone pattern since the October 2022 bottom of the Inflation Crisis. Since the July 2024 High, it also entered a shorter term Megaphone and those two patterns resemble the 2016 - 2019 Megaphones that emerged straight after the 2015 E.U. crisis and China's slowdown.
As you can see, the 1W RSI sequences among the two fractals are also very similar and the Cycles seem to be repeated with the 1W MA50 (blue trend-line) acting as the Support in times of aggressive uptrends, while the 1W MA200 (orange trend-line) acting as the Support of the Bear Cycles/ correction phases.
The former Megaphone peaked in early 2020 on its 1.618 Fibonacci extension. On the current pattern that Fib is at 7100 and may very well get hit by the end of this year. If it does, the probabilities of a strong technical correction towards the 1W MA200 and the bottom of the long-term Bullish Megaphone, rise dramatically. Especially if at the same time, the 1W RSI turns overbought well above the 70.00 barrier.
It is also worth noting that 1W RSI levels below 35.00 are a strong technical Buy Signal. Long-term investors may seek to use this as a complimentary indicator in case this sharp correction materializes.
So do you think SPX will start correcting if it hits that level by early next year?
-------------------------------------------------------------------------------
** Please LIKE 👍, FOLLOW ✅, SHARE 🙌 and COMMENT ✍ if you enjoy this idea! Also share your ideas and charts in the comments section below! This is best way to keep it relevant, support us, keep the content here free and allow the idea to reach as many people as possible. **
-------------------------------------------------------------------------------
💸💸💸💸💸💸
👇 👇 👇 👇 👇 👇

S&P500 - best three-day gain since MayThe S&P 500 heads into today’s session on firm footing after posting its best three-day gain since May (+2.62%), buoyed by optimism around a potential Trump–Xi trade breakthrough and upbeat momentum across tech and semiconductor stocks.
Investor focus is turning to a pivotal week packed with catalysts: four major central bank meetings, a wave of big-tech earnings (starting tomorrow with Microsoft, Meta, and Alphabet), and the anticipated Trump–Xi meeting on Thursday. Market sentiment was bolstered by Trump’s comments suggesting progress toward a deal and even a possible resolution on TikTok, reviving hopes of easing US–China tensions.
The S&P 500 (+1.23%) and Nasdaq Composite (+1.86%) both hit new highs yesterday, driven by strong performance in trade-sensitive and AI-linked names. The Philadelphia Semiconductor Index (+2.74%) led gains, helped by Qualcomm’s +11% surge on new chip news and reports of a $1bn AI partnership between the US Department of Energy and AMD. Nvidia and other mega-cap tech stocks also rallied, pushing the Mag-7 index up +2.6%, its best single-day gain in five months.
On the rates side, the front end of the Treasury curve sold off (2yr +1.0bps) amid risk-on sentiment, while longer maturities rallied (10yr -2.2bps, 30yr -4.1bps), suggesting markets still expect monetary easing ahead. US equity futures are flat this morning, indicating a pause as traders await consumer confidence data and more corporate earnings before the next leg higher.
Bottom line:
Momentum in the S&P 500 remains positive, supported by AI and trade optimism, but with major catalysts still ahead this week, near-term direction will likely hinge on upcoming tech earnings and central bank guidance.
Key Support and Resistance Levels
Resistance Level 1: 6904
Resistance Level 2: 6924
Resistance Level 3: 6950
Support Level 1: 6832
Support Level 2: 6806
Support Level 3: 6784
This communication is for informational purposes only and should not be viewed as any form of recommendation as to a particular course of action or as investment advice. It is not intended as an offer or solicitation for the purchase or sale of any financial instrument or as an official confirmation of any transaction. Opinions, estimates and assumptions expressed herein are made as of the date of this communication and are subject to change without notice. This communication has been prepared based upon information, including market prices, data and other information, believed to be reliable; however, Trade Nation does not warrant its completeness or accuracy. All market prices and market data contained in or attached to this communication are indicative and subject to change without notice.

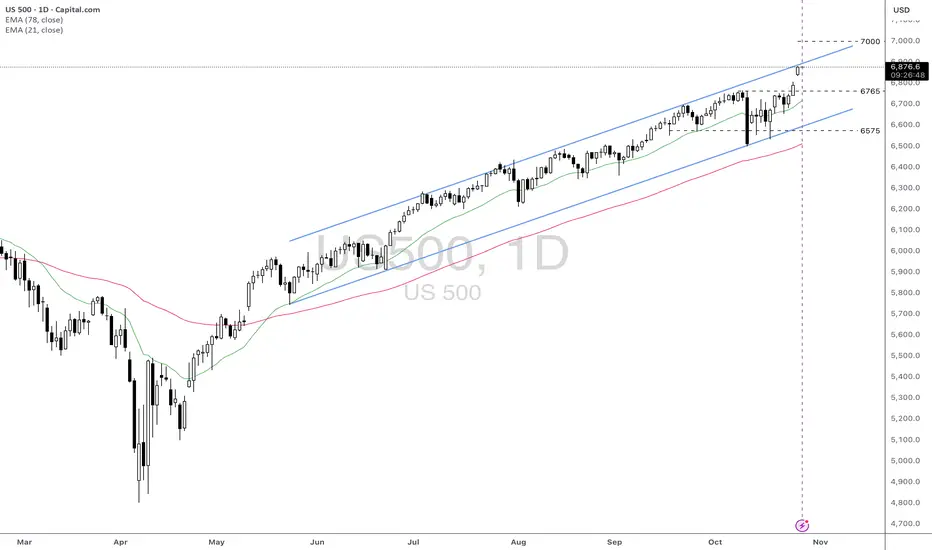
US500: Strong Upward Momentum Approaching 7000 LevelFundamental approach:
- The US500 advanced this week, propelled by strong earnings momentum from tech giants and robust performance in select sectors. Among top movers, Qualcomm rose over 11% following upbeat earnings guidance, while Alphabet and Tesla also rallied ahead of their highly anticipated quarterly results. W.R. Berkley Corporation and Welltower Inc. were notable gainers, reflecting sector rotation and risk-on flows in the index.
- Earnings from the 'Magnificent Seven', including Microsoft, Alphabet, and Meta, drove sentiment, with over 86% of S&P 500 companies reporting results above consensus expectations so far this quarter. Tesla's performance was mixed, while Amazon is set to announce slightly lower profits, but the broader group is still outpacing the rest of the market in earnings growth.
- Tech earnings and the upcoming FOMC decision are key catalysts that may influence future US500 moves. Broad sector participation and ongoing AI investment could sustain upward momentum if macroeconomic conditions remain supportive.
Technical approach:
- US500 created a new all-time high this week after breaching the key level at around 6765. The index showed an urgency in moving upward, creating a gap that remains unfilled. US500 is well above the diverging EMAs, indicating a strong upward momentum. However, the index is approaching the upper bound of the ascending channel, which may limit the price movement.
- If the current gap remains unfilled, the US500 may continue to move upward and test the psychological resistance at 7000.
- On the contrary, rejecting the channel's upper bound may prompt a correction and fill the gap around 6790, retesting the broken level at 6765.
Analysis by: Dat Tong, Senior Financial Markets Strategist at Exness
SPX500 On the way to the upside! BUY NOWSPX500 is in a clear upwards channel and has broken the last bit of resistance (white line shown) - this is a clear confirmation that the next target will be the next resistance zone to the upside shown above (this is a great buy trade opportunity)
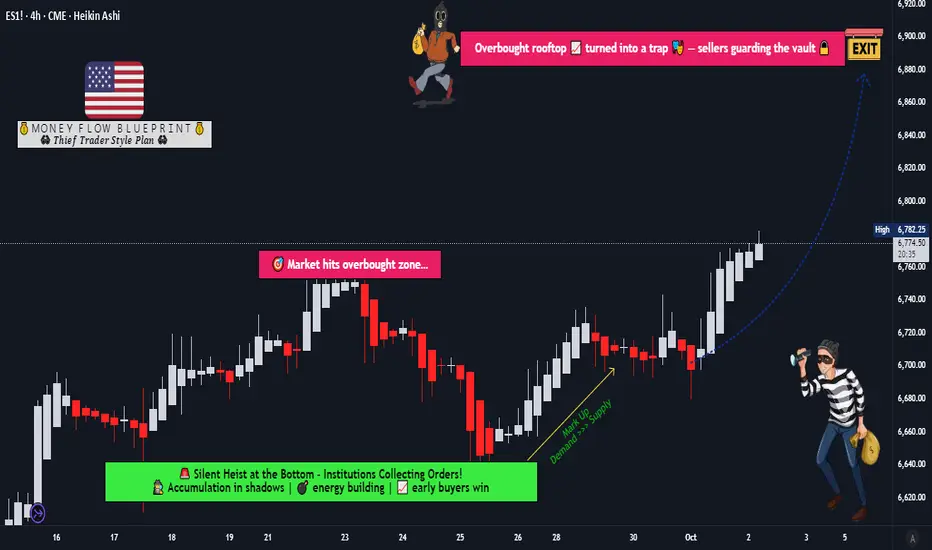
Is ES1! Setting Up for Another Leg Up? Layer Entry Plan💼 ES1! | E-Mini S&P 500 Futures | Thief Market Wealth Strategy Map (Swing/Day Trade) 🚀📈
📊 Plan: Bullish Bias
We are mapping the ES1! (E-Mini S&P 500 Futures) with a thief layering strategy for flexible swing/day trading.
Thief Entry Layers (Layering Strategy Method)
Instead of “one-shot” entries, we use multiple buy limit layers to scale into the move.
💰 Example entry levels:
🔹 6720
🔹 6740
🔹 6760
(👉 Add more layers if you wish, that’s the thief flexibility 🔑)
🛡 Stop-Loss (Thief SL)
📉 6680
⚠ Note: Dear Ladies & Gentlemen (Thief OG’s), I’m not recommending to strictly follow my SL. Manage your own risk — protect your capital thief-style.
🎯 Target (Profit Escape Zone)
📈 6900 — key resistance area + potential overbought zone = possible bull trap!
💡 Escape with profits thief-style before the market traps late buyers.
⚠ Note: Dear Ladies & Gentlemen (Thief OG’s), I’m not recommending to strictly follow my TP. Take your own exit when you steal your bag.
🔑 Key Points & Correlations
🟢 ES1! (S&P 500 futures) often correlates with:
CME_MINI:NQ1! (Nasdaq Futures) 📡 Tech-driven momentum
CBOT_MINI:YM1! (Dow Futures) 🏦 Old-school industrials
CME_MINI:RTY1! (Russell Futures) 📈 Small-cap sentiment gauge
TVC:VIX (Volatility Index) ⚡ Inverse relationship with risk-on moves
Watching these markets helps filter fake pumps and identify real liquidity grabs.
⚡ Thief Trading Philosophy
This is not about exact entries — it’s about layering, adapting, and escaping with profits before the crowd realizes.
Steal pips.
Escape traps.
Repeat.
✨ “If you find value in my analysis, a 👍 and 🚀 boost is much appreciated — it helps me share more setups with the community!”
⚠ Disclaimer: This is a Thief-Style Trading Strategy Map, created just for fun and market observation. This is NOT financial advice. Trade at your own risk and always manage your capital wisely.
#ES1 #SP500 #SPX #Futures #DayTrading #SwingTrading #IndexTrading #MarketAnalysis #TradingStrategy #ThiefTrader #ScalpAndRun
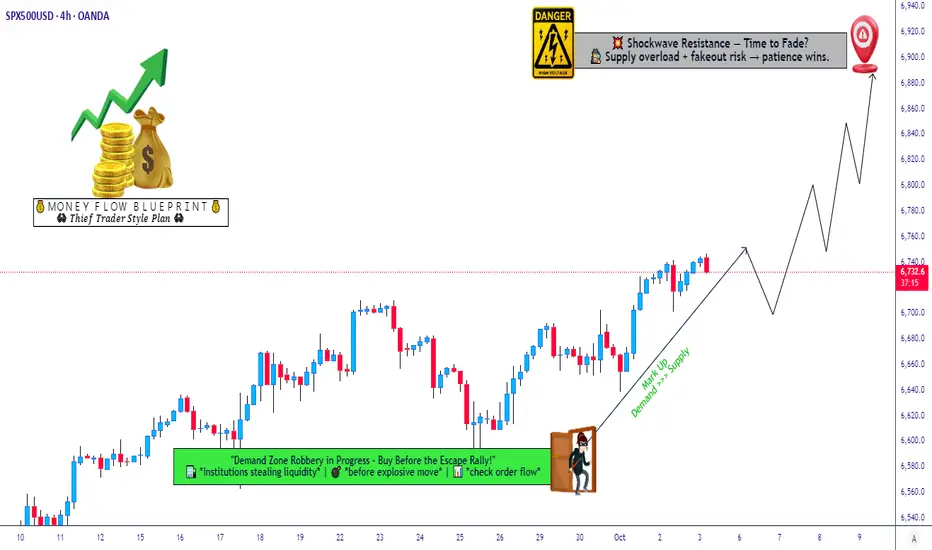
SPX 500 Swing/Day Trade Plan | Bullish Layers & Risk Guard✨ SPX 500 Index | Market Wealth Strategy Map (Swing/Day Trade) ✨
🚨 Plan: Bullish bias with Thief Strategy (layered limit entries).
🕹️ Style: Multiple buy-limit orders placed at different levels (“layering method” for smarter entries).
🎯 Entry Plan (Layered Thief Style)
🔑 Buy Limit Layers: 6660, 6680, 6700, 6720
➕ You can add more layers if market conditions allow.
🧠 Idea: Scaling in like a true Thief 🕶️ — stealing the best spots!
🛑 Stop Loss (SL)
Thief SL: @ 6640
⚠️ Note: Dear Ladies & Gentlemen (Thief OG’s), I’m not recommending you to use only my SL.
It’s your money → your choice → your risk management.
🎯 Target (TP)
Primary Target: @ 6900
🌀 Why? Shockwave resistance ⚡ + overbought zones 📈 + liquidity traps 🪤.
⛑️ Again, it’s your choice to set your own TP — escape with profits when you feel comfortable!
📊 Related Pairs & Correlations to Watch
CAPITALCOM:US500 / SP:SPX / CME_MINI:ES1! → Direct correlation to SPX 500.
NASDAQ:NDX / NASDAQ 100 → Often leads tech momentum, affects SPX swings.
TVC:DXY (US Dollar Index) → Strong dollar = pressure on indices. Weak dollar = fuel for bulls.
CAPITALCOM:US30 (Dow Jones) → Sometimes diverges from SPX, offering confluence signals.
TVC:VIX → Volatility Index — spikes = watch out for fakeouts / liquidity grabs.
💡 Key Takeaways
✅ Thief layering entry style = Scaling smarter, not harder.
✅ SL/TP = Flexible to your own trading psychology & risk appetite.
✅ Always respect risk management & don’t copy-paste blindly.
✅ Remember: markets love traps — be the thief, not the victim.
✨ “If you find value in my analysis, a 👍 and 🚀 boost is much appreciated — it helps me share more setups with the community!”
⚠️ Disclaimer: This is a Thief-style strategy shared just for fun & market learning purposes.
Not financial advice — trade at your own risk!
#SPX500 #US500 #SP500 #SPX #ThiefStrategy #DayTrading #SwingTrading #IndexTrading #MarketAnalysis #StockMarket
S&P500 expected to open on a cautious note- earnings in focusUS equities lost momentum yesterday, with the S&P 500 falling -0.53%, snapping a three-day winning streak as renewed US-China trade tensions, weak corporate earnings, and continued government shutdown worries weighed on sentiment.
Key Drivers:
Trade concerns dominated after reports that the Trump administration is considering export restrictions to China on products containing or developed with US software, in retaliation for China’s rare earth export limits. This escalation hit semiconductor and tech stocks, with the Philadelphia Semiconductor Index down -2.36%.
Later, more conciliatory comments from Trump—suggesting a deal with China was still possible—helped stem deeper losses but failed to lift markets meaningfully.
Oil prices were the exception, with Brent Crude rising above $64/bbl after the US imposed new sanctions on Russia’s largest oil producers, intensifying pressure on global energy markets.
Gold continued its slide, falling another -0.65%, following Wednesday’s sharp selloff.
Corporate News:
Tesla shares came under pressure after profits plunged despite record sales, as rising costs hit margins. CEO Elon Musk used the earnings call to defend his proposed $1 trillion pay package.
Broader earnings sentiment weakened amid several disappointing results, adding to the cautious tone.
Global Developments:
In Canada, Prime Minister Mark Carney announced a plan to diversify exports away from the US and attract skilled immigration, signaling shifting trade dynamics in North America.
Outlook for Today:
Markets are expected to open on a cautious note, with traders monitoring fresh earnings releases and US data for signs of resilience. The S&P 500’s near-term direction will likely hinge on whether confidence improves around trade and earnings, or if risk aversion continues to build into the weekend.
Key Support and Resistance Levels
Resistance Level 1: 6720
Resistance Level 2: 6755
Resistance Level 3: 6765
Support Level 1: 6645
Support Level 2: 6590
Support Level 3: 6560
This communication is for informational purposes only and should not be viewed as any form of recommendation as to a particular course of action or as investment advice. It is not intended as an offer or solicitation for the purchase or sale of any financial instrument or as an official confirmation of any transaction. Opinions, estimates and assumptions expressed herein are made as of the date of this communication and are subject to change without notice. This communication has been prepared based upon information, including market prices, data and other information, believed to be reliable; however, Trade Nation does not warrant its completeness or accuracy. All market prices and market data contained in or attached to this communication are indicative and subject to change without notice.

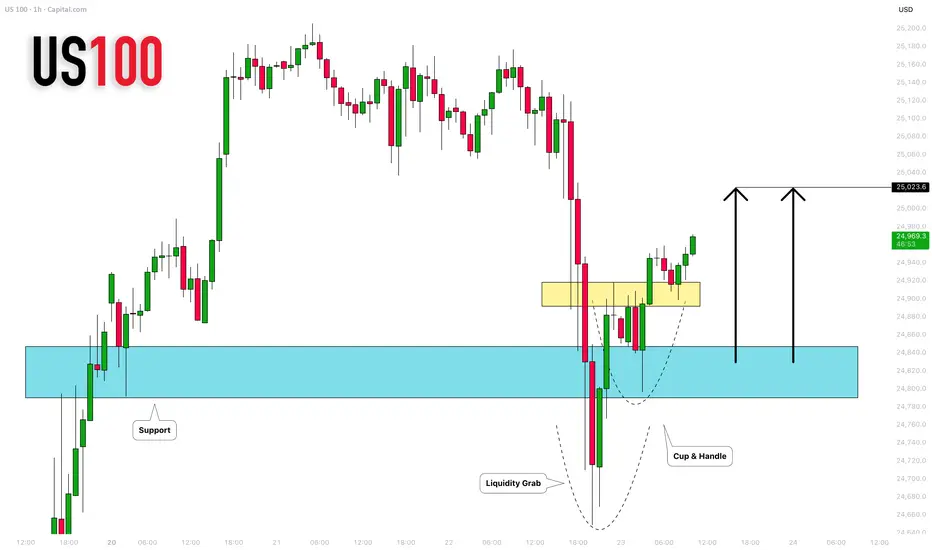
NASDAQ INDEX (US100): Bullish Move After the Trap
I see a confirmed liquidity grab below a key horizontal support
on an hourly time frame.
A formation of a cup & handle pattern and a breakout of its neckline
afterward suggest a strong buygin interest.
The market will rise more and reach at least 25023 level.
❤️Please, support my work with like, thank you!❤️
I am part of Trade Nation's Influencer program and receive a monthly fee for using their TradingView charts in my analysis.
SPX500 On the way to the upside! BUY NOWSPX500 is in a clear upwards channel and has broken the last bit of resistance (white trendline shown) - this is a clear confirmation that the next target will be the red trendline to the upside (next resistance level) - this is a great time to buy

S&P500 Both short and long term bullish targets intact.The S&P500 index (SPX) continues to trade within its 5-month Channel Up and last Friday's pull-back to its 1D MA50 (red trend-line) again is another testament to it as it rebounded exactly on its bottom, making yet another Higher Low.
As we've shown on our previous analysis its short-term Target is the 1.382 Fibonacci extension at 6850. Ahead of a massive 1D MACD Bullish Cross however, we can see (after another short pull-back) the index extending much higher to its 2.5 Fibonacci extension (orange) at 7150 before a larger correction takes place.
-------------------------------------------------------------------------------
** Please LIKE 👍, FOLLOW ✅, SHARE 🙌 and COMMENT ✍ if you enjoy this idea! Also share your ideas and charts in the comments section below! This is best way to keep it relevant, support us, keep the content here free and allow the idea to reach as many people as possible. **
-------------------------------------------------------------------------------
💸💸💸💸💸💸
👇 👇 👇 👇 👇 👇

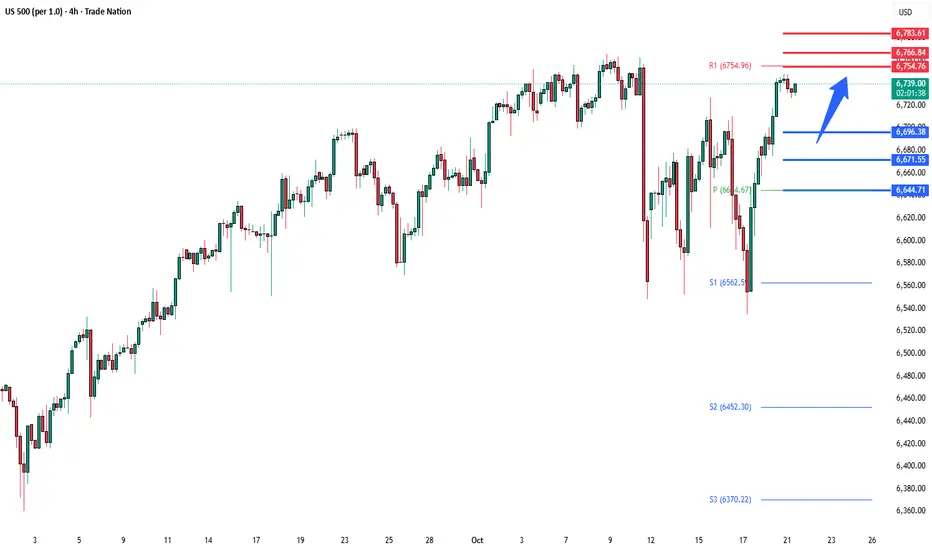
S&P500 Risk appetite improved, supported by easing inflationMarkets extended their rally yesterday, with the S&P 500 up 1.07%, closing just shy of record highs, while 30yr US Treasury yields fell to a 6-month low of 4.57%. The upbeat tone was driven by positive trade headlines, reduced shutdown fears, and lower oil prices — Brent crude slipped to $61.01/bbl, its lowest in five months, easing inflation concerns.
The key catalyst was optimism that the US and China will avoid new 100% tariffs due to take effect on November 1, after President Trump signalled confidence in reaching a “fair and great” trade deal following upcoming meetings.
In political news, Sanae Takaichi became Japan’s first female prime minister, a historic move likely to bring policy continuity with a conservative tone.
Elsewhere, Amazon Web Services resolved a 15-hour outage, underscoring global dependence on its infrastructure but with limited lasting market impact.
Overall tone:
Risk appetite improved, supported by easing inflation pressure and trade optimism.
Focus today shifts to earnings (Netflix, GE, Coca-Cola, etc.), Canada CPI, and ECB speakers, as investors gauge whether the rally can sustain into mid-week.
Key Support and Resistance Levels
Resistance Level 1: 6754
Resistance Level 2: 6766
Resistance Level 3: 6783
Support Level 1: 6696
Support Level 2: 6670
Support Level 3: 6645
This communication is for informational purposes only and should not be viewed as any form of recommendation as to a particular course of action or as investment advice. It is not intended as an offer or solicitation for the purchase or sale of any financial instrument or as an official confirmation of any transaction. Opinions, estimates and assumptions expressed herein are made as of the date of this communication and are subject to change without notice. This communication has been prepared based upon information, including market prices, data and other information, believed to be reliable; however, Trade Nation does not warrant its completeness or accuracy. All market prices and market data contained in or attached to this communication are indicative and subject to change without notice.
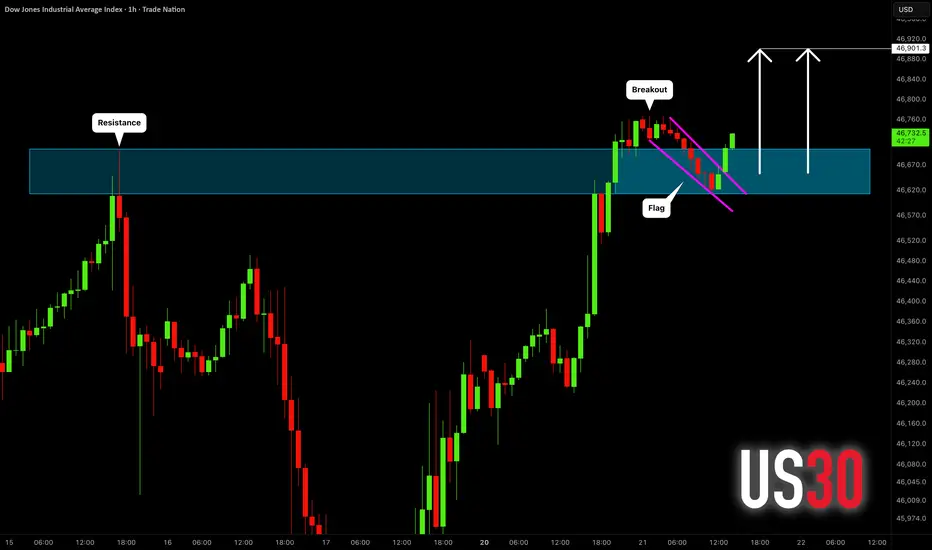
DOW JONES INDEX (US30): Bullish Continuation Confirmed
US30 index violated a major horizontal resistance yesterday.
The price started a correctional movement then, steadily
falling within a bullish flag pattern.
A breakout of its resistance line is a strong bullish signal.
Odds will be high, the index will hit 46900 level soon.
❤️Please, support my work with like, thank you!❤️
I am part of Trade Nation's Influencer program and receive a monthly fee for using their TradingView charts in my analysis.
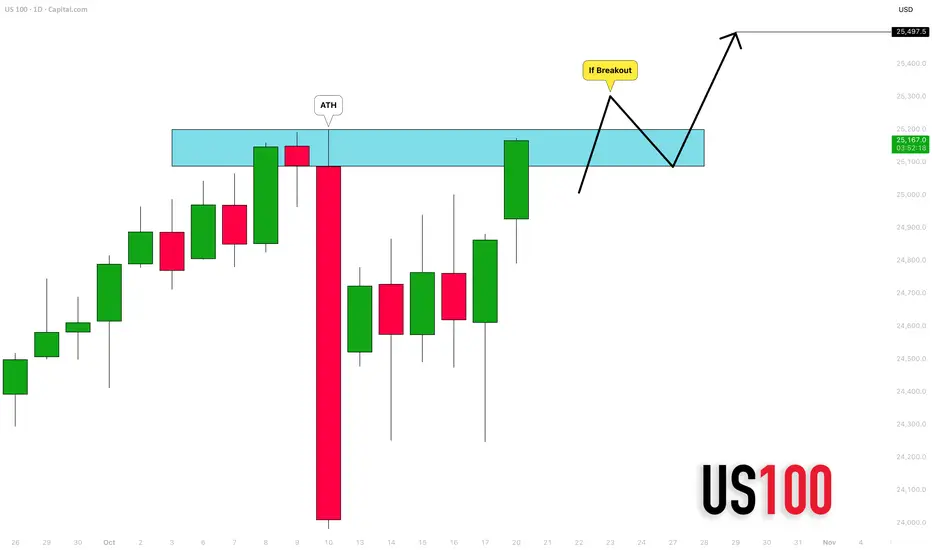
NASDAQ INDEX (US100): Get Ready for Breakout
Nasdaq index is currently testing a resistance based on a current
all-time high.
With a high probability, the market is going to break that.
A daily candle close above will confirm a violation.
A further growth will be expected at least to 25500 level then.
❤️Please, support my work with like, thank you!❤️
I am part of Trade Nation's Influencer program and receive a monthly fee for using their TradingView charts in my analysis.
BUY SPX - S&P500- Profitable trade opportunity!Based on our deep analysis we can see that SPX (S&P500) will head to the upside. Great time to BUY - it is currently in a uptrend and is holding on to powerful support levels. The next target is the resistance level to the upside. This is a great low risk high reward trade. BUY NOW!

US500 rallied despite lingering risks of regional banks stress
Fears surrounding regional banks that rattled markets quickly faded, as reassuring earnings results and President Trump’s conciliatory tone toward China restored investor confidence.
Earlier this week, Zions Bank and Western Alliance Bank reported losses tied to loan fraud, reviving fears reminiscent of the Silicon Valley Bank collapse. However, stronger-than-expected earnings and limited signs of credit deterioration reassured investors and eased market jitters. Moody’s noted that while concerns over bad loans persist, there is little evidence of systemic risk. They added that regional banks’ key health metrics remain solid.
US500 briefly tested the support at 6530 before approaching the resistance at 6700 again. The index remains above bullish EMAs, indicating a potential extension of bullish momentum.
If US500 closes above 6700, it may gain upward momentum toward the next resistance at 6800. Conversely, if it closes near EMA21, the index may retreat toward the next support at 6530.
