US500 (S&P 500) Technical Forecast: At a Critical Crossroad🎯 US500 (S&P 500) Technical Forecast: At a Critical Crossroad
The US500 trades at 6,672.1, testing a major technical confluence. Our analysis points to a tense equilibrium between bulls and bears, with the next directional move set for a significant breakout.
📊 Multi-Timeframe Synthesis & Market Structure
Daily (Trend Bias): The long-term trend remains cautiously bullish above the 6,600 support (50 EMA & prior resistance break). However, price action is compressing, indicating a loss of momentum and a potential coiling for a volatile move.
4H & 1H (Swing Setup): A potential Double Top pattern is forming, with the neckline near 6,640. The 4H RSI shows a pronounced bearish divergence, signaling weakening buying pressure. This is a primary warning for swing traders.
Intraday (15M/5M - Precision): Immediate resistance is firm at 6,690 - 6,700 (psychological level). Support sits at 6,660. A break below 6,660 targets the 6,640 neckline. The 5M Anchored VWAP is capping rallies.
🧠 Key Technical Narratives & Theories
Elliott Wave & Wyckoff: The structure from the last low suggests we may be in a complex Wave 4 correction or the final phase of a Wyckoff distribution (Upthrust After Distribution). A break below 6,640 would confirm this bearish narrative.
Gann & Harmonic Levels: Key Gann support converges with the 0.382 Fibonacci retracement level near 6,620-6,630. This is the next major target if sellers overpower the 6,640 level.
Ichimoku Cloud: On the 4H chart, price is trading within the Kumo (cloud), indicating a loss of trend direction and a battleground between buyers and sellers.
⚖️ Momentum & Volume Assessment
RSI (14): Reading 49 on the 1D, neutral but bearish-diverged on lower timeframes.
Bollinger Bands (20): Price is hugging the middle band, and bands are squeezing, indicating a period of low volatility that often precedes a high-volatility expansion.
Volume & VWAP: Recent attempts to push higher have been on declining volume, a classic sign of a potential bull trap. Anchored VWAP from the recent swing low is now resistance.
🛠️ Trade Plan & Levels
Swing Short Idea: Sell on a confirmed break below 6,640 (close on 1H), targeting 6,620 and then 6,580. Stop loss above 6,710.
Intraday Short Idea: Sell on a break below 6,660 or rejection from 6,690, targeting 6,640. Stop loss above 6,705.
Intraday Long Idea: Only consider buys on a strong break and hold above 6,700 with rising volume, targeting 6,730. Stop loss below 6,680.
💡 The Bottom Line
The US500 is showing cracks in its bullish armor. The burden of proof is on the bulls to reclaim 6,700. Until then, the path of least resistance appears to be lower, with a break of 6,640 likely triggering a deeper pullback. Manage risk carefully in this volatile setup.
Disclaimer: This is technical analysis, not financial advice. Trade at your own risk.
Us500

SPX 500 extends recovery as traders watch US-China situationAfter breaking above 6677 yesterday, the S&P 500 created a higher high on the intraday charts, and so today's gains were a continuation of that move. But the index has now arrived into the next potential resistance area between 6720-6740, which was a key short-term support zone before the breakdown we saw on Friday. Could we see some volatility around this zone now?
Risk appetite returned overnight, with US index futures climbing to new weekly highs, even though European markets showed a more mixed performance. In currencies, the US dollar index retreated against most major peers, surrendering part of its recent gains. Market sentiment this week reflects a cautious blend of optimism and restraint. Expectations for Federal Reserve rate cuts remain the key driver, underpinning risk appetite even as gold extends its record-breaking rally beyond $4,200.
Investors appear largely unfazed by renewed US–China trade tensions, brushing off President Trump’s latest warning on cooking oil imports. Meanwhile, solid US bank earnings have bolstered confidence in corporate resilience, keeping equities supported despite the ongoing US government shutdown. Adding to the upbeat tone this morning, French political tensions eased after Prime Minister Sébastien Lecornu announced a delay to his contentious pension reform plan.
But with the US-China tensions back at the forefront, could investors start taking profits on their long equity trades to cause a bit of selling pressure now?
by Fawad Razaqzada, market analyst with FOREX.com

SPX500 | HULL MA & Fibo Confluence Setting Up the Move!🎯 SPX500: The "Polite Thief" Strategy - Stealing Profits Like a Gentleman 🎩💰
📊 Market Overview
Asset: SPX500 (S&P 500 Index CFD)
Trade Type: Swing/Day Trade Opportunity
Bias: Bullish 🐂
Strategy Style: Multi-Layer Entry (The "Thief Method")
🔍 Technical Setup
The Plan: We're eyeing a bullish confirmation with a clean retest/pullback at the 38.2% Fibonacci level, aligned beautifully with our HULL Moving Average. This confluence zone is screaming "buy the dip" louder than your portfolio manager at a market crash! 📈
🎯 Entry Strategy Options:
Option 1: The "Polite Thief" Multi-Layer Approach
Instead of going all-in like it's a Vegas buffet, we're using calculated limit orders:
📍 Layer 1: 6620
📍 Layer 2: 6640
📍 Layer 3: 6660
📍 Layer 4: 6680
Feel free to add more layers based on your account size and risk appetite!
Option 2: Market Execution
Jump in at any current price level if the setup confirms during live hours.
🛡️ Risk Management
Stop Loss: 6580
⚠️ Disclaimer: Dear Ladies & Gentlemen (Thief OG's), this is MY stop loss based on MY analysis. You're the captain of your own ship! 🚢 Set your risk parameters according to YOUR comfort level and account size. Risk management is YOUR responsibility.
💎 Profit Target
Target Zone: 6860
This level represents our "Electric Shock Wall" 🔌⚡ - a confluence of:
Strong historical resistance
Overbought territory potential
Bull trap zone (where late entries get caught)
Exit Strategy Note: I'm not your financial advisor! 💼 When you see green, secure those gains at YOUR discretion. The market doesn't care about our targets - take profit when YOU feel comfortable!
🌐 Related Pairs to Watch
Keep your eyes on these correlated instruments:
📈 AMEX:SPY (S&P 500 ETF) - Moves in lockstep with SPX500; watch for volume confirmation
📈 NASDAQ:QQQ (Nasdaq-100 ETF) - Tech-heavy index; bullish momentum here supports SPX strength
📈 AMEX:DIA (Dow Jones ETF) - Broader market sentiment indicator
📈 TVC:VIX (Volatility Index) - Inverse correlation; falling VIX = bullish for equities
💵 TVC:DXY (US Dollar Index) - Typically inverse to equities; weakening dollar supports stocks
Key Correlation: When tech leads (QQQ pumping), SPX usually follows. Watch for VIX to stay subdued below 15 for sustained bullish momentum.
📝 Key Technical Points
✅ 38.2% Fibonacci retracement acting as dynamic support
✅ HULL Moving Average confluence strengthens the setup
✅ Multi-layer entry reduces average cost and timing risk
✅ Clear risk/reward structure with defined zones
✅ Resistance zone identified for disciplined exits
⚡ The "Thief Strategy" Philosophy
We're not robbing the market - we're borrowing profits with permission! 😉 The layered entry approach allows us to build positions like a professional, not gamble like a reckless amateur. Scale in, scale out, and live to trade another day!
✨ If you find value in my analysis, a 👍 and 🚀 boost is much appreciated — it helps me share more setups with the community!
⚠️ Final Disclaimer
IMPORTANT: This "Thief Style" trading strategy is for educational and entertainment purposes only! 🎪 This is NOT financial advice. I'm sharing my personal analysis and trade ideas - what you do with your money is 100% YOUR decision. Trade at your own risk, manage your own capital, and never risk more than you can afford to lose. Past performance doesn't guarantee future results. Always do your own research! 🔍
#SPX500 #SP500 #TradingIdeas #SwingTrading #DayTrading #TechnicalAnalysis #FibonacciRetracement #SupportAndResistance #RiskManagement #TradingStrategy #StockMarket #IndexTrading #ThiefStrategy #LayeredEntry #PriceAction #MarketAnalysis #TradingCommunity #ChartAnalysis

S&P 500 The Bull Run Is Over. Watch the Yellow Level.The S&P 500 rally looks exhausted.
Over the past week, momentum has clearly faded, lower highs, weaker daily closes, and stronger selling pressure on each bounce.
Technically, the market shows early signs of a shift from bullish to corrective or bearish.
The Yellow Level acts as a divider between a mildly bullish market and the start of a medium-term bearish phase.
Above the Yellow Level: price may hold short-term strength or consolidation.
Below the Yellow Level: structure breaks down and downside potential expands.
A daily close below the Yellow Level would confirm the beginning of a broader bearish move.
In my view i suggest all the Trader/Investor which they are reading this to stay AT LEAST 80/90% IN CASH. something is about to happen... stay safe!

S&P500 Can the 1D MA50 save the day?The S&P500 index (SPX) has been trading within a 5-month Channel Up and last Friday's flash crash touched its bottom making a new Higher Low. At the same time, it hit its 1D MA50 (blue trend-line) for the first time May 01 2025.
As long as the market keeps closing the daily candles inside the Channel Up, we expect the new Bullish Leg to start and as the shortest ones did within the pattern, target at least the 1.382 Fibonacci extension level at 6850.
If a 1D candle closes below the Channel Up though, there are higher probabilities to see a stronger dip to the 1D MA100 (green trend-line) a 6400.
On a sidenote, the 1D RSI hit and rebounded on Friday on its Lower Lows trend-line, favoring at the moment a bullish continuation.
-------------------------------------------------------------------------------
** Please LIKE 👍, FOLLOW ✅, SHARE 🙌 and COMMENT ✍ if you enjoy this idea! Also share your ideas and charts in the comments section below! This is best way to keep it relevant, support us, keep the content here free and allow the idea to reach as many people as possible. **
-------------------------------------------------------------------------------
💸💸💸💸💸💸
👇 👇 👇 👇 👇 👇

S&P500 Volatility remains elevated, ahead of earnings resultsMonday’s Rally Recap:
The S&P 500 rebounded strongly, recovering over half of Friday’s losses. The main driver was more positive trade rhetoric, with signs the US is open to compromise—softening the tone from Friday’s comments.
A secondary boost came from AI optimism, as OpenAI signed a major chip deal with Broadcom (+9.88%), lifting tech sentiment.
Current Market Setup:
Despite Monday’s gains, S&P 500 futures are down -0.38% this morning, as:
US-China tensions escalated again—China sanctioned US units of a Korean shipping giant, a counter to US trade pressure.
Market volatility persists, with the dollar and Treasuries rising, and oil pulling back.
Government shutdown enters Day 14, disrupting IPO timelines and withholding macroeconomic data, adding uncertainty.
Focus Ahead:
The start of US earnings season today is crucial: JPMorgan, Goldman Sachs, Wells Fargo, BlackRock, Citigroup, and Johnson & Johnson all report. Their results will likely set the tone for Q4 expectations and influence near-term direction.
Underneath market movements, there's a sense of longer-term repricing as investors hedge against policy uncertainty and inflation ("debasement trade").
Bottom Line for S&P 500:
Volatility remains elevated. Monday’s rebound was fueled by sentiment, but renewed geopolitical risk, lack of macro data, and earnings uncertainty are keeping futures under pressure today. Market likely to trade cautiously until earnings results provide clearer direction.
Key Support and Resistance Levels
Resistance Level 1: 6680
Resistance Level 2: 6703
Resistance Level 3: 6728
Support Level 1: 6547
Support Level 2: 6522
Support Level 3: 6487
This communication is for informational purposes only and should not be viewed as any form of recommendation as to a particular course of action or as investment advice. It is not intended as an offer or solicitation for the purchase or sale of any financial instrument or as an official confirmation of any transaction. Opinions, estimates and assumptions expressed herein are made as of the date of this communication and are subject to change without notice. This communication has been prepared based upon information, including market prices, data and other information, believed to be reliable; however, Trade Nation does not warrant its completeness or accuracy. All market prices and market data contained in or attached to this communication are indicative and subject to change without notice.

NASDAQ INDEX (US100): Bearish Outlook Explained
US100 stopped growing after a test of the underlined intraday horizontal supply zone.
A formation of a bearish engulfing candle after its test suggests a strong
bearish pressure from that.
I think that the market will drop at least to 24030 level.
❤️Please, support my work with like, thank you!❤️

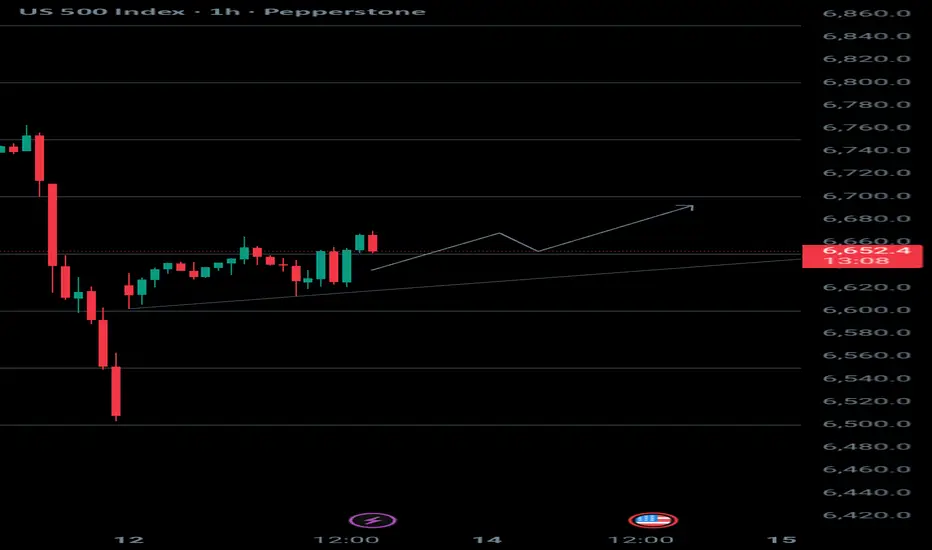
US 500The US 500 has just broken through the 6650 level again. After testing support and closing above it, the trend is to target the next level, 6700.
S&P 500 - GRAND MARKET OUTLOOKS&P 500 - GRAND MARKET OUTLOOK BY FIBCOS
This analysis integrates multiple layers of market interpretation, combining Elliott Wave Theory across Supercycle , Macro , Micro , and Sub-Micro degrees with Smart Money Concepts (SMC) , price action behavior, and Fibonacci retracements/extensions to project the S&P 500 ’s long-term trajectory. It captures how institutional capital rotates through accumulation and distribution phases, aligned with macroeconomic cycles, policy shifts, and investor sentiment. Each wave is grounded in historical and forward-looking fundamental events—from post-war booms to financial crises to the current AI-driven tech surge. The use of Fibonacci ratios (1.618, 3.618, 5.618) provides mathematical confluence for wave targets, while price structure confirms the ongoing impulsive behavior. Altogether, it creates a cohesive, multi-dimensional forecast expected to culminate in a Supercycle Wave (III) top around Q1 2029 , with an S&P 500 target between 20,000(20K).
🌀 Supercycle Wave (III) — The Final Ascent (1942–2029*)
🌍 SUPERCYCLE STRUCTURE: The Multi-Generational Bull
We are inside Supercycle Wave (III) which began in 1942 and is unfolding in 5 Macro Impulse Waves . Each of these macro waves has further Micro and Sub-Micro waves. As of 2025, we're in the final stretch of this grand cycle, specifically:
👉 Sub-Micro Wave ③ of Micro Wave ⑤ of Macro Wave ⑤ of Supercycle Wave (III)
Final top expected in Q1 2029 , around the 20,000 (20K) zone 📍
🧭 MACRO WAVE TIMELINE (Supercycle III)
🔹 Macro Wave ① (1942–1968): 🌟 Post-War Industrial Renaissance
Fundamentals:
WWII victory → economic dominance
Baby boom, suburbanization, auto and housing expansion
Bretton Woods system established USD supremacy 💵
Smart Money Insight:
Institutional capital rotated from war manufacturing into consumer goods, construction, and tech foundations
Price Action: Strong impulsive move with clean higher highs/lows
Fibonacci Insight: Laid the base for 1.618 extension targets
Ends in 1968 with rising inflation and Vietnam drag
🔹 Macro Wave ② (1968–1974): 🌪️ Stagflation Storm
Fundamentals:
Vietnam War expenditures
Gold standard broken (1971 Nixon shock)
Oil embargo, inflation > growth
Price Action: Deep correction, volatile chop, broad distribution
SMC Insight: Institutions exited cyclicals, quietly accumulated future outperformers (tech, defense)
Fibonacci: 0.236% retracement of Super Cycle Wave ii
🔹 Macro Wave ③ (1974–2000): 🚀 Tech & Financialization Explosion
Fundamentals:
Reaganomics & deregulation
PC revolution, Internet birth, globalization 🌐
Explosion in derivatives, S&P futures, ETFs
SMC: Institutions accumulated during 70s lows, fueled tech IPO boom (Apple, Microsoft)
Price Action: Violent rallies with accelerating slope — classic 3rd wave behavior
Fibonacci: Extended well beyond 4.618% of Macro ① & ② — true power wave
🔹 Macro Wave ④ (2000–2009): 🌊 Dot-Com + Financial Crisis Correction
Fundamentals:
Dot-Com bust ➜ $5T in lost value
9/11 shocks & Iraq war
GFC: Housing bubble → global banking collapse
Price Action: Double top structure (2000 & 2007), multi-leg correction
SMC Insight: Smart money cashed out in 2000 and 2007; bought again heavily in March 2009
Structure: WXY complex correction, bottoming with V-shape GFC recovery
Fibonacci: 0.236% retracement of Macro ②
🔶 MACRO WAVE ⑤ (2009–2029): 🔥 The Final Ascent – AI, Liquidity & Euphoria
This is the final macro wave of Supercycle (III), and it subdivides into 5 Micro Impulse Waves.
We are now in Micro Wave ⑤ , which itself contains Sub-Micro Waves 1–5.
🔷 Micro Wave ① (2009–Apr 2010): 🪙 The Bounce from Oblivion
Fundamentals:
Fed QE1 💉, bailouts (TARP), 0% rates
Fear of deflation flipped to hunt for yield
Price Action: Clean V-bottom, shallow pullbacks
SMC: Institutions were loading REITs, tech, and banks post-GFC carnage
🔷 Micro Wave ② (Apr 2010–Jun 2010): 🩻 Flash Crash Flush
Fundamentals:
Euro debt scare, Greece bailout, volatility spike
Price Action: Sharp correction, liquidity vacuum
Fibonacci: Textbook 0.236% retracement
SMC: Stop hunt phase — liquidity grab before next leg
🔷 Micro Wave ③ (Jun 2010–2018): 🚀 Passive Investing Boom
Fundamentals:
QE2, QE3 → massive central bank asset inflation
Apple, Amazon, Google explode in earnings and valuation
ETF revolution = automated capital flows
Price Action: Relentless trend with low volatility
Fibonacci: 2.618+ extension of Wave ①
SMC: Institutions began multi-year hold strategies (FANGM), volatility sellers emerged
🔷 Micro Wave ④ (2018–2020): ⚠️ Volatility & COVID Shock
Fundamentals:
Rate hikes (2018), trade war (US-China)
COVID black swan — global shutdown, crude oil collapse (went negative!)
Price Action: Massive drop with record velocity (VIX > 80)
SMC: Panic selling, smart money accumulation March 2020
🔵 MICRO WAVE ⑤ (2020–2029): 📈 The Final Climb Begins
This is where we are now. This Micro Wave ⑤ is subdividing into:
🟢 Sub-Micro Wave ① (Mar 2020 – Nov 2021): 💹 Stimulus Mania
Fundamentals:
Unlimited QE, COVID relief checks
Crypto/NFT mania, meme stocks (GME/AMC)
Retail explosion via Robinhood & Reddit
Price Action: Parabolic rally, overbought signals
SMC: Institutions faded retail euphoria mid-2021
🟡 Sub-Micro Wave ② (Nov 2021 – Oct 2022): 🔻 Inflation Reckoning
Fundamentals:
CPI > 9%, Fed hikes aggressively
Yield curve inversion, tech meltdown
Price Action: 0.236% retracement
SMC: Smart money rotated into energy, defense, and value stocks during panic
Sentiment : Retail fled, fear extreme — perfect accumulation zone
🔴 Sub-Micro Wave ③ (Oct 2022 – Est. 2027): ⚡ AI Supercycle Ignites
CURRENT WAVE IN PROGRESS
Fundamentals:
AI revolution (ChatGPT, LLMs, Robotics, Automation)
Cloud, semiconductors, defense, biotech surge
Fiscal policy dominance, wars & tech race 🧠
Price Action:
Clean impulse structure
Shallow pullbacks, breakout-retest continuation
SMC:
Institutions aggressively long AI/Defense (Nvidia, Palantir, defense contractors)
Liquidity injections in dips, stealth breakouts
Fibonacci Target: 3.618 extension ~11,200
Expected to peak in 2026
🟠 Sub-Micro Wave ④ (Est. 2027-2028): 🧯 Last Shakeout Before the Climax
Expect:
Profit-taking, geopolitical panic, credit stress
Retest of broken trendline or previous resistance zone
Fibonacci : Retrace 0.236–0.382 of Wave ③
SMC: Final accumulation before blow-off top
🔵 Sub-Micro Wave ⑤ (Est. 2028–Q1 2029): 🚨 Blow-Off Top: 20,000 Target
Fundamentals:
Peak optimism: “AI replaces everything”, euphoria
Retail mania, influencer ETFs
Fed/central banks possibly easing again to avoid slowdown
Price Action: Parabolic, low pullbacks, extreme momentum, RSI divergence, volume climax
SMC: Massive institutional distribution — quiet selling into strength
Target: ~20,000 (5.618 of Wave ①), final top of Supercycle (III)
🛑 What Comes After? SUPERCYCLE WAVE (IV): 🔻 Decade-Long Reset (2029–2040?)
Major correction, potentially multi-decade sideways or secular bear
Catalyst? AI bust, geopolitical war, credit collapse
"Stay focused on structure, not emotions." - FIBCOS
📘 Disclaimer: This is a structural, educational market outlook. Not financial advice. Please do your own due diligence and risk management.
#FIBCOS #ElliottWave #SmartMoneyConcept #MarketAnalysis #Gold #XAUUSD #ElliottWave #WaveTheory #SuperCycle #MacroTrend #SmartMoney #Fibonacci #PriceAction #Commodities #TechnicalAnalysis #LongTermOutlook

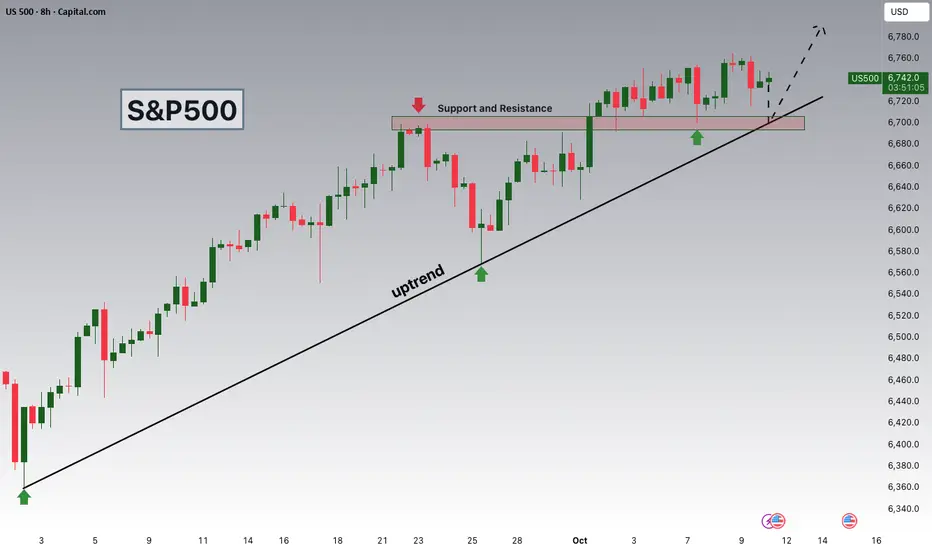
S&P 500 Watching 6,700 Support as Seasonal Tailwinds Strengthen.Hey Traders,
In today’s session, we’re keeping a close eye on US500 for a potential buying opportunity around the 6,700 zone. The S&P 500 remains firmly in an uptrend, with price currently in a healthy correction phase approaching a key support and trend confluence near 6,700.
Beyond the technical setup, seasonality adds a bullish layer — over the past 15 years, the S&P 500 has advanced 14 times in October to early November, averaging significant gain during this window.
If history rhymes, the current pullback could offer a compelling buy-the-dip opportunity into one of the market’s strongest seasonal periods.
Trade safe,
Joe.
S&P500 fresh all time highUS equities regained momentum yesterday, with the S&P 500 up 0.58% to a fresh all-time high as investors shrugged off political uncertainty and the ongoing government shutdown. The broader risk-on tone was supported by strong global sentiment, easing bond yields, and renewed optimism across multiple asset classes.
Key drivers:
Political backdrop: Despite the US shutdown and political noise in France, markets focused on stability signals — notably President Macron’s decision to delay a snap election by pledging a new prime minister.
Global rally: Equities, bonds, oil, and gold all moved higher, reflecting a broad-based risk appetite. Gold hit a record $4,042/oz, suggesting some defensive hedging alongside equity strength.
AI momentum: The AI investment boom continued to fuel tech optimism, with Nvidia-backed startup N8n raising $180m at a $2.5bn valuation, underscoring ongoing enthusiasm around AI-linked growth.
Macro & policy: Investors largely looked past Washington gridlock, though air traffic disruptions and debate over furloughed workers’ pay added to the shutdown narrative.
Market tone:
Sentiment remains constructive for the S&P 500, with investors betting on resilient corporate earnings and continued AI-driven growth. However, elevated valuations and political uncertainty may temper further near-term upside.
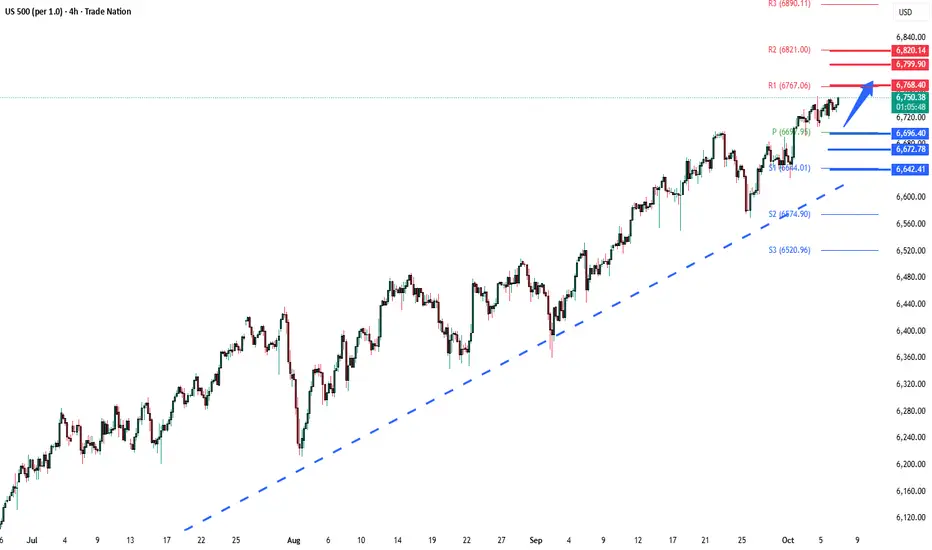
Key Support and Resistance Levels
Resistance Level 1: 6768
Resistance Level 2: 7800
Resistance Level 3: 6820
Support Level 1: 6695
Support Level 2: 6672
Support Level 3: 6642
This communication is for informational purposes only and should not be viewed as any form of recommendation as to a particular course of action or as investment advice. It is not intended as an offer or solicitation for the purchase or sale of any financial instrument or as an official confirmation of any transaction. Opinions, estimates and assumptions expressed herein are made as of the date of this communication and are subject to change without notice. This communication has been prepared based upon information, including market prices, data and other information, believed to be reliable; however, Trade Nation does not warrant its completeness or accuracy. All market prices and market data contained in or attached to this communication are indicative and subject to change without notice.

S&P500 Uptrend continuation supported at 6696 The S&P 500 (+0.36%) climbed to another record high, showing resilience despite political uncertainty in Europe and the ongoing US government shutdown. Gains were driven largely by a massive 23.7% surge in AMD after news that OpenAI will purchase tens of billions of dollars’ worth of its chips, making AMD the standout performer in the index.
Even though over half of S&P 500 constituents declined, tech strength — led by AMD and NASDAQ’s 0.71% advance — lifted the broader market. After the close, news of the US government taking a 10% stake in Canada’s Trilogy Metals (up 215% in after-hours) reinforced investor focus on critical minerals.
Gold eased slightly from the $4,000 mark but remains strong amid global uncertainty, while Tesla’s upcoming launch of a cheaper Model Y could influence sector sentiment. Overall, tech leadership continues to support the S&P 500’s momentum despite mixed breadth and macro headwinds.
Key Support and Resistance Levels
Resistance Level 1: 6768
Resistance Level 2: 6800
Resistance Level 3: 6820
Support Level 1: 6696
Support Level 2: 6670
Support Level 3: 6640
This communication is for informational purposes only and should not be viewed as any form of recommendation as to a particular course of action or as investment advice. It is not intended as an offer or solicitation for the purchase or sale of any financial instrument or as an official confirmation of any transaction. Opinions, estimates and assumptions expressed herein are made as of the date of this communication and are subject to change without notice. This communication has been prepared based upon information, including market prices, data and other information, believed to be reliable; however, Trade Nation does not warrant its completeness or accuracy. All market prices and market data contained in or attached to this communication are indicative and subject to change without notice.
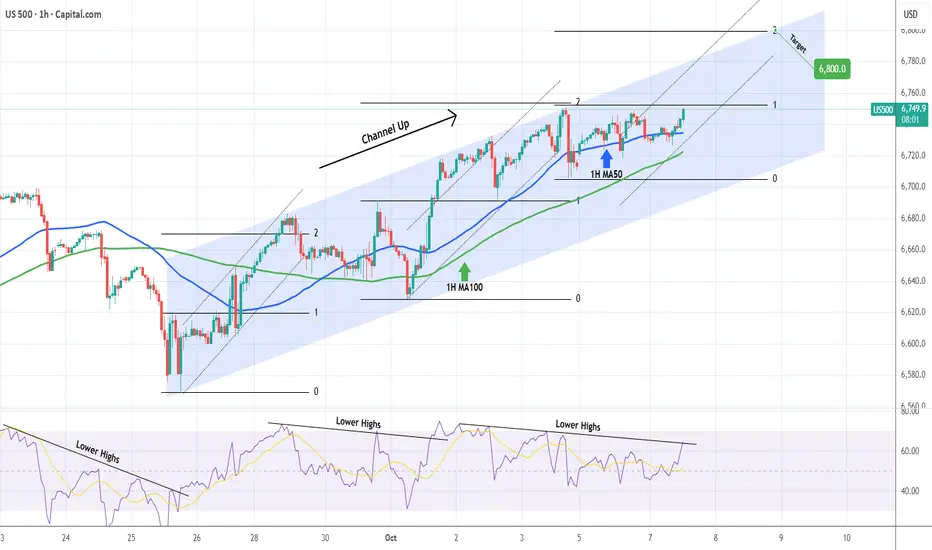
S&P500 Found the Support it needed for 6800.The S&P500 index (SPX) gave us an excellent bottom buy signal last week (September 30, see chart below), rebounding straight after and quickly hitting our 6720 Target:
This time we focus on a much shorter term Channel Up pattern that has emerged, which has just given us another buy signal as it is currently bouncing on its 1H MA50 (blue trend-line).
As long as the 1H MA100 (green trend-line) holds and the 1H RSI breaks above its Lower Highs trend-line, we expect the index to seek a new Higher High on the 2.0 Fibonacci extension at 6800.
-------------------------------------------------------------------------------
** Please LIKE 👍, FOLLOW ✅, SHARE 🙌 and COMMENT ✍ if you enjoy this idea! Also share your ideas and charts in the comments section below! This is best way to keep it relevant, support us, keep the content here free and allow the idea to reach as many people as possible. **
-------------------------------------------------------------------------------
💸💸💸💸💸💸
👇 👇 👇 👇 👇 👇
$SPX500 Swing Trade: Bullish SMA Setup!📈 S&P 500 CFD: Thief’s Bullish Pullback Plan 🤑💰
🚨 Swing/Day Trade Setup: S&P 500 Index CFDSteal profits with this 200 SMA Pullback Plan using the "Thief" layered entry strategy! 📊💸 Below is a detailed breakdown combining technicals, fundamentals, and market sentiment to help you navigate this bullish opportunity. Let’s dive in! 🐂
🎯 Trading Plan Overview
Asset: S&P 500 Index CFD ( FOREXCOM:SPX500 )
Bias: Bullish 🐂
Strategy: Pullback to 200 SMA with layered "Thief" limit orders for entries
Why This Plan?
Technicals: The S&P 500 is riding record highs with strong momentum, supported by the 200 SMA as a dynamic support level.
Fundamentals: Cooling inflation (PPI -0.1% vs. +0.3% expected), 100% Fed rate cut probability, and robust corporate earnings (+10% in 2025, +13% in 2026) fuel bullish sentiment.
Sentiment: Neutral Fear & Greed Index (51/100) with low volatility (VIX ~15.04) and AI-driven institutional flows (e.g., Oracle +30%).
📊 Thief’s Technical Setup
Entry Strategy:
Use the Thief Layered Entry approach with multiple buy limit orders to catch pullbacks:
🔔 Buy Limit 1: $6,460
🔔 Buy Limit 2: $6,480
🔔 Buy Limit 3: $6,500
🔔 Buy Limit 4: $6,520
💡 Pro Tip: Adjust layer levels based on your risk tolerance and market conditions. You can enter at any price level or add more layers for flexibility!
Entry Trigger: Pullback to the 200 SMA for optimal risk-reward.
Stop Loss (SL):
Suggested "Thief" SL: $6,440 (below key support).
⚠️ Note: Adjust your SL based on your risk management and strategy. Trade at your own risk, dear Traders!
Take Profit (TP):
Target: $6,700 (near resistance, potential overbought zone, or "police barricade" trap).
🚨 Note: Escape with profits before resistance hits! Set your TP based on your goals—don’t blindly follow mine. Take money at your own risk!
📡 Real-Time Market Data (10 Sept 2025, UTC+1)
Daily Change: +37.43 points (+0.57%)
YTD Performance: Record highs driven by AI optimism and Fed rate cut expectations.
😰😊 Fear & Greed Index
Current Sentiment: Neutral (Score: 51/100)
Breakdown:
📈 Market Momentum: Bullish (S&P 500 above 125-day MA).
🌬️ Volatility (VIX): Low (~15.04), signaling calm markets.
🛡️ Safe Haven Demand: Moderate (bonds lagging stocks).
💰 Junk Bond Demand: Slight greed (narrowing yield spreads).
⚖️ Options Activity: Balanced put/call ratio.
🏛️ Macro & Fundamental Analysis
Producer Price Index (PPI): August PPI fell -0.1% (vs. +0.3% expected), easing inflation concerns.
Fed Rate Cut: 100% probability of a 25-50 bps cut in September 2025.
Labor Market: Weaker-than-expected (911K jobs revised down through March 2025).
Corporate Earnings: Strong outlook (+10% growth in 2025, +13% in 2026).
Key Drivers:
🚀 AI investment surge (e.g., Oracle +30%, Nvidia strength).
🌍 Geopolitical risks (Poland-Russia tensions, Middle East concerns).
📉 Trade policy uncertainties (Trump tariff threats).
🐂🐻 Sentiment Analysis
Institutional Outlook: Cautiously optimistic
🏦 Deutsche Bank & Wells Fargo: S&P 500 targets at 7,000+ by 2026.
💡 Focus: AI capex and earnings resilience.
Retail Trader Mood: Mixed but leaning bullish
📈 Meme stock activity (e.g., GameStop +10%).
₿ Crypto correlation (Bitcoin at $111.9K, Solana at 7-month highs).
⚡ Why This Plan Stands Out
Technical Edge: The 200 SMA pullback is a proven strategy for swing/day traders, offering high-probability entries.
Thief Strategy: Layered limit orders maximize flexibility and reduce risk of missing the move.
Macro Support: Cooling inflation, Fed rate cuts, and AI-driven earnings create a bullish backdrop.
Sentiment Boost: Neutral sentiment with low volatility supports steady upside potential.
Risks to Watch: Geopolitical shocks, overvaluation concerns, and seasonal market weakness.
🔍 Related Pairs to Watch (in USD)
Nasdaq 100 CFD ( NASDAQ:NDX ): Tracks tech-heavy AI stocks driving S&P 500 momentum.
VIX ( TVC:VIX ): Monitor volatility spikes for potential reversals.
US 10-Year Treasury Yield ( TVC:TNX ): Impacts risk sentiment and stock valuations.
FX:USDJPY : Correlates with risk-on/risk-off market moves.
Bitcoin ( BITSTAMP:BTCUSD ): Tracks retail sentiment and risk appetite.
🚨 Key Takeaways
🏆 S&P 500 at record highs, supported by soft PPI and Fed cut expectations.
😎 Neutral sentiment with a greedy tilt if macro data improves.
🤖 AI trade dominates institutional flows, powering bullish momentum.
📅 Watch upcoming CPI data and Fed meeting for next catalysts.
✨ “If you find value in my analysis, a 👍 and 🚀 boost is much appreciated — it helps me share more setups with the community!”
#SPX500 #SwingTrading #DayTrading #ThiefStrategy #Bullish #TechnicalAnalysis #Macro #AI #FedRateCut #TradingIdeas

Will the AI frenzy drive US indices to new record highs again?
Despite the US government shutdown risk and elevated valuation concerns, US equities continued their upward rally, driven primarily by strength in AI-related stocks.
OpenAI’s valuation has surged to USD 500 billion, a sharp jump from the USD 300 billion valuation in an earlier SoftBank-led funding round earlier this year. This makes OpenAI the most valuable startup in the world, surpassing SpaceX.
Citigroup (C) raised its forecast for global AI spending, projecting USD 490 billion by 2026 (up from USD 420 billion) and cumulative hyperscaler investments by Amazon (AMZN), Microsoft (MSFT), and others to reach USD 2.8 trillion by 2029, up from the previous USD 2.3 trillion estimate.
US500 extended its rally to a new record high, maintaining a solid uptrend within the ascending channel. The diverging bullish EMAs point to the potential continuation of bullish momentum. If US500 breaches above the psychological resistance at 6800, the index may gain upward momentum toward the next psychological resistance at 7000. Conversely, if US500 breaks below the support at 6700, the index could retreat toward 6530.
S&P500 pushing to a new ATH?The S&P 500 (+0.34%) pushed to another record high as Q4 began, showing resilience despite ongoing US government shutdown risks and a weaker ADP private payrolls report, which signaled contraction. Markets leaned on expectations of faster Fed rate cuts, with Treasury yields falling sharply as investors reassessed labor market strength.
Sector drivers:
Gold and defensive plays gained as shutdown uncertainty supported safe-haven demand.
Tech outperformed: OpenAI’s $500bn valuation lifted AI-linked sentiment, with gains spilling into suppliers like Samsung and SK Hynix.
Cybersecurity risk weighed on software names after hackers claimed a breach of Oracle’s E-Business Suite, demanding ransom payments.
Apple slipped on reports it is halting Vision Pro updates to prioritize AI glasses.
Market tone: Optimism around rate cuts and AI-driven growth continues to underpin the S&P 500, but shutdown risks and labor market fragility remain key watchpoints for near-term volatility.
Key Support and Resistance Levels
Resistance Level 1: 6750
Resistance Level 2: 6770
Resistance Level 3: 6800
Support Level 1: 6680
Support Level 2: 6660
Support Level 3: 6640
This communication is for informational purposes only and should not be viewed as any form of recommendation as to a particular course of action or as investment advice. It is not intended as an offer or solicitation for the purchase or sale of any financial instrument or as an official confirmation of any transaction. Opinions, estimates and assumptions expressed herein are made as of the date of this communication and are subject to change without notice. This communication has been prepared based upon information, including market prices, data and other information, believed to be reliable; however, Trade Nation does not warrant its completeness or accuracy. All market prices and market data contained in or attached to this communication are indicative and subject to change without notice.

S&P500 (US500): Another BoS
US500 updates the all-time high yesterday, breaking a resistance
cluster based on a previous high.
It opens a potential for more growth now.
Next goal - 6750
❤️Please, support my work with like, thank you!❤️
I am part of Trade Nation's Influencer program and receive a monthly fee for using their TradingView charts in my analysis.

S&P500 Short-term Bull Flag formed.The S&P500 index (SPX) has been trading within a Channel Up since the July 31 High. The price is currently on its 4H MA50 (blue trend-line), forming a Bull Flag after a 4H MA100 (green trend-line) rebound last Thursday.
This is similar to the Bull Flags of August 25 and 05, which both ended with a rise to the 1.236 Fibonacci extension. Even the 4H RSI sequences among the 3 fractals are similar with their Lower Highs structures. The only difference is that the price bottomed this time on the 4H MA100 (as mentioned), instead of the 4H MA200 (orange trend-line) of the previous 3 times.
As a result, if this Bull Flag holds, we expect a quick rally to 6720 (just under Fib 1.236).
-------------------------------------------------------------------------------
** Please LIKE 👍, FOLLOW ✅, SHARE 🙌 and COMMENT ✍ if you enjoy this idea! Also share your ideas and charts in the comments section below! This is best way to keep it relevant, support us, keep the content here free and allow the idea to reach as many people as possible. **
-------------------------------------------------------------------------------
💸💸💸💸💸💸
👇 👇 👇 👇 👇 👇

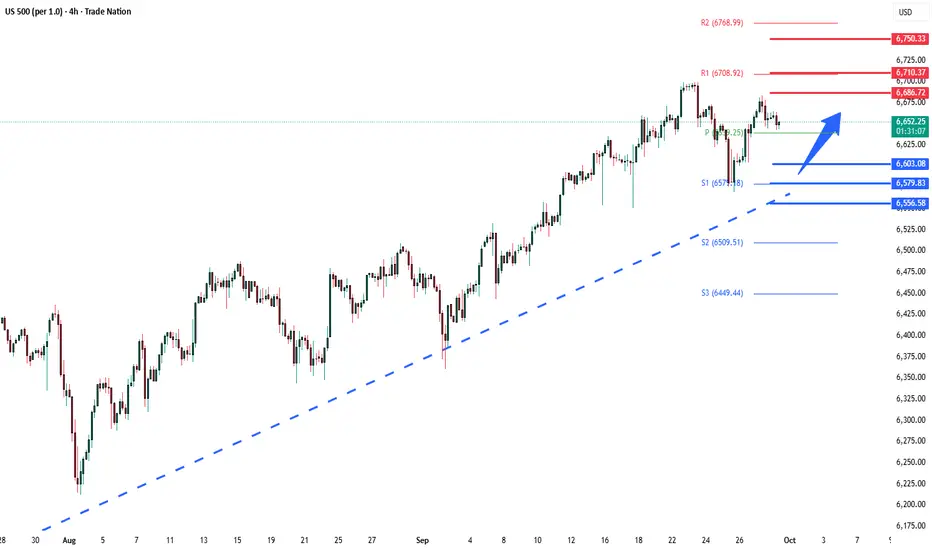
S&P500 uptrend continuation?Key Drivers for S&P 500
Government shutdown risk: With no deal in sight and a 79% market-implied probability of a shutdown tomorrow, headline risk is elevated. Historically, most shutdowns have been short, but lingering political uncertainty could weigh on sentiment.
Rates & bonds: A global bond rally (10yr USTs -3.6bps) supported equities, particularly rate-sensitive and cyclical sectors. Lower yields are helping housing-linked names, as shown by the strong pending home sales data.
Commodities: Oil’s sharp decline (-3.45%, biggest drop since June) reduced inflation concerns and eased pressure on equities.
Sector performance: Gains were broad-based; cyclical sectors and construction materials led, while tech (NASDAQ +0.48%, Mag 7 +0.37%) outperformed. Equal-weighted S&P also rose (+0.32%), confirming breadth.
Safe haven demand: Gold’s rally highlights investor caution despite equity gains—suggesting hedging activity alongside risk-on moves.
S&P 500 Trading Takeaway
Equities remain resilient, closing near record highs with support from falling yields and softer oil prices. However, government shutdown risks and political uncertainty could cap upside near term. Expect headline-driven volatility with cyclical and tech sectors best positioned to extend gains if yields stay contained.
Key Support and Resistance Levels
Resistance Level 1: 6686
Resistance Level 2: 6710
Resistance Level 3: 6750
Support Level 1: 6600
Support Level 2: 6580
Support Level 3: 6556
This communication is for informational purposes only and should not be viewed as any form of recommendation as to a particular course of action or as investment advice. It is not intended as an offer or solicitation for the purchase or sale of any financial instrument or as an official confirmation of any transaction. Opinions, estimates and assumptions expressed herein are made as of the date of this communication and are subject to change without notice. This communication has been prepared based upon information, including market prices, data and other information, believed to be reliable; however, Trade Nation does not warrant its completeness or accuracy. All market prices and market data contained in or attached to this communication are indicative and subject to change without notice.
Futu Holdings a New ath or time for a correctionIn this video I go over the previous price action and develop a plan of where to look for a future entry if you are accumulating Futu .
I demonstrate using a standard fib pull how price may gravitate back to .786/.886 fib levels over time as well as what to look for in the event we push up for a new Ath .
20 Nov we have earnings and despite the past track record of earnings have surprised the market with positive results I question if the upcoming does the same or will it be the catalyst for the correction .

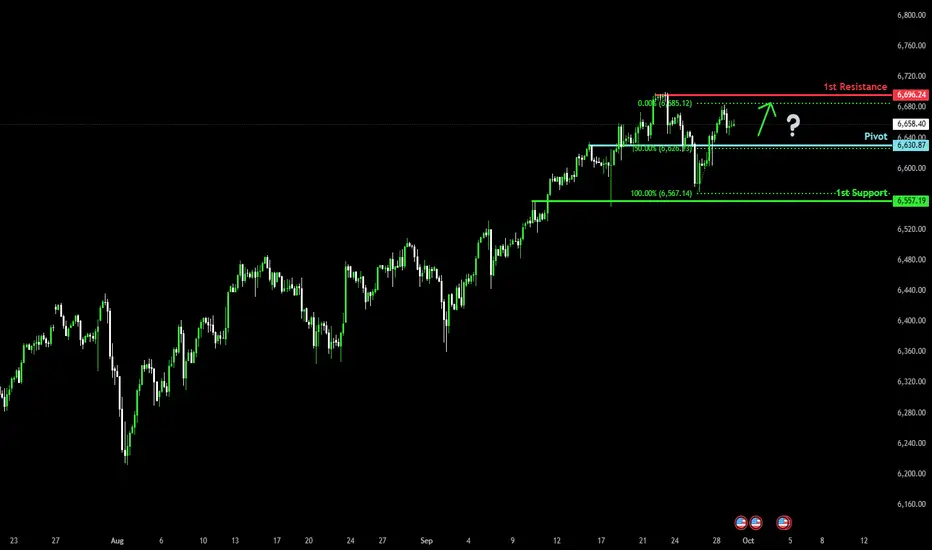
Falling towards 50% Fibonacci support?S&P500 (US500) is falling towards the pivot, which acts as an overlap support that aligns with t e 50% Fibonacci retracement and could bounce to the 1st resistance which has been identified as a swing high resistance.
Pivot: 6,630.87
1st Support: 6,557.19
1st Resistance: 6,696.24
Disclaimer:
The above opinions given constitute general market commentary, and do not constitute the opinion or advice of IC Markets or any form of personal or investment advice.
Any opinions, news, research, analyses, prices, other information, or links to third-party sites contained on this website are provided on an "as-is" basis, are intended only to be informative, is not an advice nor a recommendation, nor research, or a record of our trading prices, or an offer of, or solicitation for a transaction in any financial instrument and thus should not be treated as such. The information provided does not involve any specific investment objectives, financial situation and needs of any specific person who may receive it. Please be aware, that past performance is not a reliable indicator of future performance and/or results. Past Performance or Forward-looking scenarios based upon the reasonable beliefs of the third-party provider are not a guarantee of future performance. Actual results may differ materially from those anticipated in forward-looking or past performance statements. IC Markets makes no representation or warranty and assumes no liability as to the accuracy or completeness of the information provided, nor any loss arising from any investment based on a recommendation, forecast or any information supplied by any third-party.
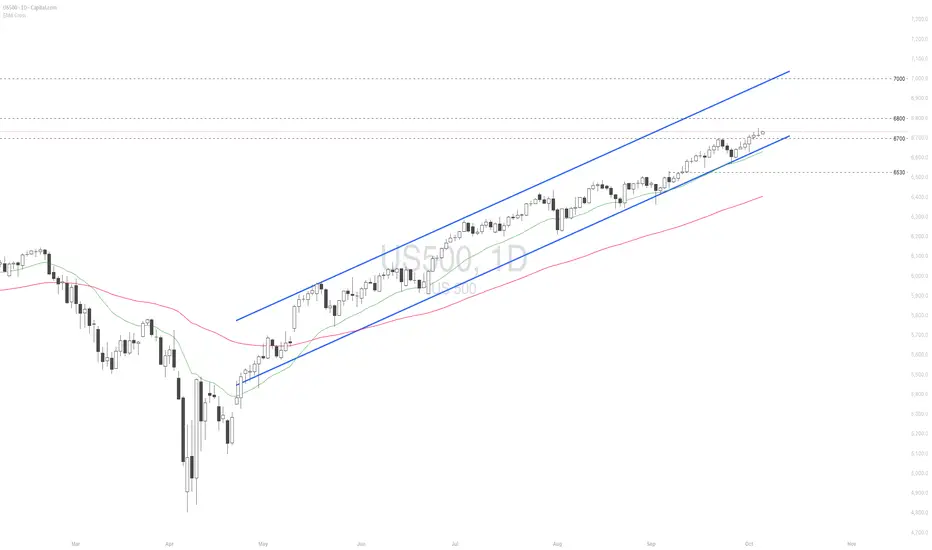
Despite AI valuation pressures, US500 outlook remains positive.
Robust US data tempered Fed rate-cut bets, dragging equities lower for a third day, though investors expect the pullback to be short-lived. Nvidia’s (NVDA) 100 bln USD investment in OpenAI has raised questions over vendor financing risks, deepening worries over elevated valuations. Still, institutions expect US equities to hold a tactical bullish stance. JPMorgan (JPM) projected that while a government shutdown and fragile sentiment may trigger midweek weakness, solid economic growth, a resilient labor market, and AI momentum could drive the S&P; 500 to 7,000 by year-end.
US500 remains within the ascending channel, sustaining its steady uptrend. After briefly testing EMA21 and the channel’s lower bound, the index rebounded, indicating the potential extension of a bullish structure. If US500 continues to hold within the channel, the index may gain upward momentum toward the resistance at 6700. Conversely, if US500 breaks below the channel’s lower bound and EMA21, the index could retreat toward the support at 6530.

S&P500 corrective pullback Recent moves: The S&P 500 (-0.36%) extended losses, still weighed by the AI-driven selloff earlier in the week. Futures have recovered about half of yesterday’s drop, but overall momentum looks paused.
Macro drivers:
US housing data + firmer oil prices dampened expectations for rapid Fed rate cuts.
This pushed Treasury yields higher, with a fresh steepening of the curve. 10yr yields are back near pre-payrolls levels (+10–15bps since the FOMC).
Today’s jobless claims are key after last week’s sharp drop, with tomorrow’s core PCE the bigger risk event.
Politics:
US government shutdown risks escalated, with the White House ordering contingency firings if funding lapses. Market anxiety may rise as deadlines loom.
Geopolitics in focus: Erdogan’s White House visit could bring defense deals (Boeing, Lockheed Martin) and NATO tensions remain over Russia.
Implication for S&P 500 trading:
Near-term tone is cautious, with yields back up and Fed easing hopes questioned.
Watch jobless claims for confirmation of labor resilience and core PCE tomorrow as the next major directional driver.
Shutdown risks add headline volatility, while defense sector stocks could outperform if US–Turkey talks deliver aircraft orders.
Key Support and Resistance Levels
Resistance Level 1: 6670
Resistance Level 2: 6700
Resistance Level 3: 6747
Support Level 1: 6550
Support Level 2: 6530
Support Level 3: 6500
This communication is for informational purposes only and should not be viewed as any form of recommendation as to a particular course of action or as investment advice. It is not intended as an offer or solicitation for the purchase or sale of any financial instrument or as an official confirmation of any transaction. Opinions, estimates and assumptions expressed herein are made as of the date of this communication and are subject to change without notice. This communication has been prepared based upon information, including market prices, data and other information, believed to be reliable; however, Trade Nation does not warrant its completeness or accuracy. All market prices and market data contained in or attached to this communication are indicative and subject to change without notice.
