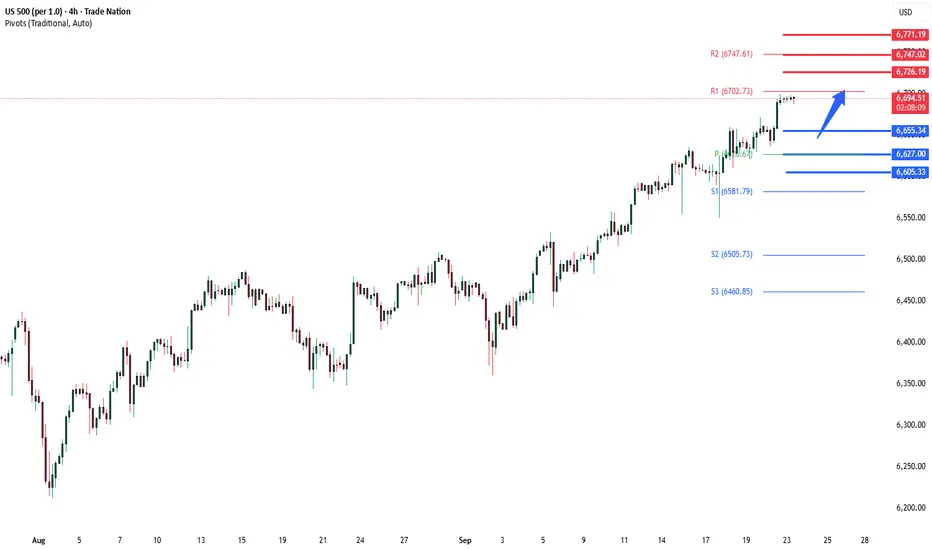
S&P500 push to another ATH?Momentum & Leadership:
The index hit another record high yesterday (+0.44%), with strength again concentrated in tech and the Magnificent 7. Nvidia’s AI-driven deal with OpenAI (+3.93%) fuelled risk appetite and extended the rally. YTD gains show a narrow breadth: S&P 500 +13.8% vs equal-weighted S&P +7.7%.
Macro Data Today:
PMIs (US, UK, Eurozone, Germany, France): Watch for signs of resilience in services vs persistent weakness in manufacturing. A softening read could weigh on cyclicals but leave tech defensives relatively insulated.
US regional activity (Philly Fed services, Richmond Fed manufacturing, business conditions): Key for growth sentiment after mixed signals in recent weeks.
Q2 current account balance: Low market impact.
Central Banks:
Fed Chair Powell, Bowman, Bostic: Powell’s remarks could influence rate cut expectations post-FOMC. A cautious tone might temper equity momentum, while dovish signals could extend the rally.
Trading Implications:
The S&P’s rally remains narrowly led by tech/AI, leaving breadth weak.
Today’s PMI prints and Powell’s speech are the main potential volatility drivers – stronger growth data may challenge Fed easing expectations (pressuring valuations), while softer data could reinforce rate-cut hopes and keep the rally alive.
Watch semiconductors and Mag-7 for leadership; broader market participation is still lagging.
Key Support and Resistance Levels
Resistance Level 1: 6726
Resistance Level 2: 6747
Resistance Level 3: 6770
Support Level 1: 6655
Support Level 2: 6627
Support Level 3: 6605
This communication is for informational purposes only and should not be viewed as any form of recommendation as to a particular course of action or as investment advice. It is not intended as an offer or solicitation for the purchase or sale of any financial instrument or as an official confirmation of any transaction. Opinions, estimates and assumptions expressed herein are made as of the date of this communication and are subject to change without notice. This communication has been prepared based upon information, including market prices, data and other information, believed to be reliable; however, Trade Nation does not warrant its completeness or accuracy. All market prices and market data contained in or attached to this communication are indicative and subject to change without notice.
Us500
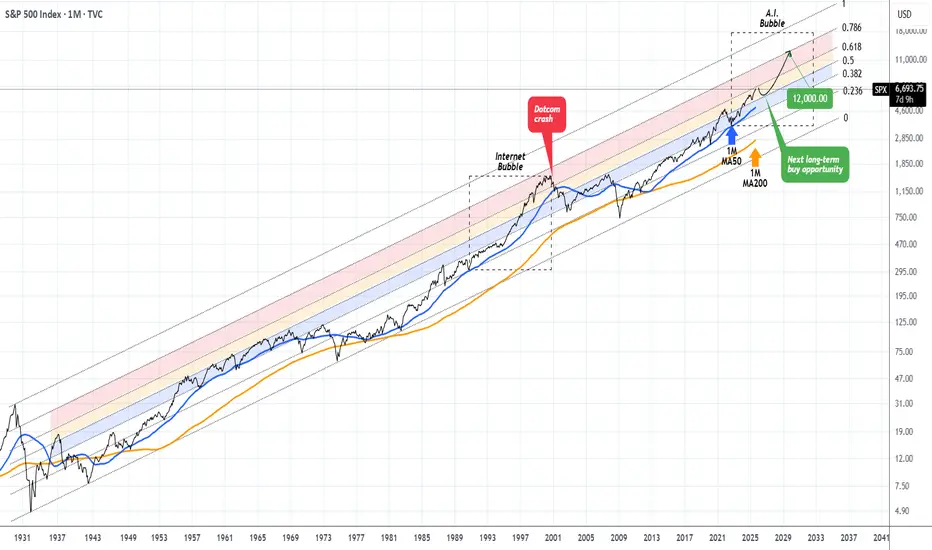
S&P500 approaching a Resistance that was last tested in 1998 !!This isn't the first time we present you this chart, in fact from time to time (usually on a quarterly basis) we like to bring this forward with some adjustments in order to help us maintain a long-term perspective.
And that technically shows the S&P500 index (SPX) trading within a century long Fibonacci Channel Up (since the 2029 Great Depression) with clear Bull and Bear Cycles. We will not get into much details on those, as they've been analyzed extensively in previous publications but we will point out that currently we remain inside a multi-year Bull Cycle.
In fact, since the November 2022 market bottom, we believe we've entered the A.I. Bubble, which is in our opinion (perhaps a more aggressive) version of the Internet Bubble of the 1990s. Again this has been analyzed extensively before.
Right now the index is approaching the top of the 0.5 - 0.618 Fib Zone (orange range). The one above (0.618 - 0.786 Fib, red Zone), was first entered in February 1998 and exited for good at the start of the Dotcom crash in February 2001. Since then, the market never even touched it (almost 25 years).
We believe that a marginal test and break inside this 'ghost zone' could be attempting by late 2025 - Q1 2026 and then a strong correction back near the 1M MA50 (blue trend-line) will present the next long-term buy opportunity that could fuel the A.I. Bubble until it finally bursts within 2030 - 2032.
Until then, a 12000 Target on SPX isn't at all an unrealistic one, in our opinion.
-------------------------------------------------------------------------------
** Please LIKE 👍, FOLLOW ✅, SHARE 🙌 and COMMENT ✍ if you enjoy this idea! Also share your ideas and charts in the comments section below! This is best way to keep it relevant, support us, keep the content here free and allow the idea to reach as many people as possible. **
-------------------------------------------------------------------------------
💸💸💸💸💸💸
👇 👇 👇 👇 👇 👇
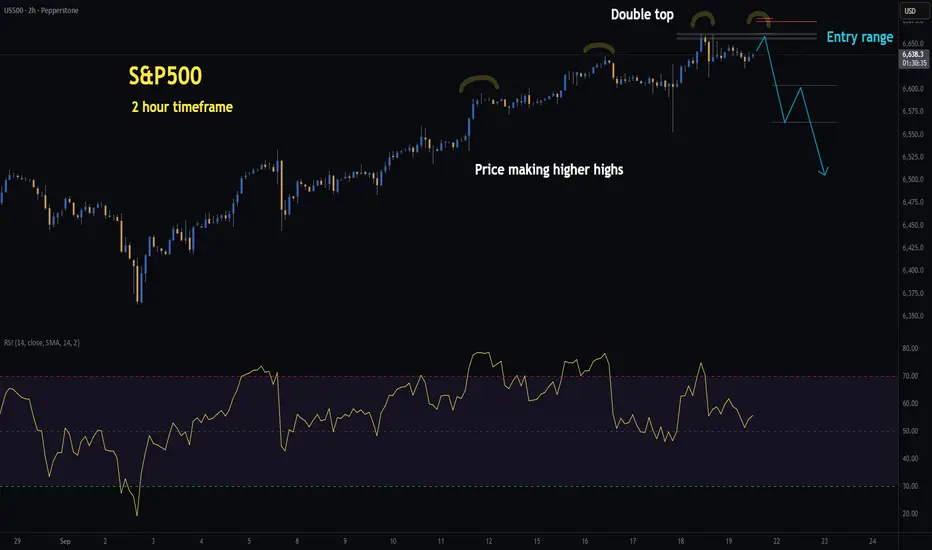
US500 | H2 Double Top | GTradingMethodHello Traders, I hope you’ve all had a profitable week!
🧐 Market overview:
The US500 has pushed into new highs since the FOMC and remains in an uptrend. However, price is advancing on weakening momentum — higher highs in price while RSI prints lower highs, a classic case of negative divergence. My system is flagging this as a potential double top setup on the 2H timeframe, but I am still waiting for confirmation before entering a short.
Interestingly, while my system highlights bearish risk, there are also bullish signals worth noting:
- Daily CMF money flow shows no negative divergence.
- Daily MACD remains on a buy signal.
- The recent rate cut adds further liquidity and stimulus to markets.
📊 My trade plan:
Risk/Reward: 3.6 – 4.5
Entry: 6,655.6 – 6,661.8
Stop Loss: 6,674.8 – 6,678.6
Take Profit 1 (50%): 6,604
Take Profit 2 (50%): 6,563
The entry and stop ranges vary depending on where the setup confirms within the zone.
Tip:
Divergences often act as early warning signs of trend exhaustion, but they work best when combined with pattern confirmation (like a double top) rather than traded in isolation.
🙏 Thanks for checking out my post!
Make sure to follow me to catch the next idea and keen to hear if you are trading the US500? :)
Please note: This is not financial advice. This content is to track my trading journey and for educational purposes only.
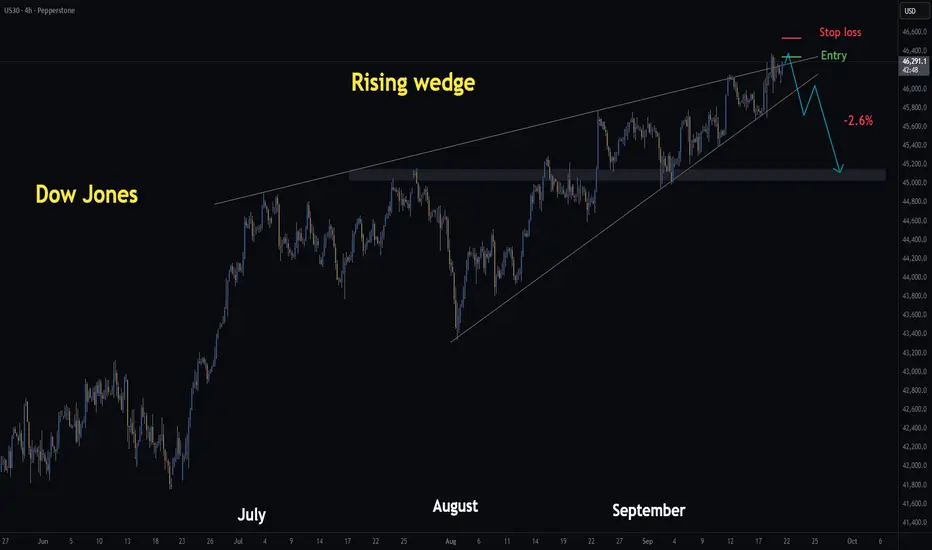
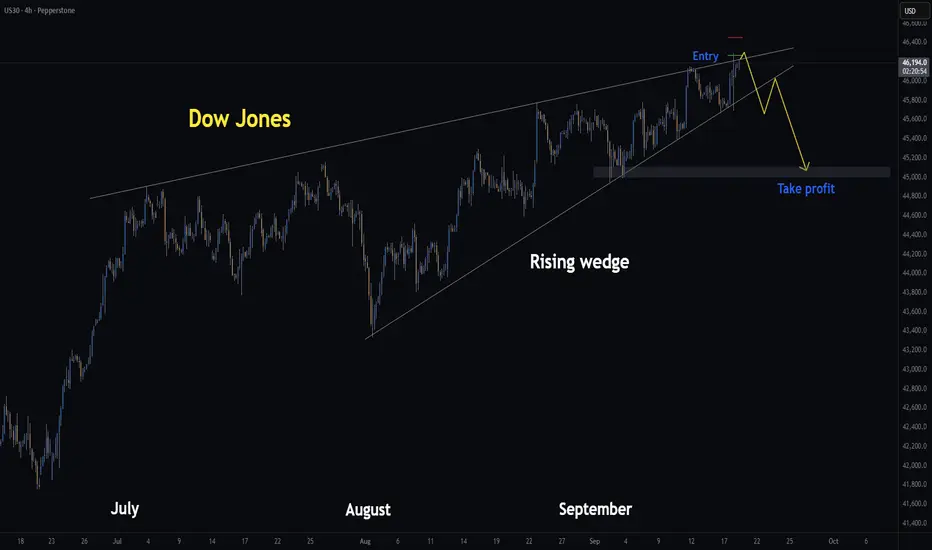
DowJones | H4 Rising Wedge | GTradingMethodHello Traders,
Yesterday I shared a short setup on the Dow Jones using the rising wedge pattern. I entered at 46,267 and exited with a small profit at 46,179. I exited because I did not like the reaction at that level and anticipating a better entry.
Today, I’m looking to re-enter if price reaches 46,343, which could form a potential double top on the chart.
🧐 Market Overview:
Rising wedges generally act as bearish reversal patterns, that said, the broader market remains bullish following the FOMC, so I’ll be risking less and proceeding with caution.
However, the VIX has been sitting near multi-month lows, which often precedes sharp moves. If volatility picks up post-FOMC, rising wedge patterns could act as early warning signs of a pullback.
So I am willing to risk a small amount and potentially be rewarded BIG!
📊 Trade Plan:
Risk/Reward: 6.7
Entry: 46,343
Stop Loss: 46,539
Take Profit 1 (50%): 45,000
Take Profit 2 (50%): 45,000
Also, if this plays out, I expect NAS and S&P to fall too which will likely drag crypto with it.
Thanks for checking out my post!
I would love to hear if you have any rising wedge trading tips? And if you are trading the Dow Jones or S&P today?
Please note: This is not financial advice. This content is to track my trading journey and for educational purposes only.
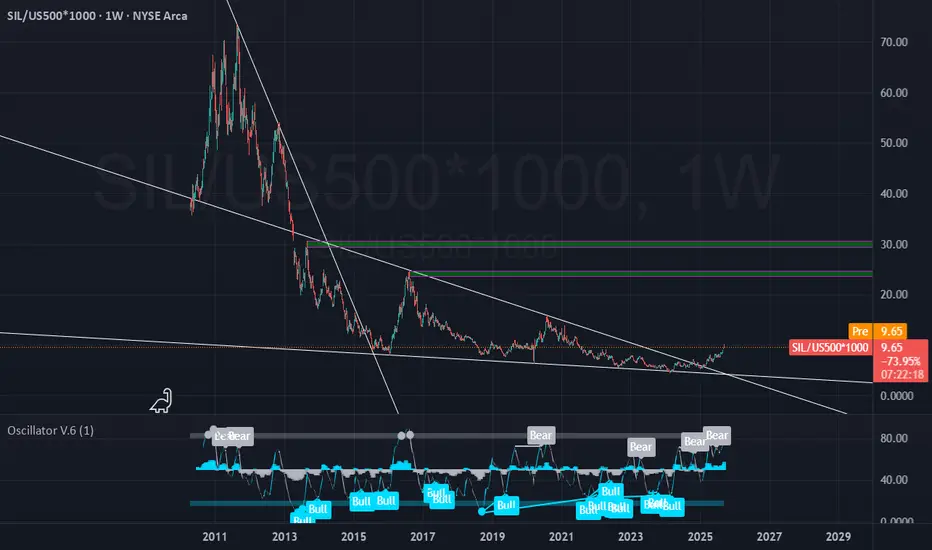
Silver: From Underperforming to OutperformingThe Silver miner ETF has been underperforming the US Stock market for quiet some time.
The times are shifting, seeing the breakout off the Falling Wedge.
Targets from this moment: 100% Minimum
Potentially: 200%+
TLDR: for maximazing performance, you are better off owning SIL ETF (or silver stocks) then the S&P500.
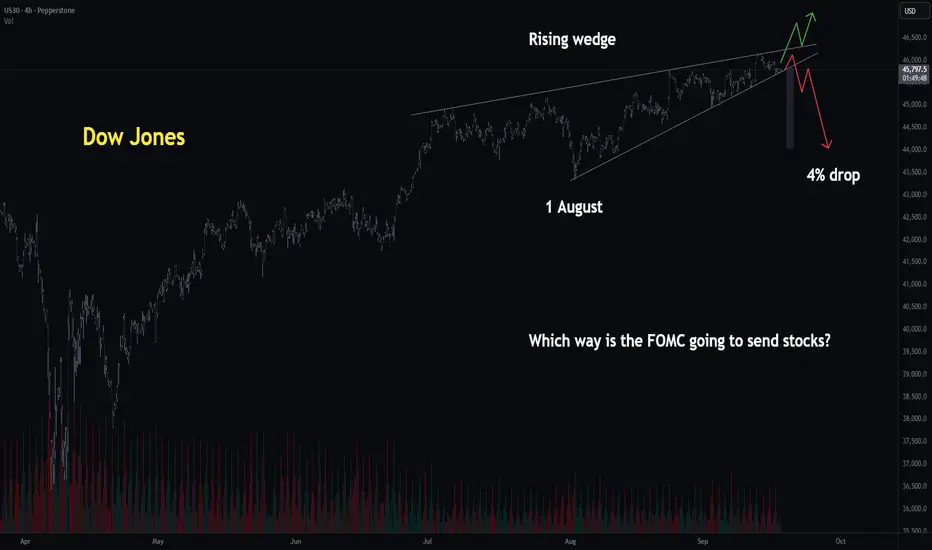
Dow Jones | H4 Rising Wedge | GTRadingMethod👋 Hello Traders.
Yesterday I mentioned I’d be watching for a breakout and retest setup — that plan still stands. However, I’ve also taken a short position off the diagonal resistance line.
🧐 Market Overview:
I’m currently seeing rising wedge structures across Nasdaq, S&P, Russell 2000, and Dow Jones. These patterns typically lean bearish, and I can’t ignore the confluence. That said, wedges can fail, and with the market leaning bullish after of the FOMC announcement, I’m aware this is swimming against the trend.
📊 Trade Plan:
Risk/Reward: 6.7
Entry: 46 267
Stop Loss: 46 450
Take Profit 1 (50%): 45 000
Take Profit 2 (50%): 45 000
(I’m already short from 46 267 and will look to add if price retests that level.)
💡 GTradingMethod Tip:
Bearish patterns like rising wedges can offer high R/R setups, but always remember — strong bullish backdrops (like major data events) can cause them to fail. Risk management is everything.
🙏 Thanks for checking out my post!
Make sure to follow me to catch the next idea and share your thoughts on what you think the markets will do today and how you would trade rising wedges :)
📌 Please note:
This is not financial advice. This content is to track my trading journey and for educational purposes only.
S&P 500 | H1 Rising Wedge | GTradingMethodHello Traders,
Similar to the Dow Jones setup, the US500 is also showing a rising wedge pattern. Yesterday, price broke to the downside and is now retesting the wedge — a classic technical setup.
📊 Trade Plan:
Risk/Reward: 5.4
Entry: 6 653.6
Stop Loss: 6 676.8
Take Profit: 6 526
🧐 Market Overview:
Rising wedges are typically bearish continuation/reversal patterns, and the current retest provides an opportunity to align with that probability. That said, wedges can fail, especially around major news events, so risk management is key specially with markets being bullish after the fomc announcement.
💡 GTradingMethod Tip:
When trading wedge retests, always allow the market to confirm direction. A strong rejection on the retest adds confluence and avoids false breakouts.
🙏 Thanks for checking out my post!
Make sure to follow me to catch the next idea and please share your thoughts — I’d love to hear them.
📌 Please note:
This is not financial advice. This content is to track my trading journey and for educational purposes only.

S&P500 Key support at 6600FOMC Takeaways
Fed cut rates 25bps to 4.00–4.25%, as expected.
Powell framed it as a “risk-management cut”, tempering hopes for an aggressive easing cycle.
Dot plot now signals 75bps total cuts in 2025 (vs. 50bps before), with softer growth/labour tone.
Markets saw a whipsaw: initial rally → Treasury selloff → equities flat by close.
Market Moves
Equities: S&P 500 closed -0.10%, after falling as much as -0.84% intraday.
Sector split: IT lagged (-0.70%), but financials (+0.96%) and consumer staples (+0.90%) outperformed.
Futures (Asia session): S&P +0.49%, Nasdaq +0.73% → rebound tone.
Rates: Yields higher post-FOMC (10yr +6bps to 4.09%) but down 2–2.5bps this morning.
FX: Dollar Index +0.18% overnight, extending gains despite initial dip.
Trading Implications
Market focus: Is the economy strong enough to sustain gains with only a gradual Fed cutting path?
Bull case: Rate-sensitive domestic sectors (financials, staples, housing-related) showing resilience; futures pointing higher.
Bear case: Transports lag industrials (Dow at records, transports weaker) – a potential warning sign for breadth of the rally.
Catalyst today: FedEx earnings – a key test for global trade/transport demand and market breadth confirmation.
Key Support and Resistance Levels
Resistance Level 1: 6660
Resistance Level 2: 668
Resistance Level 3: 6700
Support Level 1: 6600
Support Level 2: 6570
Support Level 3: 6550
This communication is for informational purposes only and should not be viewed as any form of recommendation as to a particular course of action or as investment advice. It is not intended as an offer or solicitation for the purchase or sale of any financial instrument or as an official confirmation of any transaction. Opinions, estimates and assumptions expressed herein are made as of the date of this communication and are subject to change without notice. This communication has been prepared based upon information, including market prices, data and other information, believed to be reliable; however, Trade Nation does not warrant its completeness or accuracy. All market prices and market data contained in or attached to this communication are indicative and subject to change without notice.

S&P500 |H1 Rising Wedge | GTradingMethodHello Traders, happy Tuesday!
🧐 Market Overview:
I’ve been closely tracking the rising wedge forming on the 1 hour chart. While this isn’t a pattern I normally trade, the structure caught my attention, and I decided to expose a small amount of risk.
Rising wedges are generally bearish in nature - they don't always have to be though. If I zoom out, markets are over bought on the RSI and there are rsi divergences on multiple timeframes. This is one signal that markets need to cool off before advancing further. So bearing in mind the RSI divergences and the bearish pattern, I have decided to risk a small amount.
Further, if this pattern plays out, it will likely bring crypto down with it.
Ideally, I’d prefer to see a clean double top develop before committing more exposure on the short side.
📊 Trade Plan:
Entry: 6 633.7
Stop Loss: 6 648.7
Take Profit: Not predefined (will target structural support levels highlighted on the chart)
🙏 Thanks for checking out my post!
Make sure to follow me to catch the next idea and please share your thoughts – I’d like to hear if anyone else is trading this pattern or if you have any tips on how to trade it.
📌 Please note:
This is not financial advice. This content is to track my trading journey.

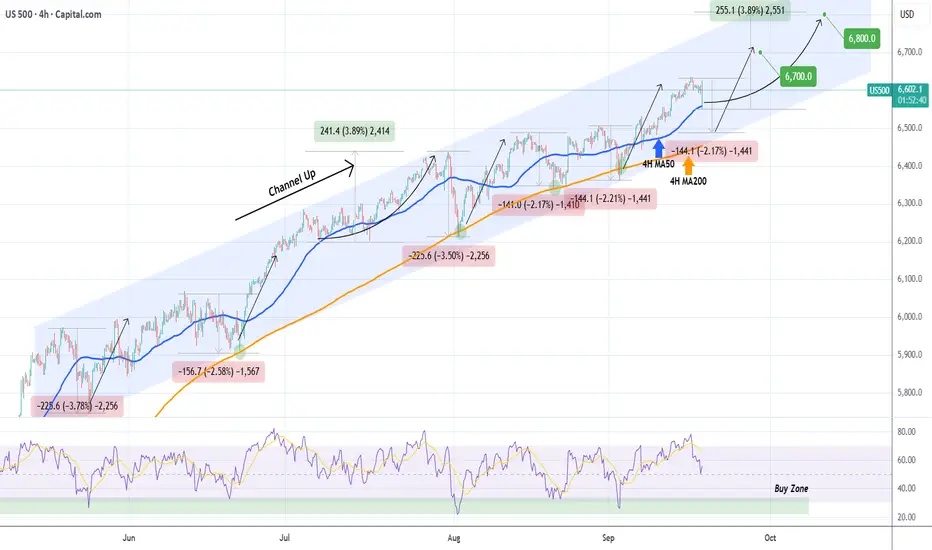
S&P500 Risks drop to the 4H MA200 if MA50 fails.The S&P500 index (SPX) is experiencing a strong intra-day correction that just hit its 4H MA50 (blue trend-line) for the first time since September 05. As long as this holds, we expect a gradual rise, targeting 6800 (representing a +3.89% increase similar to July's).
A 1D candle closing below the 4H MA50 however, has historically paved the way to more selling within the 4-month Channel Up, that touched the 4H MA200 (orange trend-line) before rebounding. If that candle closing takes place, we will close the 4H MA50 buy on minimum loss and buy on the 4H MA200, targeting 6700 (sharp rebound similar to all 4H MA200 bounces).
Keep also an eye on the 4H RSI Buy Zone. It has given the 5 most optimal buy entries during these 4 months. Note also that the 4H MA200 has been holding as Support since the April 25 break-out.
-------------------------------------------------------------------------------
** Please LIKE 👍, FOLLOW ✅, SHARE 🙌 and COMMENT ✍ if you enjoy this idea! Also share your ideas and charts in the comments section below! This is best way to keep it relevant, support us, keep the content here free and allow the idea to reach as many people as possible. **
-------------------------------------------------------------------------------
💸💸💸💸💸💸
👇 👇 👇 👇 👇 👇
S&P500 | H2 Double Top | GTradingMethodHello Traders,
Watching the S&P for a potential double top.
It also aligns with the retest of the rising wedge, which is has already broken to the downside. This kind of confluence gives me extra excitement about a trade.
What I still need to happen for me to open the trade:
- H2 candle close in the entry range
- H2 candle that closes in the range needs a certain closure rate
- RSI needs to create another divergence
- Volume needs to be lower on T2, although my system does give exceptions if there is a data release, in this case FOMC, so exception will likely apply.
📊 Trade Plan:
Risk/reward = Between 3.3 and 4.3
Entry price = Between 6630 and 6639.9
Stop loss price = Between 6649.2 and 6656.8
Take profit level 1 (50%) = 6576
Take profit level 2 (50%) = 6553
I would ideally like my stop loss above the rising wedge, that way it needs to break through both barriers.
Also, if this pattern plays out, I think it will drag the crypto market down with it... Unfortunately.
💡 GTradingMethod Tip:
Always predefine your risk before entering a trade. This is a non negotiable to becoming a professional trader.
🙏 Thanks for checking out my post!
Make sure to follow me for updates and let me know in the comments — do you see the wedge retest as bearish, or do you think the bulls have more room to run?
📌 Please note: This is not financial advice. This content is to track my trading journey and for educational purposes only.
Peace
G

Dow Jones | H4 Rising Wedge | GTradingMethodHello everyone who reads this,
The big question on everyone’s mind: Which way will the FOMC interest rate decision send stocks and gold?
Here’s my two cents and how I plan to approach it.
🧐 Market Overview:
I’m seeing rising wedges on both the Dow Jones and the S&P500 across multiple timeframes. Rising wedges typically lean bearish.
Dow Jones: To play it safe, I’ll wait for a break + retest. If it breaks down, I’ll wait for the retest and then look to go short and vice a versa on the long side.
FOMC generally causes a lot of volatility and I don't want to get whipsawed around, hence I am taking a more conservative approach by trading the retest, which might only happen tomorrow.
S&P500: The hourly rising wedge has already broken to the downside. On the retest, I’ll be watching for short setups. If the retest holds, it would also confirm a double top, which adds further confluence.
If stocks break down on FOMC, expect BTC and alts to feel the pressure.
🙏 Thanks for checking out my post! It would be great to hear what your thoughts are about the interest rate decision and what trades you are looking at. Lets make money together!
📌 Please note: This is not financial advice. This content is to track my trading journey and for educational purposes only.
DOW JONES (US30): Your Plan to Trade FOMC Today
US30 keeps coiling on a recently broken daily key resistance
that turned into a support after a breakout.
To buy the market with confirmation after today's rate decision,
concentrate your attention on a double bottom pattern on a 4H time frame.
A bullish breakout of its neckline and a 4H candle close above 46850
will provide a reliable signal.
A bullish continuation will be expected to a current structure high then - 46087.
❤️Please, support my work with like, thank you!❤️
I am part of Trade Nation's Influencer program and receive a monthly fee for using their TradingView charts in my analysis.

S&P500 | H1 Head and Shoulders | GTradingMethod👋 Hello again fellow Traders,
I already have a short open from 6 633.7, but I’d love to see a Head & Shoulders pattern develop so I can scale into more shorts.
So far, the build-up looks promising — volume has picked up significantly on this drop, which is a bearish signal. That said, I’m still waiting on confirmation before committing further.
📊 Trade Plan:
Risk/Reward: 3.1
Entry: 6 614.3
Stop Loss: 6 625.4
Take Profit 1 (50%): 6 586.9
Take Profit 2 (50%): 6 570.2
🔎 What I Need to See First:
A 30m candle to reach and close in range
Lower volume on the candle that closes in range vs. the left shoulder
More candles forming the right shoulder
💡 GTradingMethod Tip:
Patience is key. The best trades usually come when all conditions align — not just some of them.
🙏 Thanks for checking out my post! Make sure to follow me for updates, and keen to hear what your prediction is.
📌 Please note: This is not financial advice. This content is to track my trading journey and for educational purposes only.

Will Fed rate cuts provide further upside for US500?
On the eve of the FOMC meeting, US indices traded cautiously as stronger August retail sales reignited concerns over inflation risks. Retail sales rose 0.6% MoM, beating the 0.3% consensus. Charles Schwab noted that despite weak August jobs data, consumer spending remains resilient, supporting Q3 growth.
Industrial production also surprised to the upside at 0.1% (cons. -0.1%), with manufacturing output—the largest component—up 0.2% on a rebound in autos.
US500 remains within the ascending channel, maintaining a steady uptrend. The widening gap between both EMAs suggests the potential continuation of bullish momentum. If US500 holds above both EMAs, the index may gain upward momentum toward the psychological resistance at 6700. Conversely, if US500 breaks below the 6530 support, the index could retreat toward 6340.

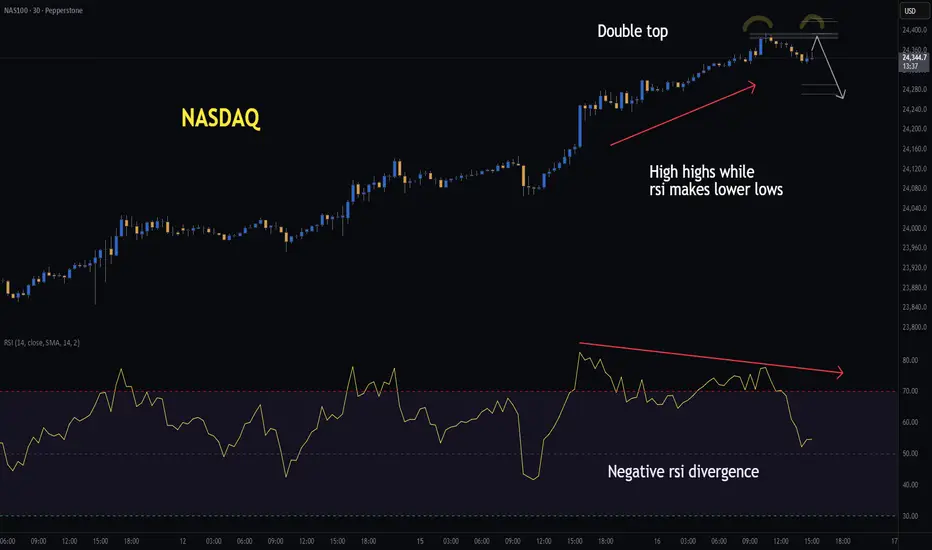
NASDAQ | H1 Double Top | GTradingMethodHello Traders,
I’m watching the Cash100 for a potential double top that could set up a short opportunity. Price is currently making higher highs while RSI is making lower lows — a clear sign of weakening buying momentum, also known as negative RSI divergence.
As further confluence, we have the FOMC tomorrow, and markets often prefer to de-risk ahead of such events. Also, there is a rising wedge on the S&P500 on the hourly chart and the chance that there is also a potential double top on the 30min timeframe.
✅ Conditions before entry:
- 30min candle must close within the range and at the correct level
- The closing candle must meet my required closure rate
- Ideally, volume should be lower (though I’ll allow an exception given it will be the U.S open)
- RSI should confirm with another divergence
📊 Trade Plan:
Risk/Reward: 2.9
Entry: 24,385.1
Stop Loss: 24,418.6
Take Profit 1 (50%): 24,290
Take Profit 2 (50%): 24,271
💡 GTradingMethod Tip:
Patterns like double tops are powerful, but they’re strongest when combined with momentum divergence. Always confirm multiple factors before entering.
🙏 Thanks for checking out my post!
Follow me for the next update and feel free to share your thoughts below — I’d love to hear them.
📌 Please note: This is not financial advice. This content is to track my trading journey and for educational purposes only.
S&P500 Key Trading levels Optimism on US-China relations drove markets higher after Trump’s positive Madrid meeting comments and Treasury Sec. Bessent’s note on a TikTok deal framework.
The NASDAQ Golden Dragon China index (+0.87%) outperformed as US-listed Chinese firms rallied.
This lifted global equities: S&P 500 +0.47% (new ATH), Stoxx 600 +0.42%, both near record highs.
Tech led gains: NASDAQ +0.94%, Magnificent 7 +1.95%. Alphabet hit $3trn valuation, Tesla +3.56% on Musk’s share purchase. Nvidia slipped (-0.04%) on China antitrust news.
Despite broad weakness under the surface, the S&P 500 is now +12.47% YTD and has risen in 6 of the past 7 weeks—its strongest stretch in 2025.
Conclusion for S&P 500 today:
With sentiment anchored by trade optimism and tech leadership, momentum remains upward, but concentration in a few mega-cap names alongside weaker breadth suggests potential for near-term consolidation even as the broader index holds bullish bias.
Key Support and Resistance Levels
Resistance Level 1: 6640
Resistance Level 2: 6660
Resistance Level 3: 6680
Support Level 1: 6575
Support Level 2: 6550
Support Level 3: 6530
This communication is for informational purposes only and should not be viewed as any form of recommendation as to a particular course of action or as investment advice. It is not intended as an offer or solicitation for the purchase or sale of any financial instrument or as an official confirmation of any transaction. Opinions, estimates and assumptions expressed herein are made as of the date of this communication and are subject to change without notice. This communication has been prepared based upon information, including market prices, data and other information, believed to be reliable; however, Trade Nation does not warrant its completeness or accuracy. All market prices and market data contained in or attached to this communication are indicative and subject to change without notice.

S&P500 | H1 Double Top | GTradingMethod👋 Hello traders,
Tried shorting a potential head and shoulders on the 1H chart earlier — it failed. Thankfully, one of my exit rules triggered before my stop loss, so the loss was small, but still not pleasant. That’s trading.
🧐 Market Overview:
The bigger picture remains the same. On the detailed side, I am looking for a potential double top on the hourly chart. RSI is making lower highs while price is making higher highs, which shows weakening buying momentum. For me, this is a non-negotiable variable when trading double tops and head & shoulders setups.
I’ll be waiting for a candle closure in my entry range, alongside a few more confirmations, before taking the next shot. Patience is key here.
📊 Trade Plan:
Risk/Reward: 3.4
Entry: 6 598.4
Stop Loss: 6 608.3
Take Profit 1 (50%): 6 567.9
Take Profit 2 (50%): 6 557.9
💡 GTradingMethod Tip:
Losses are part of the process. The key is to keep them small, stick to your rules, and wait for probability to play out over time.
🙏 Thanks for checking out my post!
Follow me to catch my next setup, and let me know — do you think this head and shoulders will confirm, or will buyers push the S&P to fresh highs?
📌 Disclaimer:
This is not financial advice. This content is to track my trading journey and for educational purposes only.

S&P500 | H1 Head and shoulders | GTradingMethodHello Traders.
🧐 Market Overview:
I am still holding a short on the rising wedge visible on the 4-hour chart. While the S&P 500 has broken out to the upside of the wedge, there’s still a real chance this could be a fake out.
The RSI is showing overbought conditions across the 1H, 2H, and 4H timeframes, which makes it difficult for price to push higher without cooling off first. From a probability standpoint, I see the short as more favorable here than chasing longs.
With hindsight I should have waited for a reversal pattern to open shorts when trying to trade the risking wedge on the 4 hour chart.
If the head and shoulders pattern on the 1H chart fails, then a possible double top on the 2H chart may form. I’ll post an update if that scenario plays out and I have time.
NB! I do not have confirmation to enter the head and shoulders short yet. It is only on my radar for now.
📊 Trade Plan:
Risk/Reward: 3.8
Entry: 6 589.7
Stop Loss: 6 599
Take Profit 1 (50%): 6 560.2
Take Profit 2 (50%): 6 544.2
💡 GTradingMethod Tip:
A favorable setup doesn’t guarantee success, but managing risk and aligning with probability is how I stay consistent over the long term.
🙏 Thanks for checking out my post!
Make sure to follow me to catch the next idea and please share your thoughts — I’d like to hear them.
📌 Please note: This is not financial advice. This content is to track my trading journey and for educational purposes only.

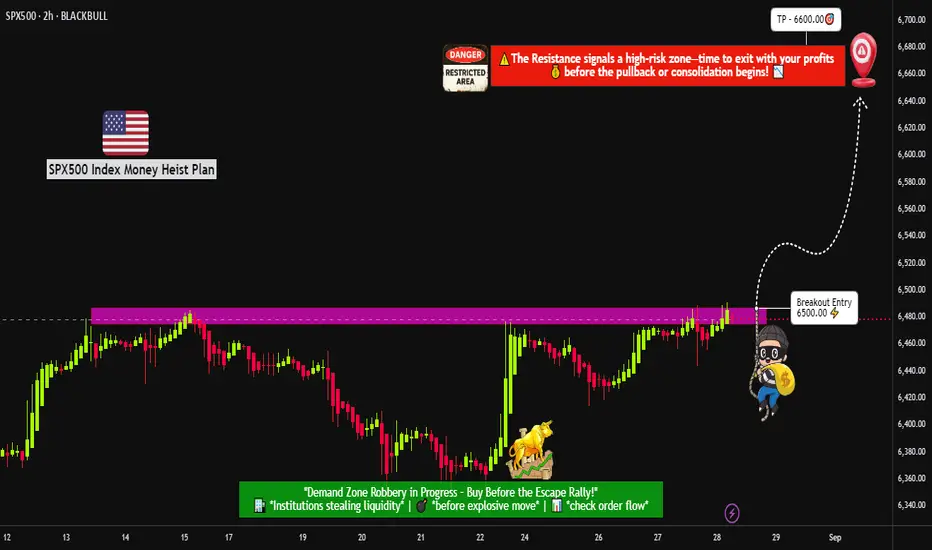
"US500 BREAKOUT – TIME TO LOAD LIMIT ORDERS FOR THE PUMP?"🔥🦹♂️ "SPX500 BANK HEIST – LAYERED BULL RAID IN PROGRESS!" 💰📈
(Thief Trader’s Multi-Limit Order Bullish Ambush – No Weak Hands Allowed)
📍 ASSET: US500 / SPX500 (S&P 500 INDEX)
🎯 HEIST PLAN: BULLISH BREAKOUT 6500.00
💣 ENTRY: ANY PRICE LEVEL (Thieves use Layered Limit Orders – adapt like a pro!)
🔫 SAMPLE LAYERS: (Scale in like a boss!)
BUY LIMIT LAYER 1: 6475.00
BUY LIMIT LAYER 2: 6460.00
BUY LIMIT LAYER 3: 6440.00
(Add more layers if needed – flexibility is key!)
🛑 STOP LOSS: 6400.00 (Thief’s Emergency Exit – adjust based on your risk!)
🎯 TARGET: 6600.00 (First profit zone – trail or take gains!)
🦹♂️ THIEF TRADER’S MASTER PLAN:
"We don’t ask for permission – we take profits."
🔹 ENTRY TACTICS:
Use multiple limit orders (LAYERED STRATEGY) – like planting timed explosives at key levels.
No panic entries – thieves strike with precision, not emotion.
DCA if needed – but keep bullets for the real move.
🔹 STOP LOSS RULES:
6400 = Danger Zone – if price breaks, abort mission & regroup.
SL too tight? You’ll get stopped out by market noise. SL too wide? You’ll bleed. Find balance.
🔹 TAKE PROFIT STRATEGY:
First TP @ 6600 – secure partial profits.
Let runners ride with trailing stop – or full exit if momentum fades.
🚨 THIEF’S GOLDEN RULES:
✅ Only LONG – no revenge shorts, no greed traps.
✅ Trade in SILENCE – avoid high-impact news (CPI, NFP, Fed).
✅ Risk management = Survival – don’t blow your account on one play.
✅ BOOST & SHARE – if this plan helps, spread the word!
📢 FINAL WARNING:
"This is not financial advice – it’s a thief’s blueprint.
Plan your escape before entry. Market heists require discipline."
💬 COMMENT "ROBBING SPX" if you’re in!
🔥 LIKE & BOOST if you ride with the Thief Trader crew!
🦹♂️ THIEF TRADER OUT.
💸 STEAL SMART. GET RICH. REPEAT.
NASDAQ | H2 Double Top | GTradingMethodHello Traders! 👋
🧐 Market Overview:
CPI is out today — and it could be the spark the NASDAQ needs. Price is stalling at the previous all-time high, and that’s where I’m watching closely.
I’ve been tracking a double top on the daily for a while now, and today the H2 chart is starting to show the same structure. That kind of multi-timeframe alignment doesn’t happen often.
📊 Trade Plan:
I’ve entered a starter short on the daily structure. If the H2 confirms, I’ll scale in with a second position.
Risk/Reward:
Entry:
Stop Loss:
Take Profit 1 (50%):
Take Profit 2 (50%):
💡 GTradingMethod Tip:
Double tops work best when paired with other signals. In my system, I look for:
- RSI negative divergence
- Lower volume on the second top
- A confirmation candle close within my entry range
This reduces false signals and adds conviction.
🙏 Thanks for reading! Do you trade double tops?
📌 Disclaimer:
This is not financial advice. This content is to track my trading journey and for educational purposes only.

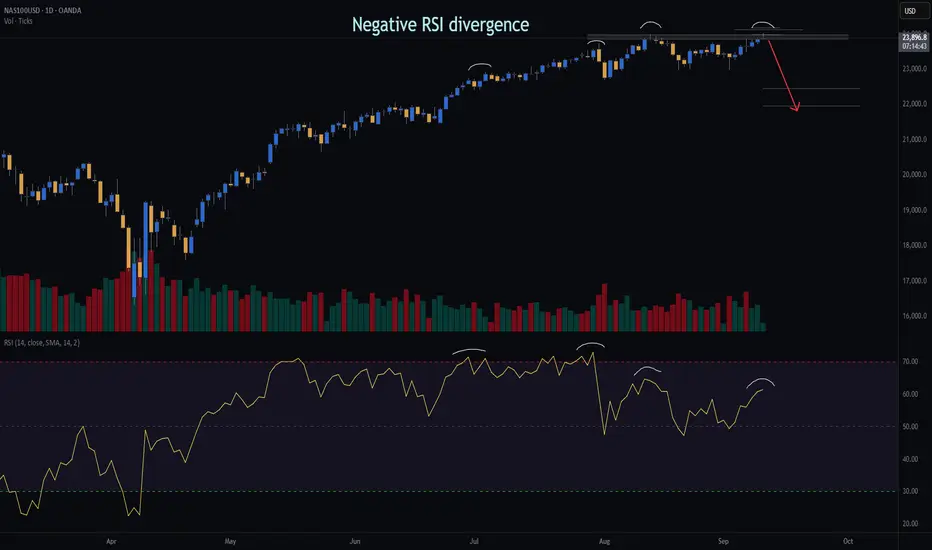
NASDAQ | Daily Double Top | GTradingMethodHello Traders 👋
🧐 Market Overview:
I’ve opened a short on the NASDAQ based on a clear double top setup that formed yesterday. Several of my key variables aligned, giving this trade a high-probability edge:
Negative RSI divergence → showing weakening buying momentum
Lower volume on the second top → indicating exhaustion
Daily candle closure within threshold → confirming structure validity
📊 Trade Plan:
RR: 9.1
Entry: 23 931
Stop Loss: 23 178
Take Profit 1 (50%): 22 453
Take Profit 2 (50%): 21 969
💡 GTradingMethod Tip:
When trading reversal patterns like double tops, I always wait for confirmation across multiple variables (momentum, volume, candle structure). This increases probability and reduces false entries.
🙏 Thanks for checking out my post!
Follow me for more setups and let me know — do you see this double top holding, or is there more upside left in the NASDAQ?
📌 Disclaimer:
This is not financial advice. This content is to track my trading journey and for educational purposes only.
DOW JONES INDEX (US30): To the New Highs
Dow updated the all time high again yesterday.
A broken structure and a solid rising trend line will compose
a significant contracting demand zone from where I will look for buying.
The next resistance will be 46350.
Wait for a retracement first, and anticipate more growth then.
❤️Please, support my work with like, thank you!❤️
I am part of Trade Nation's Influencer program and receive a monthly fee for using their TradingView charts in my analysis.
