Potential bearish reversal?USD/CHF is rising towards the resistance level, which is a pullback resistance that is slightly below the 505 Fibonacci retracement and could reverse from this level to our take profit.
Entry: 0.7996
Why we like it:
There is a pullback resistance level, which is slightly below the 50% Fibonacci retracement.
Stop loss: 0.8027
Why we like it:
There is a pullback resistance that is slightly above the 61.8% Fibonacci retracement.
Take profit: 0.7953
Why we like it:
There is a pullback support level.
Enjoying your TradingView experience? Review us!
Please be advised that the information presented on TradingView is provided to Vantage (‘Vantage Global Limited’, ‘we’) by a third-party provider (‘Everest Fortune Group’). Please be reminded that you are solely responsible for the trading decisions on your account. There is a very high degree of risk involved in trading. Any information and/or content is intended entirely for research, educational and informational purposes only and does not constitute investment or consultation advice or investment strategy. The information is not tailored to the investment needs of any specific person and therefore does not involve a consideration of any of the investment objectives, financial situation or needs of any viewer that may receive it. Kindly also note that past performance is not a reliable indicator of future results. Actual results may differ materially from those anticipated in forward-looking or past performance statements. We assume no liability as to the accuracy or completeness of any of the information and/or content provided herein and the Company cannot be held responsible for any omission, mistake nor for any loss or damage including without limitation to any loss of profit which may arise from reliance on any information supplied by Everest Fortune Group.
USD

Bulliah reversal off multi swing low support?USD/CAD has bounced off the support level, which is a multi-swing low support, and could potentially rise from this level to our take profit.
Entry: 1.3724
Why we like it:
There is a multi-swing low support level.
Stop loss: 1.3678
Why we like it:
There is a pullback support level.
Take profit: 1.3878
Why we like it:
There is an overlap resistance level that aligns with the 38.2% Fibonacci retracement.
Enjoying your TradingView experience? Review us!
Please be advised that the information presented on TradingView is provided to Vantage (‘Vantage Global Limited’, ‘we’) by a third-party provider (‘Everest Fortune Group’). Please be reminded that you are solely responsible for the trading decisions on your account. There is a very high degree of risk involved in trading. Any information and/or content is intended entirely for research, educational and informational purposes only and does not constitute investment or consultation advice or investment strategy. The information is not tailored to the investment needs of any specific person and therefore does not involve a consideration of any of the investment objectives, financial situation or needs of any viewer that may receive it. Kindly also note that past performance is not a reliable indicator of future results. Actual results may differ materially from those anticipated in forward-looking or past performance statements. We assume no liability as to the accuracy or completeness of any of the information and/or content provided herein and the Company cannot be held responsible for any omission, mistake nor for any loss or damage including without limitation to any loss of profit which may arise from reliance on any information supplied by Everest Fortune Group.

Bearish drop off?GBP/USD is rising towards the resistance level, which is a pullback resistance level, and could drop from this level to our take profit.
Entry: 1.3398
Why we like it:
There is a pullback resistance
Stop loss: 1.3456
Why we like it:
There is a swing high resistance.
Take profit: 1.3341
Why we like it:
There is an overlap support that is slightly below the 61.8% Fibonacci retracement.
Enjoying your TradingView experience? Review us!
Please be advised that the information presented on TradingView is provided to Vantage (‘Vantage Global Limited’, ‘we’) by a third-party provider (‘Everest Fortune Group’). Please be reminded that you are solely responsible for the trading decisions on your account. There is a very high degree of risk involved in trading. Any information and/or content is intended entirely for research, educational and informational purposes only and does not constitute investment or consultation advice or investment strategy. The information is not tailored to the investment needs of any specific person and therefore does not involve a consideration of any of the investment objectives, financial situation or needs of any viewer that may receive it. Kindly also note that past performance is not a reliable indicator of future results. Actual results may differ materially from those anticipated in forward-looking or past performance statements. We assume no liability as to the accuracy or completeness of any of the information and/or content provided herein and the Company cannot be held responsible for any omission, mistake nor for any loss or damage including without limitation to any loss of profit which may arise from reliance on any information supplied by Everest Fortune Group.

DXY: long-term view🛠 Technical Analysis: On the weekly timeframe (W1), the U.S. Dollar Index is displaying a significant structural shift. Despite a brief breach of the psychological 100 level, the price failed to generate a strong downward impulse, suggesting that bearish momentum is exhausted.
As noted on the chart, "sellers are being bought out," paving the way for a recovery back above the 100 level. The primary objective of this move is a test of the long-term descending resistance line, which currently aligns with the 107.384 target.
———————————————
❗️ Trade Parameters (BUY)
———————————————
➡️ Entry Point: Confirmation of price holding above the pivot level (approx. 100.524).
🎯 Take Profit: 107.384 (Long-term Descending Resistance).
🔴 Stop Loss: Below the recent accumulation lows (approx. 97.787).
⚠️ Disclaimer: This is a potential trade idea based on current analysis; market conditions and price direction are subject to change based on news factors and volatility.

BTCUSD SELL SETUPPOSSIBLE SELL SETUP BTCUSD
SL ABOVE SUPPLY ZONE
TP 1 BELOW DEMAND ZONE
TP 2 OPEN USE PROPER RISK MANAGEMENT
FOLLOW YOUR TRADING PLAN !!!!
SIMPLE BTCUSD TRADING PLAN
1️⃣ Timeframe
15m or 1H only
2️⃣ Indicators
200 EMA → trend
50 EMA → entry
RSI (14) → confirmation
3️⃣ BUY RULES
✅ Price above 200 EMA
✅ Pullback to 50 EMA
✅ RSI above 50
✅ Bullish candle
➡️ Then BUY
4️⃣ SELL RULES
✅ Price below 200 EMA
✅ Pullback to 50 EMA
✅ RSI below 50
✅ Bearish candle
➡️ Then SELL
5️⃣ Risk Rules
Risk 1% per trade
Always use Stop Loss
Target = 2× Stop Loss (1:2)
6️⃣ Management
At 1:1, move stop to breakeven
Do nothing else
7️⃣ Golden Rules
❌ No stop loss = no trade
❌ No emotions
❌ No overtrading
ONE LINE RULE
If all rules aren’t met → NO TRADE

USDCAD H4 | Potential Bullish ReversalMomentum: Bearish
The price has reacted off the buy entry, which is a pullback support.
Buy entry: 1.3790
Pullback support
Stop loss: 1.3729
Swing low support
Take profit: 1.3882
Overlap resistance
High Risk Investment Warning
Stratos Markets Limited (tradu.com), Stratos Europe Ltd (tradu.com ):
CFDs are complex instruments and come with a high risk of losing money rapidly due to leverage. 70% of retail investor accounts lose money when trading CFDs with this provider. You should consider whether you understand how CFDs work and whether you can afford to take the high risk of losing your money.
Stratos Global LLC (tradu.com ): Losses can exceed deposits.
Please be advised that the information presented on TradingView is provided to Tradu (‘Company’, ‘we’) by a third-party provider (‘TFA Global Pte Ltd’). Please be reminded that you are solely responsible for the trading decisions on your account. Any information and/or content is intended entirely for research, educational and informational purposes only and does not constitute investment or consultation advice or investment strategy. The information is not tailored to the investment needs of any specific person and therefore does not involve a consideration of any of the investment objectives, financial situation or needs of any viewer that may receive it. Past performance is not a reliable indicator of future results. Actual results may differ materially from those anticipated in forward-looking or past performance statements. We assume no liability as to the accuracy or completeness of any of the information and/or content provided herein and the Company cannot be held responsible for any omission, mistake nor for any loss or damage including without limitation to any loss of profit which may arise from reliance on any information supplied by TFA Global Pte Ltd.

Bullish bounce off?BTC/USD has bounced off the pivot, which is a pullback support, and could rise to the 1st resistance.
Pivot: 85,215.19
1st Support: 83,544.88
1st Resistance: 89,917.16
Disclaimer:
The opinions given above constitute general market commentary and do not constitute the opinion or advice of IC Markets or any form of personal or investment advice.
Any opinions, news, research, analyses, prices, other information, or links to third-party sites contained on this website are provided on an "as-is" basis, are intended to be informative only, and are not advice, a recommendation, research, a record of our trading prices, an offer of, or solicitation for, a transaction in any financial instrument and thus should not be treated as such. The information provided does not involve any specific investment objectives, financial situation, or needs of any specific person who may receive it. Please be aware that past performance is not a reliable indicator of future performance and/or results. Past performance or forward-looking scenarios based upon the reasonable beliefs of the third-party provider are not a guarantee of future performance. Actual results may differ materially from those anticipated in forward-looking or past performance statements. IC Markets makes no representation or warranty and assumes no liability as to the accuracy or completeness of the information provided, nor any loss arising from any investment based on a recommendation, forecast, or any information supplied by any third party

Could we se a reveral from here?Ethereum (ETH/USD) is reacting off the pivot and could bounce to the 50% FIb resistance.
Pivot: 2,774.18
1st Support: 2,578.20
1st Resistance: 3,169.47
Disclaimer:
The opinions given above constitute general market commentary and do not constitute the opinion or advice of IC Markets or any form of personal or investment advice.
Any opinions, news, research, analyses, prices, other information, or links to third-party sites contained on this website are provided on an "as-is" basis, are intended to be informative only, and are not advice, a recommendation, research, a record of our trading prices, an offer of, or solicitation for, a transaction in any financial instrument and thus should not be treated as such. The information provided does not involve any specific investment objectives, financial situation, or needs of any specific person who may receive it. Please be aware that past performance is not a reliable indicator of future performance and/or results. Past performance or forward-looking scenarios based upon the reasonable beliefs of the third-party provider are not a guarantee of future performance. Actual results may differ materially from those anticipated in forward-looking or past performance statements. IC Markets makes no representation or warranty and assumes no liability as to the accuracy or completeness of the information provided, nor any loss arising from any investment based on a recommendation, forecast, or any information supplied by any third party

Bearish reversal off 50% Fibonacci resistance?AUD/USD has rejected off the resistance level, which is a pullback resistance that aligns with the 50% Fibonacci retracement and could drop from this level to our take profit.
Entry: 0.6631
Why we like it:
There is a pullback resistance that aligns with the 50% Fibonacci retracement.
Stop loss: 0.6676
Why we like it:
There is a swing high resistance level
Take profit: 0.6541
Why we like it:
There is a pullback support level that is slightly below the 50% Fibonacci retracement.
Enjoying your TradingView experience? Review us!
Please be advised that the information presented on TradingView is provided to Vantage (‘Vantage Global Limited’, ‘we’) by a third-party provider (‘Everest Fortune Group’). Please be reminded that you are solely responsible for the trading decisions on your account. There is a very high degree of risk involved in trading. Any information and/or content is intended entirely for research, educational and informational purposes only and does not constitute investment or consultation advice or investment strategy. The information is not tailored to the investment needs of any specific person and therefore does not involve a consideration of any of the investment objectives, financial situation or needs of any viewer that may receive it. Kindly also note that past performance is not a reliable indicator of future results. Actual results may differ materially from those anticipated in forward-looking or past performance statements. We assume no liability as to the accuracy or completeness of any of the information and/or content provided herein and the Company cannot be held responsible for any omission, mistake nor for any loss or damage including without limitation to any loss of profit which may arise from reliance on any information supplied by Everest Fortune Group.

Zcash ZEC Update: Breakdown confirmed, hold your horses ZEC Update: Price has now decisively broken down from the rising channel, and the attempted reclaim back into the structure failed, confirming this move as corrective rather than trend continuation. Former channel support in the 390-400 region is continuing to act as resistance, and the inability to hold above it reinforces that sellers remain in control. Structurally, this shifts the bias back to the downside, with price likely to remain under pressure into year end.
From a broader perspective, this lines up with the wider crypto market showing signs of distribution and risk-off behavior following the recent expansion phase. As liquidity tightens and momentum cools across majors, higher beta and narrative-driven assets like ZEC tend to retrace deeper and test higher timeframe levels. In that context, continuation back toward the ~300 HTF support zone makes the most sense from both a technical and macro standpoint.
The ~300 level is especially important here. This would be a second test of what has recently flipped from resistance to support, making it a true validation level. A strong reaction would suggest acceptance of this zone as a higher low within a larger cycle, while a weak or impulsive break would open the door to further downside and a longer basing process. I’m cautious here, as second tests often determine whether a level holds structurally or fails outright.
Assuming the market continues to flush and reset into early next year, I’d expect conditions to improve closer to February once excess leverage and weak hands are cleared out. Until then, the focus remains on respecting structure, managing risk, and letting price confirm before getting aggressive. For now, this looks like consolidation and downside continuation within a broader market reset rather than the start of a new uptrend.

USDCHF H4 | Bullish Reversal SetupMomentum: Bearish
The price could make a short-term pullback to the buy entry, which acts as a pullback support.
Buy entry: 0.7961
Pullback support
Stop loss: 0.7922
Pullback support
Take profit: 0.8011
Overlap resistance that aligns with the 50% Fibonacci retracement
High Risk Investment Warning
Stratos Markets Limited (tradu.com ), Stratos Europe Ltd (tradu.com ):
CFDs are complex instruments and come with a high risk of losing money rapidly due to leverage. 70% of retail investor accounts lose money when trading CFDs with this provider. You should consider whether you understand how CFDs work and whether you can afford to take the high risk of losing your money.
Stratos Global LLC (tradu.com ): Losses can exceed deposits.
Please be advised that the information presented on TradingView is provided to Tradu (‘Company’, ‘we’) by a third-party provider (‘TFA Global Pte Ltd’). Please be reminded that you are solely responsible for the trading decisions on your account. Any information and/or content is intended entirely for research, educational and informational purposes only and does not constitute investment or consultation advice or investment strategy. The information is not tailored to the investment needs of any specific person and therefore does not involve a consideration of any of the investment objectives, financial situation or needs of any viewer that may receive it. Past performance is not a reliable indicator of future results. Actual results may differ materially from those anticipated in forward-looking or past performance statements. We assume no liability as to the accuracy or completeness of any of the information and/or content provided herein and the Company cannot be held responsible for any omission, mistake nor for any loss or damage including without limitation to any loss of profit which may arise from reliance on any information supplied by TFA Global Pte Ltd.

NZDUSD H4 | Bearish drop offMomentum: Bullish
The price has reacted off the sell entry, which acts as a pullback support.
Sell entry: 0.5796
Pullback support
Stop loss: 0.5841
Swing high resistance
Take profit: 0.5728
Pullback support
38.2% Fibonacci retracement
High Risk Investment Warning
Stratos Markets Limited (tradu.com), Stratos Europe Ltd (tradu.com ):
CFDs are complex instruments and come with a high risk of losing money rapidly due to leverage. 70% of retail investor accounts lose money when trading CFDs with this provider. You should consider whether you understand how CFDs work and whether you can afford to take the high risk of losing your money.
Stratos Global LLC (tradu.com ): Losses can exceed deposits.
Please be advised that the information presented on TradingView is provided to Tradu (‘Company’, ‘we’) by a third-party provider (‘TFA Global Pte Ltd’). Please be reminded that you are solely responsible for the trading decisions on your account. Any information and/or content is intended entirely for research, educational and informational purposes only and does not constitute investment or consultation advice or investment strategy. The information is not tailored to the investment needs of any specific person and therefore does not involve a consideration of any of the investment objectives, financial situation or needs of any viewer that may receive it. Past performance is not a reliable indicator of future results. Actual results may differ materially from those anticipated in forward-looking or past performance statements. We assume no liability as to the accuracy or completeness of any of the information and/or content provided herein and the Company cannot be held responsible for any omission, mistake nor for any loss or damage including without limitation to any loss of profit which may arise from reliance on any information supplied by TFA Global Pte Ltd.

USD/JPY(20251218)Today's AnalysisMarket News:
Ben Waller, one of the final candidates for the next Federal Reserve Chair and current Governor, said on Wednesday that the current job market is "very weak" and job growth is "not optimistic," therefore the Fed still has room to cut interest rates. He supports further rate cuts to restore the central bank's interest rate setting to a neutral level, while stating that policymakers do not need to rush into doing so.
Speaking at the Yale University CEO Summit, Waller noted that the Fed's current interest rate is 50 to 100 basis points higher than the neutral rate, but he emphasized that "aggressive action is not needed" and that rate cuts can continue "at a moderate pace."
Waller stated that "the job market indicates the Fed should continue cutting rates," while also assuring that "we are not seeing a cliff-like drop in the job market."
Technical Analysis:
Today's Buy/Sell Threshold:
155.30
Support and Resistance:
156.52
156.06
155.77
154.83
154.54
154.08
Trading Strategy:
If the price breaks above 155.77, consider buying, with a first target price of 156.06.
If the price breaks below 155.30, consider selling, with a first target price of 154.83.

ETHUSD - Next LevelEthereum, like Bitcoin, has completed corrective wave A and has resumed its downward move with wave B .
The decline is most likely heading toward the 2,620 level.
---
Please subscribe and leave a comment.
You’ll get new information faster than anyone else.
---

Bearish drop?EUR/USD has reacted off the resistance level which is a pullback resistance and could drop from this level to our take profit.
Entry: 1.1755
Why we like it:
There is a pullback resistance level.
Stop loss: 1.1803
Why we like it:
There is a swing high resistance level.
Take profit: 1,1676
Why we like it:
There is a pullback support that aligns with the 38.2% and the 61.8% Fibonacci retracement.
Enjoying your TradingView experience? Review us!
Please be advised that the information presented on TradingView is provided to Vantage (‘Vantage Global Limited’, ‘we’) by a third-party provider (‘Everest Fortune Group’). Please be reminded that you are solely responsible for the trading decisions on your account. There is a very high degree of risk involved in trading. Any information and/or content is intended entirely for research, educational and informational purposes only and does not constitute investment or consultation advice or investment strategy. The information is not tailored to the investment needs of any specific person and therefore does not involve a consideration of any of the investment objectives, financial situation or needs of any viewer that may receive it. Kindly also note that past performance is not a reliable indicator of future results. Actual results may differ materially from those anticipated in forward-looking or past performance statements. We assume no liability as to the accuracy or completeness of any of the information and/or content provided herein and the Company cannot be held responsible for any omission, mistake nor for any loss or damage including without limitation to any loss of profit which may arise from reliance on any information supplied by Everest Fortune Group.

Bearish drop?ETH/USD may face short-term resistance and could pull back toward the first support level.
Pivot: 3,163.01
1st Support: 2,757.37
1st Resistance: 3,397.46
Disclaimer:
The opinions given above constitute general market commentary and do not constitute the opinion or advice of IC Markets or any form of personal or investment advice.
Any opinions, news, research, analyses, prices, other information, or links to third-party sites contained on this website are provided on an "as-is" basis, are intended to be informative only, and are not advice, a recommendation, research, a record of our trading prices, an offer of, or solicitation for, a transaction in any financial instrument and thus should not be treated as such. The information provided does not involve any specific investment objectives, financial situation, or needs of any specific person who may receive it. Please be aware that past performance is not a reliable indicator of future performance and/or results. Past performance or forward-looking scenarios based upon the reasonable beliefs of the third-party provider are not a guarantee of future performance. Actual results may differ materially from those anticipated in forward-looking or past performance statements. IC Markets makes no representation or warranty and assumes no liability as to the accuracy or completeness of the information provided, nor any loss arising from any investment based on a recommendation, forecast, or any information supplied by any third party

EURUSD Approaching the yearly Resistance.The EURUSD pair is currently on the 3rd Leg of a very aggressive rally that started on he 1.14700 Low (Support), with the most recent Higher Low being last week on the 1D MA50 (blue trend-line).
This chart shows a potential Double Sell Signal as the price is approaching the Resistance Zone that started after the July 01 2025 High, while the 1D RSI is approaching its own Resistance level since March 11 2025.
As a result, once the price enters the Resistance Zone or if the RSI hits its own sooner, we will have the most optimal quarterly sell opportunity. If that takes place in the middle of the Resistance Zone, the resulting drop will test the exact 1.14700 Support. As a result, that is our Target on a medium-term basis or if the RSI hits its own Support (32.50) first.
---
** Please LIKE 👍, FOLLOW ✅, SHARE 🙌 and COMMENT ✍ if you enjoy this idea! Also share your ideas and charts in the comments section below! This is best way to keep it relevant, support us, keep the content here free and allow the idea to reach as many people as possible. **
---
💸💸💸💸💸💸
👇 👇 👇 👇 👇 👇

What's ahead for the NEW YEAR 26'?TVC:DXY
Becoming Profitable in the Auction, is a choice only chosen by the 'PROFITABLE'...
As of today the U.S. Dollar Index (DXY) has fallen significantly around -9.5% to -10% year-to-date, marking its worst performance in decades due to expectations of U.S. interest rate cuts and a strengthening global economy. Now the question is, What's ahead for the DOLLAR? Will it continue to weaken for the year of 2026 or gain back strength? What are your thoughts, lmk in the comments...
Continued Success,
TreyHighPwr

NAS100 Preparing for Wave 3 Rally After Healthy PullbackThe NAS100 chart shows that a larger corrective move has likely finished at the (Y) / C low, after which price started a new upward impulsive structure. The recent decline looks like a normal Wave 2 pullback, which has already reacted from the 0.5–0.618 Fibonacci support zone, a common area for corrections to end. This suggests buyers are stepping back in and the market is preparing for Wave 3, which is usually the strongest upward move. As long as price stays above the invalidation level near 23,836, the bullish Elliott Wave setup remains valid. Overall, the structure favors further upside toward new highs once Wave 3 gains momentum.
Stay tuned!
@Money_Dictators
Thank you :)

USDJPY - Correction or Reload Before the Next Push?📈USDJPY remains structurally bullish on the higher time frame . The market respected the rising blue trendline, broke above the previous support zone, and shifted that zone into new demand.
🏹After the impulsive move higher , price is now going through a controlled correction, drifting back toward a key area of confluence:
the rising trendline + former support zone.
❗️This is exactly where trend traders pay attention . As long as price holds above this intersection, the plan is simple: look for trend-following long setups, aiming for continuation in the direction of the dominant trend.
A clean bullish reaction here keeps the structure intact. Only a decisive break below would put this bullish scenario into question.
Is this just a pause… or the fuel for the next leg higher? 🤔
⚠️ Disclaimer: This is not financial advice. Always do your own research and manage risk properly.
📚 Stick to your trading plan regarding entries, risk, and management.
Good luck! 🍀
All Strategies Are Good; If Managed Properly!
~Richard Nasr

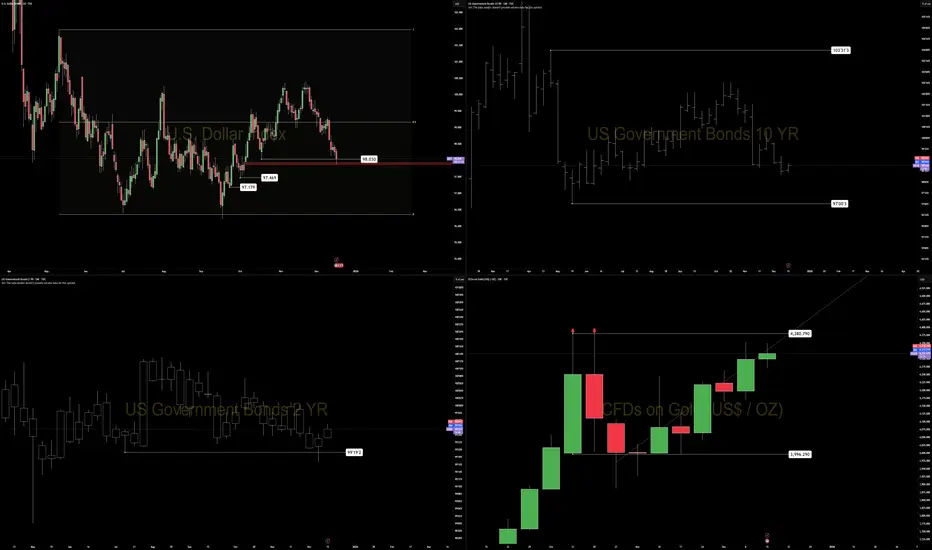
DXY — Daily Structure at a Decision PointThe dollar has completed a prior volume imbalance fill at 97.853 and is now trading against the lower boundary of the daily range.
Participation is low, consistent with late-December conditions. In this environment, daily closes matter more than intraday movement.
Key level: 98.030
This is the prior daily range low.
A daily close below 98.030 shifts the daily bias bearish
Without that close, downside pressure remains internal to the range
The move into imbalance without expansion suggests position resolution, not trend initiation. This is typical of year-end exposure reduction, rather than new macro positioning.
Cross-market context:
Gold is pressing into a double-high area without expansion.
Bonds are showing loss of momentum at the front end.
Risk assets remain supported but lack acceleration.
If structure breaks, the next natural downside references sit at 97.469 and 97.179.
Until a close confirms, this remains a confirmation environment, not a forecasting one.
AUDUSD Breakout Retest as Dollar Weakens!Hey Traders,
In today’s trading session, we are monitoring AUDUSD for a potential buying opportunity around the 0.66000 zone. The pair previously traded within a downtrend but has successfully broken out, signaling a shift in market structure.
Price is now in a healthy corrective phase, retracing toward the 0.66000 support zone, which aligns with prior resistance turned support — a classic breakout–retest setup.
Fundamental backdrop:
The US Dollar remains under pressure following softer macro conditions and fading expectations of sustained Fed hawkishness. Recent data continues to point toward a cooling US labor market, reinforcing a weaker USD environment and improving the risk-reward profile for AUDUSD on pullbacks.
Focus: Watching price behavior around 0.66000 for confirmation of bullish continuation.
Trade safe,
Joe

USDCAD at Critical Trend ResistanceHey Traders,
In tomorrow’s trading session, we are monitoring USDCAD for a potential selling opportunity around the 1.38000 zone.
Technical structure:
USDCAD remains in a clear downtrend and is currently in a corrective phase, with price retracing toward the 1.38000 area — a key zone of trend resistance and prior supply. This level represents a technically significant area where sellers may look to reassert control in line with the broader bearish structure.
What to watch:
Price behavior around 1.38000 will be critical. A clear rejection or loss of bullish momentum here could signal trend continuation to the downside.
Trade safe,
Joe
