USDCAD FRGNT DAILY FORECAST - Q4 | W51 | D15 | Y25 |📅 Q4 | W51 | D15 | Y25 |
📊 USDCAD FRGNT DAILY FORECAST
🔍 Analysis Approach:
I’m applying Smart Money Concepts, focusing on:
Identifying Points of Interest on the Higher Time Frames (HTFs) 🕰️
Using those POIs to define a clear trading range 📐
Refining those zones on Lower Time Frames (LTFs) 🔎
Waiting for a Break of Structure (BoS) for confirmation ✅
This method allows me to stay precise, disciplined, and aligned with the market narrative, rather than chasing price.
💡 My Motto:
"Capital management, discipline, and consistency in your trading edge."
A positive risk-to-reward ratio, paired with a high win rate, is the backbone of any solid trading plan 📈🔐
⚠️ Losses?
They’re part of the mathematical game of trading 🎲
They don’t define you — they’re necessary, they happen, and we move forward 📊➡️
🙏 I appreciate you taking the time to review my Daily Forecast.
Stay sharp, stay consistent, and protect your capital
— FRNGT 🚀
FX:USDCAD
Usdcadlong

Smart Money Levels on USD/CAD – What’s Next for the Loonie?“USD/CAD – The LOONIE Profit Playbook (Swing/Day Trade) 🚀💰”
📋 Description:
Dear Ladies & Gentleman (Thief OG’s),
Here’s the plan for our favourite cross, USD/CAD – “The Loonie”:
Plan: Bullish bias (with a setup for a potential bearish flip if you like to dance with the other side)
Entry (Bullish):
Pullback-1: 1.39400
Pullback-2: 1.39000
Enter at a dip into one of those levels, let the market breathe, then ride the wave.
Stop Loss:
This is Thief SL at 1.38800 — place your stop after the pullback level you used.
Target (Bullish):
Our target zone: 1.41000 — watch for strong resistance, overbought signals & a possible trap. Escape with profit when you see the signs.
Entry (Bearish):
If you prefer the short side: you may enter anywhere, but keep sharp eyes on pullback zones and the target levels below.
Bearish Targets: 1.39400 & 1.39000
🔍 More to watch – Related Pairs & Correlations:
OANDA:USDCHF (often moves inversely with USD/CAD)
OANDA:AUDUSD (commodity-linked crosses, relevant when commodities shift)
OANDA:CADJPY (Canadian dollar strength/weakness can show up across CAD pairs)
Watch how CAD strength or USD strength flows across pairs. When CAD weakens, USD/CAD rises — when CAD strengthens, USD/CAD dips.
⚠️ Note:
Dear Ladies & Gentleman (Thief OG’s), I am not recommending you set only my stop-loss or take-profit rules. It’s your own choice — make money, then take money — at your own risk.
✨ Footer:
“If you find value in my analysis, a 👍 and 🚀 boost is much appreciated — it helps me share more setups with the community!”
📌 Disclaimer:
This is Thief style trading strategy just for fun.
#USDCAD #Forex #SwingTrade #DayTrade #Loonie #ForexSetup #ThiefTrader #TradingViewIdeas #ForexAnalysis #CurrencyPairs

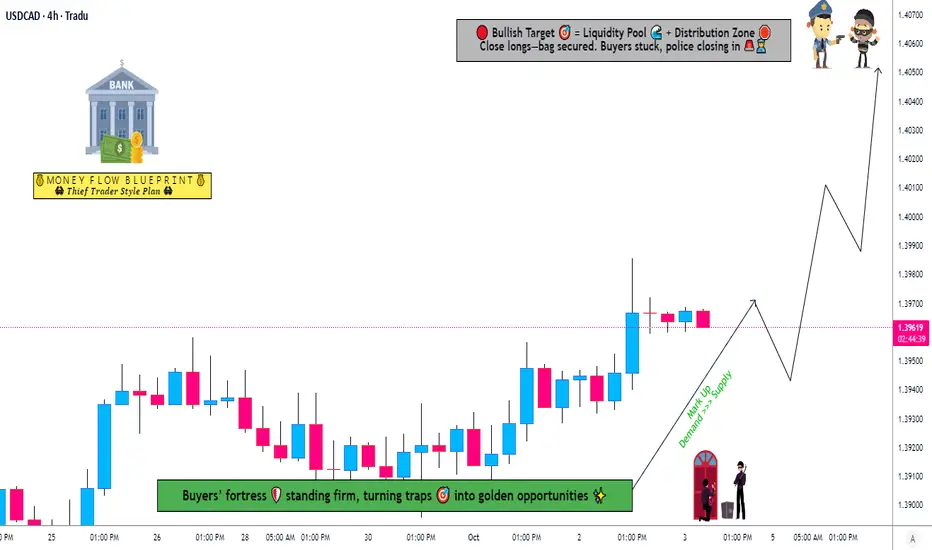
Is the USD/CAD Re-Accumulation Zone the Next Bullish Launchpad?💰 USD/CAD “THE LOONIE” — Forex Market Profit Playbook (Swing/Day Trade)
📊 Plan:
BULLISH Bias confirmed by Re-Accumulation Zone (Smart Money activity detected!)
The “Thief Strategy” hunts liquidity smartly — using layered limit buys at key levels to capture institutional footprints without chasing candles.
🎯 Entry Plan (Layering Strategy Style)
The Thief strategy uses multiple buy limit layers — a smart method to scale into a position without full exposure at once.
Buy Limit Layers:
1️⃣ 1.39800
2️⃣ 1.39900
3️⃣ 1.40000
4️⃣ 1.40200
💡 You can adjust or increase the limit layers based on your own trade risk and capital exposure.
🛡️ Stop Loss (SL):
📍 Suggested protective stop: 1.39600
Not financial advice — each trader’s risk tolerance may vary. Manage risk wisely like a pro!
💵 Target (Take Profit Zone):
🎯 1.41300 — The “Police Barricade” (major resistance area).
This zone may act as a strong barrier due to overbought conditions and potential liquidity traps. Take your profits smartly and escape before the cops arrive! 🚓💨
⚠️ Notes to Thief OGs:
Dear Ladies & Gentlemen (Thief OGs) — this isn’t a signal, it’s a playbook idea. You’re free to adjust entries, SLs, and TPs based on your own analysis and money management plan.
Trade smart. Take profits wisely. Risk what you can afford to lose. 🧠💼
🔍 Related Pairs to Watch:
TVC:DXY (US Dollar Index) → USD strength driver, watch for momentum continuation.
BLACKBULL:WTI (Crude Oil) → Strong inverse correlation with CAD; rising oil often boosts CAD (bearish USD/CAD).
FX:USDCNH → USD sentiment barometer — positive correlation with USD/CAD.
OANDA:AUDCAD / OANDA:NZDCAD → Cross-check for CAD sentiment confirmation across commodity pairs.
🧭 Key Catalysts & Correlations:
USD fundamentals: Fed stance, CPI, and bond yields continue to influence direction.
CAD sentiment: Oil price movement and BoC tone will shape the medium-term bias.
Risk sentiment: Strong equity rally = weaker USD; risk-off tone = stronger USD.
✨ “If you find value in my analysis, a 👍 and 🚀 boost is much appreciated — it helps me share more setups with the community!”
📜 Disclaimer: This is a Thief-style trading strategy shared for educational and entertainment purposes only — not financial advice. Trade responsibly and with discipline.
#USDCAD #Forex #SwingTrade #DayTrade #SmartMoney #Reaccumulation #PriceAction #LiquidityHunt #TradingStrategy #MarketPlaybook #FXAnalysis #DollarIndex #ThiefStrategy #TradingViewIdeas #BullishSetup #ForexCommunity

USDCAD BUY | Idea Trading AnalysisUSDCAD is falling towards a support level which is a pullback support and could bounce from this level to our take profit.
We expect a decline in the channel after testing the current level which suggests that the price will continue to rise
Hello Traders, here is the full analysis.
I think we can soon see more fall from this range! GOOD LUCK! Great BUY opportunity USDCAD
I still did my best and this is the most likely count for me at the moment.
-------------------
Traders, if you liked this idea or if you have your own opinion about it, write in the comments. I will be glad 🤝

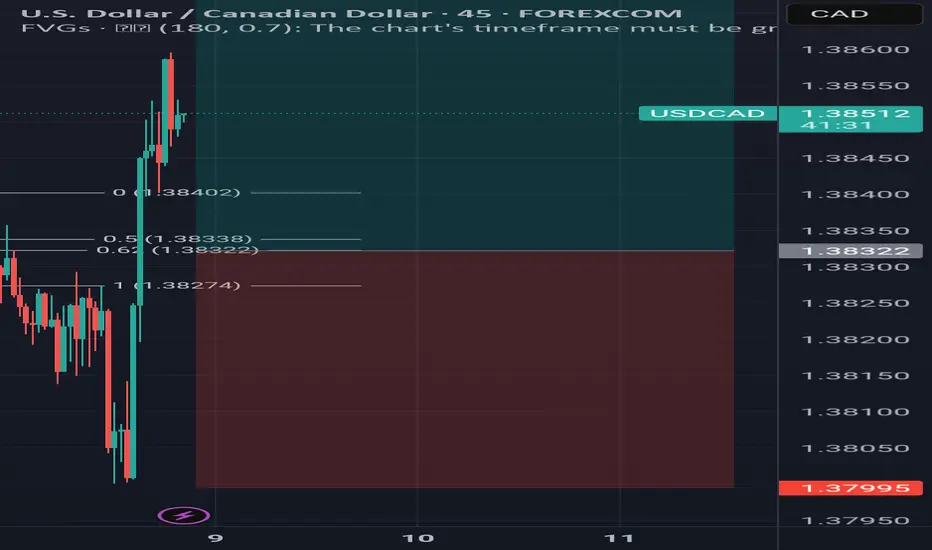
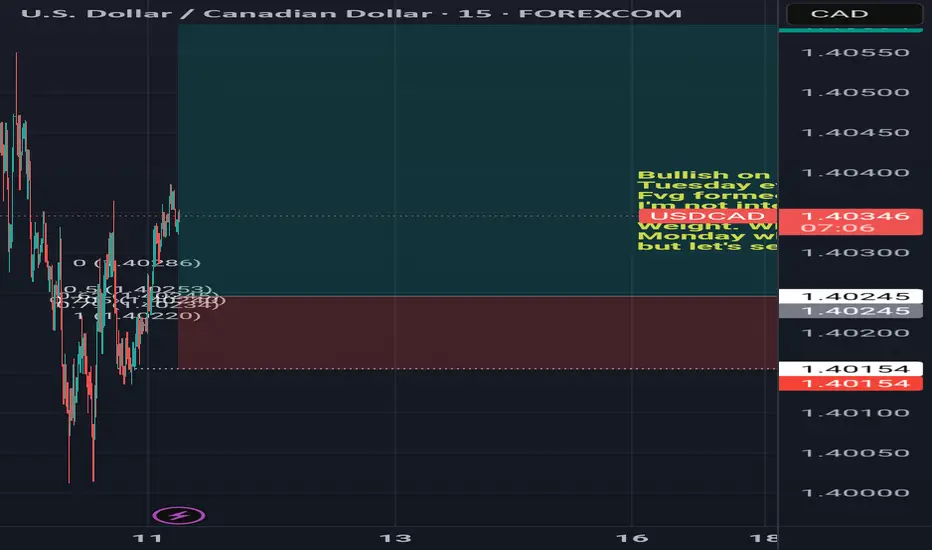
Buy usdcad I was expecting a reversal today and it's been confirmed by a fair value gap on the 4hour timeframe. All the best and risk responsibly. Risk to reward is 1:3. Could be more
USDCADUSDCAD
- Double Top in Short Time Frame
- Completed " 12345 " Impulsive Waves
- Break of Structure
- RSI - Divergence
- Bullish Channel as an corrective pattern in Long Time Frame

USDCAD Forming Falling WedgeUSDCAD is trading inside a clear bearish structure, where price has formed a rising channel that is now losing momentum, aligning with the characteristics of a developing falling wedge scenario. The pair recently rejected the upper boundary of the channel, showing strong seller presence near the 1.42000 region. This rejection confirms that bullish momentum is weakening and that the market may be preparing for a downside shift. The lower trendline is the key structural zone, and once price breaks below it, the bearish wave is likely to accelerate toward the major demand area around 1.36000 – a level that has historically triggered significant reversals.
From a fundamental perspective, the Canadian Dollar continues to find strength as oil markets remain stable and demand outlook improves. At the same time, the US Dollar is showing signs of cooling as expectations rise that the Federal Reserve could adjust its policy stance going into early 2026. Slower inflation progress and softer economic numbers have reduced USD buying pressure, giving CAD the upper hand. This shifting macro sentiment directly supports a bearish continuation in USDCAD, especially as long as the pair remains below the key resistance zones visible on the chart.
As the price compresses within this wedge structure, volatility tends to contract before a cleaner breakout occurs. If the pair decisively breaks the lower boundary with momentum, a sharp sell-off into the previous accumulation zone becomes highly probable. That zone still holds untested liquidity, making it an attractive magnet for price. Traders will be watching for volume spikes and strong bearish candles to confirm the breakout and validate the short bias.
Overall, USDCAD remains positioned for a high-probability bearish move as technical structure, trend exhaustion, liquidity gaps, and fundamentals all align toward the downside. The falling wedge compression suggests a strong potential for a profitable continuation setup once the breakout confirms.

USD/CAD Closing in on Breakout! Will Bulls Take Control?🔥 USD/CAD "THE LOONIE": Bullish Breakout Play (Swing Trade Setup) | Layer Entry Strategy 🚀
TradingView Description:
🎯 TRADE IDEA: BULLISH SWING ON USD/CAD
🏆 Plan & Thesis:
The Loonie is approaching a critical juncture! 🧐 We are stalking a potential bullish breakout above the strong resistance zone at 1.41400. Our plan is to patiently wait for a confirmed breakout and momentum shift, signaling the next leg up. This is a swing trade opportunity targeting a key resistance area.
⚡ Why This Setup?
Key Resistance Break: A decisive break above 1.41400 indicates buyer strength overpowering sellers.
Trend Continuation: Aligns with the broader bullish structure on the higher timeframes.
Low-Risk, High-Reward Entry: Using the "Thief" layer strategy to optimize our average entry price.
📈 Trade Execution Details:
🎯 Entry Strategy (The "Thief" Layer Method): 🤑
We do not chase the price! We use a strategic layer of Buy Limit orders to enter on any retracement after the breakout is confirmed.
Layer 1: 1.41200
Layer 2: 1.41000
Layer 3: 1.40800
Layer 4: 1.40600
👉 You can adjust the number of layers and levels based on your capital and risk appetite.
🛑 Stop Loss (RISK MANAGEMENT):
A consolidated stop loss is placed below all entry layers at 1.40400.
⚠️ Disclaimer: This is MY stop loss. Please adjust your position size and SL based on YOUR personal risk management strategy. Protect your capital!
🎯 Take Profit Target:
Our primary profit target is set at 1.42100, a zone of strong historical resistance where we anticipate a pullback or overbought conditions.
💡 Pro Tip: Consider taking partial profits on the way up and moving your stop loss to breakeven to secure risk-free trades!
🌐 Market Context & Correlated Pairs to Watch:
Understanding correlations is key to validating this thesis! Keep an eye on these:
OANDA:USDCAD & PEPPERSTONE:USDX (DXY): 👑 DIRECT CORRELATION. A stronger US Dollar Index typically boosts USD/CAD. Watch for DXY strength to confirm our bullish bias.
OANDA:USDCAD & GETTEX:WTIC (Crude Oil): 👑 INVERSE CORRELATION. Canada is a major oil exporter. If Oil prices fall, CAD often weakens, pushing USD/CAD higher (bullish for our trade).
FX:EURUSD & FX:GBPUSD : These major pairs often move inversely to the USD. If they are falling, it can signal broad USD strength, supporting our USD/CAD long.
✅ Key Takeaways:
✅ Wait for a confirmed breakout and close above 1.41400.
✅ Execute entries using the layer method for best average price.
✅ MANAGE YOUR RISK! This is not financial advice. Your risk, your rules.
✅ Watch correlated pairs ( TVC:DXY , TVC:XAU , GETTEX:WTIC ) for confluence.
👑 Let's get this bread, traders! If you found this idea helpful, please give it a LIKE 👍, SHARE it with a fellow trader, and FOLLOW me for more high-quality setups! Your support helps the community grow! 💬 Drop a comment below with your thoughts!

USDCAD is set to go 700 pip up!💹 Trade Setup USD/CAD
USD/CAD has formed a bullish channel with recent formation of inverted head and shoulder on the support level of the rising channel.
Weekly price action is has shown strong rejection from the support level with multiple liquidity grab.
with weaker CPI 2.9% where the forecast is 3.1% on CAD as well as continued bearish trend in Crude Oil ( as CAD is highly influence to WTI price ) putting CAD under pressure, While strong NFP data Non-Farm Employment Change 119k while forecast 53k boosting DXY making USD /CAD one of the strongest USD currency pairs to trade on
📈Trading Idea :
Look for bullish setup after false breakout of daily support at 1.4080 and rejection above
✈️Targets
1st Resistance 1.4543
2nd Resistance: 1.4799
🔴Stop level
at or below 1.3971 as this is the lower shadow of the inverted head and shoulder.
Follow for more ideas and update on this pair and other pairs !
USDCAD buy opprotunityNot the best setup based on market structure, but good change of price retesting the higher areas for now.
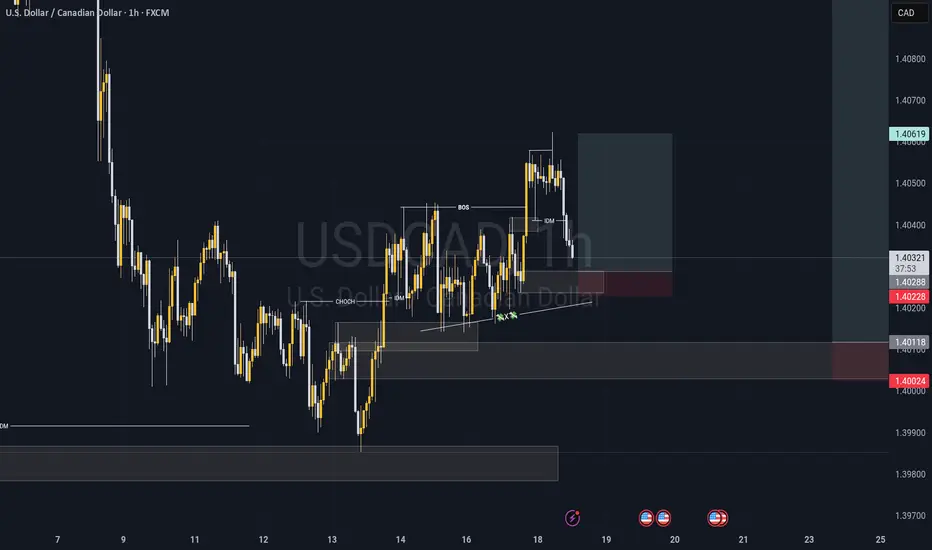
Swinging USDCAD from a discounted levelHello everyone... I'm back !!!
CHOCH + BOS + Liq (IND) + H1 OB
New signal Alert 🚨
USDCAD
Pair: USD/CAD (United States/Canadian Dollar)
Side: BUY (Buy Limit)
Entry: 1.4028
QP/STP: 1.4043 (15 pips)
TP 1: 1.4058 (30 pips)
TP 2: Open
Stop Loss: 1.40220 (6 pips - enough space for price to breathe)
Do not over-leverage your account, use proper risk and money management.
I8.11.25
Matthew 6:33
Ask me anything !!!
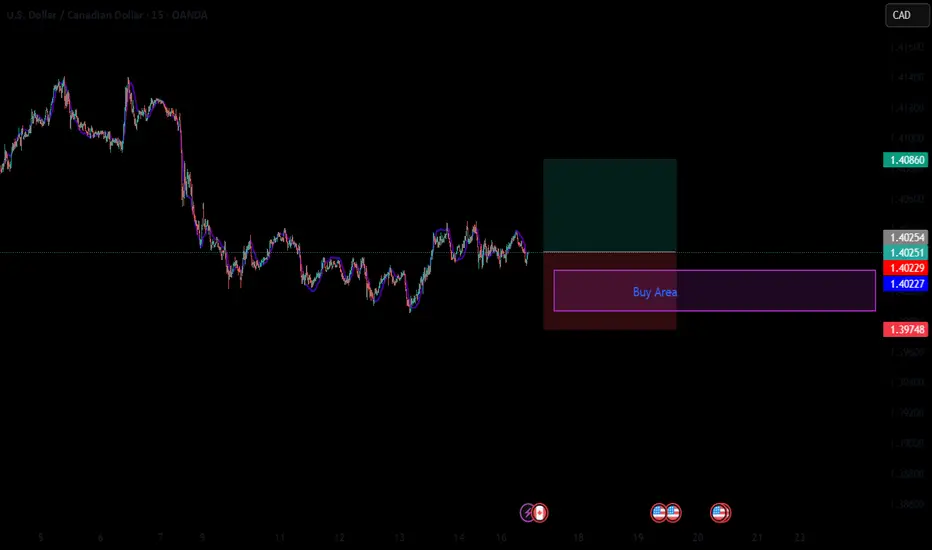
USD/CAD Price Outlook – Trade Setup (USD/CAD)📊 Technical Structure
OANDA:USDCAD USD/CAD remains supported above 1.4014–1.4019, a key intraday demand zone that has supported price multiple times over the past sessions. Price is attempting a rebound from this support area, pushing back toward the 1.4040–1.4045 intraday pivot.
A sustained move above 1.4050 may open room for a continuation toward the resistance zone at 1.4066–1.4072, which aligns with previous supply and structural highs on the 30M chart. Failure to hold 1.4010 would invalidate the bullish setup and expose downside risk toward 1.3980.
Overall, price action favours a buy-the-dip structure as long as the support zone remains intact.
🎯 Trade Setup
Idea: Buy from support zone for continuation toward resistance.
Entry: 1.4014 – 1.4019
Stop Loss: 1.4011
Take Profit 1: 1.4066
Take Profit 2: 1.4072
Risk–Reward Ratio: ≈ 1 : 6.46
Bias remains short-term bullish while the pair trades above 1.4010.
🌐 Macro Background
USD/CAD extends modest gains around 1.4030–1.4050 during Monday’s Asian session as the Canadian Dollar weakens alongside declining crude oil prices.
According to FXStreet, “USD/CAD holds gains near 1.4050 as lower crude Oil prices weigh on the Canadian Dollar.” 【FXStreet】
Oil Pressure on CAD:
WTI crude pulls back from last session’s 2% rise, trading near $59.30 after Russia’s Novorossiysk port resumed operations following a two-day shutdown caused by a Ukrainian drone strike.
Meanwhile, the IEA warns of a potential 4 million bpd oversupply in 2026, reinforcing bearish pressure on energy markets.
BoC Expectations:
Markets expect the Bank of Canada to hold rates steady through 2026, unless economic conditions deteriorate further. October CPI data later today could influence rate expectations.
Fed Commentary:
Hawkish remarks from Fed officials continue to support the US Dollar.
Kansas City Fed President Jeffery Schmid said monetary policy should “lean against demand growth,” calling current conditions “modestly restrictive.”
Rate Cut Odds:
CME FedWatch shows 46% probability of a 25bps Fed cut in December — a sharp decline from 67% last week, reducing near-term dovish expectations.
Overall, the macro backdrop remains slightly USD-supportive, maintaining upward pressure on USD/CAD as long as oil prices stay weak and Fed officials maintain a cautious stance.
🔑 Key Technical Levels
Resistance: 1.4066 – 1.4072
Support: 1.4014 – 1.4019
Psychological Level: 1.4050
📌 Trade Summary
USD/CAD sustains above the 1.4010 support region, keeping the short-term bias tilted to the upside. Weakening oil prices and cautious Fed rhetoric favour a rebound toward 1.4066–1.4072.
A break below 1.4011 would negate the bullish scenario and shift focus toward 1.3980.
⚠️ Disclaimer
This analysis is for reference only and does not constitute trading advice. Trading involves significant risk, and proper risk management is essential.

USD/CAD: Wave of Destruction or Dollar RevivalUSD/CAD: Wave of Destruction or Dollar Revival
📈 Possible Scenarios for the Week
Bearish Scenario (Main Scenario):
Price breaks below ~1.3777
Wave (5) is developing → possible decline to ~1.3570–1.3425
Corrective (Bullish) Scenario:
USD/CAD holds current support
A corrective wave upward is developing to ~1.3970–1.4150
Consolidation:
Range between ~1.3777 and ~1.3970
Prices are gaining strength before the next impulse
✅ Conclusion
USD/CAD could see significant movement in the coming week—the pair is at a crossroads: either the major bearish impulse will continue, or an upward correction will begin.
Key levels: 1.3777 (support) and 1.3970 (resistance)
When trading, it's worth watching for confirmation of the wave structure and price reaction at the designated levels.

USDCAD uptrend still holdingUSDCAD uptrend still looks strong, I am looking for long entries in 2 different scenarios. If the current November low holds at 1.39854 and that is the low for the month, I would put my risk there. If it doesn't hold and creates a new November low but the low of October hold at 1.38877 would need to hold. In both those scenarios I remain bullish
looking for entires to the upside. Only if the October low breaks will I think reevaluate my bullish view. OANDA:USDCAD

Long usdcad Long usdcad. I was expecting a reversal yesterday with a FVG but it appeared on the last candle of the day. That said, we'll be using the low of that candle as stop low and not the actual weekly lowest price so far. If candle moves below that candle, lower lows will be made
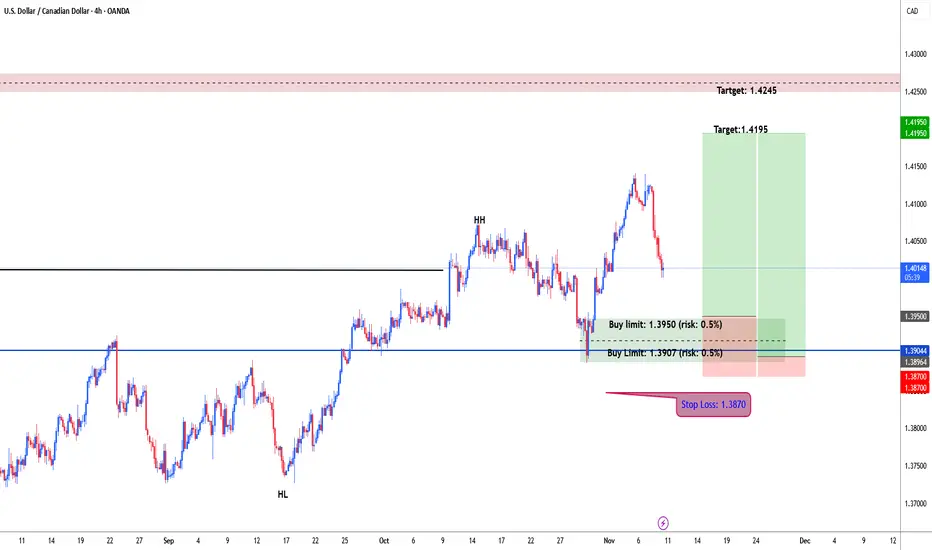
USDCAD possible bullish for 1.4195 & 1.4245#usdcad daily chart forming higher high and higher low. usdcad price broke and closed above 1.4016. wait for correction and test demand zone for another leg higher. i placed my orders at 1.3950 & 1.3906 each with 0.5% risk. stop loss: 1.3870. target: 1.4195 & 1.4245 as well.
USDCAD Eye a Deeper Pullback as Oil & Dollar Momentum CoolsUSDCAD, After a sharp rebound toward 1.4020, USD/CAD is showing signs of exhaustion as selling pressure re-emerges at the top of the recent range. With oil prices stabilizing near mid-60s and the Bank of Canada signaling patience amid weak but steady domestic data, the pair faces the risk of another leg lower toward 1.39 and possibly 1.38 if U.S. data underperforms.
Current Bias
Bearish – USDCAD is holding below key resistance at 1.4030, with price action suggesting a potential correction toward 1.3910 and 1.3810 in the short term.
Key Fundamental Drivers
Oil Recovery: Crude oil has rebounded from recent lows, supporting the Canadian dollar and easing upward pressure on USD/CAD.
Divergent Central Bank Tone: The Fed remains cautious on cuts, while the BoC maintains a “wait and assess” stance, reflecting a balanced policy gap that limits upside for USD/CAD.
Data Softness: Canada’s growth data remains sluggish, but labor market strength offsets deeper pessimism. Meanwhile, U.S. consumer and manufacturing resilience keeps USD demand steady.
Yield Differentials: Modest narrowing between U.S. and Canadian yields favors mild CAD appreciation if risk sentiment holds stable.
Macro Context
U.S. economy continues to show solid momentum, though some leading indicators are flattening. Fed officials, including Logan and Schmid, have signaled that rates are restrictive enough but still not ready for aggressive cuts.
In Canada, Q2 GDP showed contraction, but employment and wage data suggest the downturn is shallow. The BoC remains cautious, preferring stability over immediate easing. Oil’s moderate rebound and stable export demand provide underlying CAD support.
Globally, energy market stabilization and China’s steady PMI data are limiting risk-off flows, reducing USD’s haven premium.
Primary Risk to the Trend
A sudden decline in oil prices or a hawkish shift from the Fed could reignite USD strength and push USD/CAD back toward 1.41+. Conversely, an unexpected BoC hawkish tone or strong Canadian employment data could accelerate the downside.
Most Critical Upcoming News/Event
U.S. ISM Manufacturing and Services PMI
U.S. Non-Farm Payrolls and CPI data
Canada Employment Report and Ivey PMI
BoC’s Business Outlook Survey
Leader/Lagger Dynamics
USD/CAD typically acts as a lagger to broader USD trends but a leader among commodity-linked currencies (AUD/CAD, NZD/CAD). Oil and Treasury yield moves drive its direction, while DXY strength or weakness sets the overall bias.
Key Levels
Support Levels: 1.3910, 1.3810
Resistance Levels: 1.4030, 1.4080
Stop Loss (SL): 1.4070 (above structural resistance)
Take Profit (TP): 1.3810 (lower support confluence)
Summary: Bias and Watchpoints
USDCAD carries a bearish bias as short-term momentum fades below 1.4030. The combination of firmer oil prices, a steady BoC stance, and a cooling dollar backdrop sets the stage for a pullback toward 1.3910 and potentially 1.3810. Traders should watch for confirmation from upcoming U.S. ISM and jobs data, which could either reinforce the correction or restore USD dominance. A stop above 1.4070 helps protect against sudden yield-driven spikes, while 1.3810 remains the key target zone aligned with both technical structure and the evolving macro narrative.

USD/CAD) Bullish trend analysis Read The captionSMC Trading point update
Technical analysis of USD/CAD on the 4H t
Overall Concept
The analysis suggests a retracement entry before a continuation to the upside.
The market is currently bullish, respecting higher highs and higher lows.
The analyst expects a pullback into a discount zone (Fibonacci retracement) before a move toward the target point at 1.41464.
---
Technical Breakdown
1. Trend Context
Price is trading above both the 50 EMA (1.40120) and 200 EMA (1.39622) → confirming bullish momentum.
The strong impulsive bullish candles indicate institutional buying.
2. Key Levels
Current Price: 1.40843
Retracement Zone (Potential Buy Area): Between the 0.62–0.79 Fibonacci retracement levels (≈1.4060–1.4040).
Target Point: 1.41464
3. Fibonacci Tool
The retracement tool is drawn from the most recent swing low to swing high.
The blue shaded zone marks the discount entry zone, ideal for smart money re-entry after a short pullback.
4. Expected Move
Scenario: Price retraces to the 0.62–0.79 zone (liquidity sweep or mitigation of demand)
Then: A bullish continuation toward 1.4146 target level, which aligns with previous liquidity or imbalance area.
5. Volume & Confirmation
Volume is moderate (14.73K), supporting a healthy bullish push after correction.
Candlestick structure shows strong bullish impulses with minor pullbacks → confirming buyer control.
---
Trade Idea Summary
Bias: Bullish
Entry Zone: 1.4060 – 1.4040 (Fibonacci discount zone)
Stop Loss: Below 1.4020 (beneath previous structure)
Target: 1.4146
Risk-to-Reward (RR): Approximately 1:3 or better
Mr SMC Trading point
---
Confirmation to Watch
Bullish rejection candle or engulfing pattern within the blue zone
EMA 50 holding as dynamic support
Possible equal highs liquidity sweep near 1.4146 as the final take-profit zone
Please support boost 🚀 this analysis

#USDCAD: Price to continue remain bullish! Let's wait and watchDear traders,
I hope you all are doing well.
The USDCAD pair has been extremely bullish since the CAD currency began to decline. We now have an excellent opportunity to rise, with the potential for the price to reverse in good time. This analysis is based solely on the current market conditions and price behaviour, so it may differ from your own views. The target is a swing, and you can adjust it according to your own analysis. Please use this analysis for educational purposes only.
Good luck and trade safely!
Team Setupsfx_

USD/CAD(20251103)Today's AnalysisMarket News:
Starting November 2nd, North America will begin observing winter time. Trading hours for US and Canadian financial markets (gold, silver, crude oil, US stocks, etc.) and the release times of economic data will be delayed by one hour compared to summer time.
Technical Analysis:
Today's Buy/Sell Threshold:
1.4008
Support and Resistance Levels:
1.4064
1.4043
1.4029
1.3986
1.3972
1.3952
Trading Strategy:
A break above 1.4029 could be a buy signal, with a first target price of 1.4043.
A break below 1.4008 could be a sell signal, with a first target price of 1.3986.

USDCAD: Momentum Falters as Bears Eye Deeper CorrectionAfter a strong run higher, USDCAD is now showing signs of exhaustion. Price action has slipped below a short-term trendline, and with CAD fundamentals anchored by oil prices, the pair looks increasingly vulnerable to a pullback. The recent stalling near 1.4070 suggests buyers may be losing grip, opening the door for sellers to drive a corrective wave lower.
Current Bias
Bearish – momentum has shifted, with lower highs forming and trendline support already breached.
Key Fundamental Drivers
USD: Fed officials remain cautious on cutting rates too quickly, but sticky inflation risks could limit downside in the dollar.
CAD: Supported by oil market stability and resilient wage data, even as broader growth remains soft.
Relative Outlook: CAD gains the upper hand in commodity-driven environments, particularly when oil stays bid.
Macro Context
Interest Rates: Fed is on a slower path to easing compared to the BoC, but markets have priced in eventual US rate cuts.
Economic Growth: US growth is slowing but still outpacing Canada, though oil revenues balance the picture for CAD.
Commodity Flows: Oil prices remain the most critical support for CAD. Any extended rally in energy prices strengthens downside bias in USDCAD.
Geopolitical Themes: US trade tensions and global policy risks feed USD volatility, while CAD’s link to oil offers a clearer directional driver.
Primary Risk to the Trend
A sudden drop in oil prices or a hawkish Fed surprise could lift USD and break bearish momentum in USDCAD.
Most Critical Upcoming News/Event
US PCE inflation and labor market data.
Canada employment and CPI releases.
Weekly oil inventories and OPEC+ commentary.
Leader/Lagger Dynamics
USDCAD often trades as a lagger, following USD moves against majors like EURUSD or DXY. It also shadows oil fluctuations, making CAD more reactive than proactive.
Key Levels
Support Levels: 1.3910, 1.3818, 1.3738
Resistance Levels: 1.4029, 1.4079
Stop Loss (SL): 1.4079
Take Profit (TP): 1.3818 (first), 1.3738 (extended)
Summary: Bias and Watchpoints
USDCAD is leaning bearish after breaking below its short-term trendline, with price action suggesting a correction toward 1.3910 and potentially 1.3818. The trade setup favors shorts with SL above 1.4079 to protect against Fed-driven dollar spikes. CAD strength remains tied to oil, so energy headlines are crucial watchpoints. While USD remains fundamentally supported, the short-term flow favors sellers, making this a correction opportunity rather than a trend reversal.

Trading Map for USD/CAD — Bullish Layered Entry Strategy🦒 The Loonie Heist: USD/CAD Swing & Day Trade Wealth Map 🚀
Asset: USD/CAD ("The Loonie")
Outlook: Bullish 📈
Vibe: Thief-Style Layering Strategy — Sneaky, Smart, and Stylish 😎
Welcome, Ladies and Gentlemen, to the Loonie Heist! This USD/CAD trading plan is designed for the crafty traders out there — our Thief OG's — ready to layer up entries and snatch profits like pros. Let’s break down this stylish, rule-compliant TradingView idea that’s ready to steal the spotlight! ✨
📜 The Plan: Bullish Breakout with a Thief’s Precision 🕵️♂️
Strategy: Thief Layering — A multi-limit order approach for smooth, calculated entries.
Entry Levels: Deploy your buy limit orders like a mastermind at:
1.39300
1.39400
1.39500
1.39600
Pro Tip: Feel free to add more layers based on your risk appetite — scale it up, Thief OG style!
Stop Loss (SL): Set a sneaky SL at 1.39000 to guard your loot.
Note: This is my suggested SL, but you’re the boss of your trades — adjust to your risk tolerance! ⚠️
Take Profit (TP): Aim for 1.40500, just shy of the 1.40600 police barricade (a strong resistance zone with overbought signals and potential traps). Lock in profits and escape like a pro! 🏃♂️ Note: TP is your call — take the money when it feels right!
🔍 Why USD/CAD? Key Market Insights 🧠
Market Context: USD/CAD is riding a bullish wave, driven by USD strength and CAD’s sensitivity to oil prices. Keep an eye on macroeconomic data like US Non-Farm Payrolls and Canadian employment reports, as they can sway the Loonie! 📊
Technical Setup: The pair is testing key support levels around 1.39300–1.39600, making it a prime spot for layered entries. The 1.40600 resistance is a historical hurdle, so watch for price action there! 🚨
Thief’s Edge: By layering buy limits, you’re stacking the odds in your favor, catching dips and riding the trend with finesse.
💰 Related Pairs to Watch 👀
Keep these correlated pairs on your radar to spot opportunities and confirm trends:
OANDA:USDCHF ($): Positive correlation with USD/CAD due to USD strength. If USD/CHF is climbing, it could signal more upside for USD/CAD.
OANDA:AUDUSD ($): Negative correlation with USD/CAD. A falling AUD/USD (stronger USD) often aligns with USD/CAD bullish moves.
OANDA:NZDUSD ($): Similar to AUD/USD, this pair’s weakness can support USD/CAD’s bullish case.
Key Point: Watch oil prices (WTI, Brent) since CAD is a commodity currency. If oil weakens, USD/CAD may push higher! 🛢️
⚠️ Risk Management (Thief’s Code) 🛡️
Risk Disclaimer: Trading is a high-stakes game, and this Thief-Style Strategy is for fun and educational purposes. Always manage your risk, set your own SL/TP, and trade responsibly. Don’t chase the market — let it come to you!
Position Sizing: Adjust your lot sizes based on your account and risk tolerance. The Thief OG never risks the whole vault! 💸
✨ “If you find value in my analysis, a 👍 and 🚀 boost is much appreciated — it helps me share more setups with the community!”
Disclaimer: This is a Thief-Style Trading Strategy crafted for fun and educational purposes. Trade at your own risk, and always conduct your own analysis.
#Hashtags: #USDCAD #Forex #SwingTrading #DayTrading #ThiefStrategy #LoonieHeist #Bullish #TradingView