USDCADUSDCAD
- Bullish Channel as an corrective pattern in Long Time Frame
- Completed " 123 " Impulsive Waves
- Fibonacci Level - 61.80%
- S / R Level
- RSI - Divergence
Usdcadsell

USDCAD Bearish Trend Continuation From Marked ResistancesH4 - Bearish Trend in play
Two Solid Resistance Levels
Trend continuation very likely after pullback.

USDCAD - Looking To Sell Pullbacks In The Short TermH4 - Strong bearish move.
No opposite signs.
Expecting bearish continuation until the two Fibonacci resistance zones hold.
If you enjoy this idea, don’t forget to LIKE 👍, FOLLOW ✅, SHARE 🙌, and COMMENT ✍! Drop your thoughts and charts below to keep the discussion going. Your support helps keep this content free and reach more people! 🚀
--------------------------------------------------------------------------------------------------------

USDCAD BUY | Day Trading AnalysisHello Traders, here is the full analysis.
Price reversal going up, levels for BUY .. GOOD LUCK! Great BUY opportunity USDCAD
I still did my best and this is the most likely count for me at the moment.
Support the idea with like and follow my profile TO SEE MORE.
Traders, if you liked this idea or if you have your own opinion about it, write in the comments. I will be glad 🤝
Patience is the If You Have Any Question, Feel Free To Ask 🤗
Just follow chart with idea and analysis and when you are ready come in THE GROVE | VIP GROUP, earn more and safe, wait for the signal at the right moment and make money with us💰

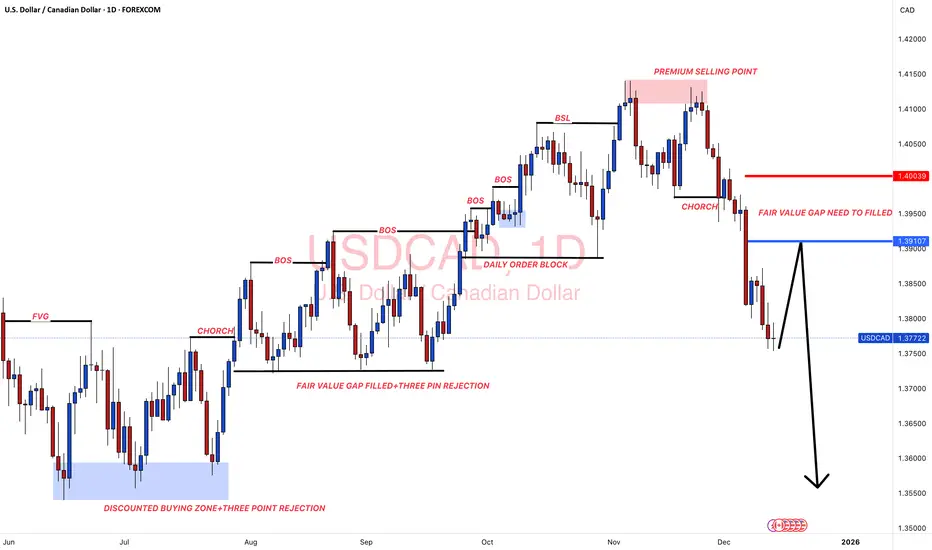
#USDCAD: A Perfect Selling Zone For The Week 15/12/2025Dear Traders,
Overview On USDCAD📈
🔺Price has left a great area of selling zone which need to be filled; we already have given an entry point and an exit point for you to identify the selling zone easily. USD is likely to show some minor bullish behaviour which will push the price of USDCAD to our point of interest.
🔺There is only one swing selling target that we currently have, this is not a long term trade instead or intraday trade.
Entry and Stop Loss Planning📊
🔺You must use your own knowledge to establish trading plan successfully, entry at the area as described in the chart only if it matches your bias.
🔺Use 'Red Line' as a exit point or as a stop loss also trade with accurate lot size based on your account.
🔺Take Profit Set at the 'Black Arrow' Ends.
Support and Encouragement ❤️🏆
If you like our idea then please like and comment which will encourage us to post such more ideas. Also share your views in the comment sections.
Tean Setupsfx_
USDCAD: +400 Pips Selling Opportunity!Overview🧠
The USDCAD currency pair has reversed and a potential change in trend is occurring. Confirmation is required before a sell entry can be made. The only take profit is a swing move with a potential gain of approximately 400 pips. The stop loss can be placed above the higher high. Please like and comment for more.
Team Setupsfx

USDCAD Will Keep Falling!
HI,Traders !
#USDCAD is trading in a
Downtrend and the pair made
A retest of the horizontal
Resistance of 1.39769 from where
We are already seeing a bearish
Move down so we will be
Expecting a further
Bearish move down !
Comment and subscribe to help us grow !

USD/CAD Price Outlook – Trade Setup📊 Technical Structure
OANDA:USDCAD USD/CAD is trading flat around 1.3950, holding below the 1.3966–1.3975 Resistance Zone, where repeated rejections keep the short-term bias tilted to the downside. The pair continues to oscillate within a compressed structure, failing to sustain any break above resistance, while the 1.3928–1.3937 Support Zone remains untested below.
As long as price stays under the resistance band, the structure favours another push lower toward support. A clean hourly close above 1.3975 would invalidate the bearish setup and shift momentum back upward.
🎯 Trade Setup
Entry: 1.3966 – 1.3975
Stop Loss: 1.3980
Take Profit 1: 1.3937
Take Profit 2: 1.3928
Risk–Reward Ratio: Approximately 1 : 2.5
Bearish structure remains valid below 1.3975. A breakout above this level invalidates the setup.
🌐 Macro Background
USD/CAD trades in a tight range ahead of Canada’s November employment report. Markets expect the Unemployment Rate to rise to 7%, signalling slower labour-market conditions and increasing the likelihood that the Bank of Canada (BoC) could extend its easing cycle at next week’s policy meeting. Soft Canadian data would generally weaken the CAD.
Meanwhile, the US Dollar remains subdued as traders firmly price in a 25 bps Fed rate cut at the December 9–10 meeting. According to the CME FedWatch Tool, the probability of a cut stands near 87%. Weakening labour-market indicators in the US and expectations that tariff-driven inflation is non-persistent add to the dovish pressure on the USD.
Overall, both currencies face macro headwinds, but the technical picture for USD/CAD favours a downside continuation toward support unless Canada’s jobs report surprises significantly.
🔑 Key Technical Levels
Resistance Zone: 1.3966 – 1.3975
Support Zone: 1.3928 – 1.3937
Structure Break (Invalidation): 1.3980
Targets: 1.3937 / 1.3928
📌 Trade Summary
USD/CAD remains capped beneath the resistance zone, preserving a short-term bearish structure. The preferred approach is to sell into 1.3966–1.3975, targeting a move back toward 1.3928–1.3937 support. A sustained move above 1.3980 cancels the setup.
⚠️ Disclaimer
This analysis is for reference only and does not constitute trading advice. Trading involves significant risk, and proper risk management is essential.

USDCADUSDCAD
- Double Top in Short Time Frame
- Completed " 12345 " Impulsive Waves
- Break of Structure
- RSI - Divergence
- Bullish Channel as an corrective pattern in Long Time Frame

USDCAD Forming Falling WedgeUSDCAD is trading inside a clear bearish structure, where price has formed a rising channel that is now losing momentum, aligning with the characteristics of a developing falling wedge scenario. The pair recently rejected the upper boundary of the channel, showing strong seller presence near the 1.42000 region. This rejection confirms that bullish momentum is weakening and that the market may be preparing for a downside shift. The lower trendline is the key structural zone, and once price breaks below it, the bearish wave is likely to accelerate toward the major demand area around 1.36000 – a level that has historically triggered significant reversals.
From a fundamental perspective, the Canadian Dollar continues to find strength as oil markets remain stable and demand outlook improves. At the same time, the US Dollar is showing signs of cooling as expectations rise that the Federal Reserve could adjust its policy stance going into early 2026. Slower inflation progress and softer economic numbers have reduced USD buying pressure, giving CAD the upper hand. This shifting macro sentiment directly supports a bearish continuation in USDCAD, especially as long as the pair remains below the key resistance zones visible on the chart.
As the price compresses within this wedge structure, volatility tends to contract before a cleaner breakout occurs. If the pair decisively breaks the lower boundary with momentum, a sharp sell-off into the previous accumulation zone becomes highly probable. That zone still holds untested liquidity, making it an attractive magnet for price. Traders will be watching for volume spikes and strong bearish candles to confirm the breakout and validate the short bias.
Overall, USDCAD remains positioned for a high-probability bearish move as technical structure, trend exhaustion, liquidity gaps, and fundamentals all align toward the downside. The falling wedge compression suggests a strong potential for a profitable continuation setup once the breakout confirms.

SHORT ON USD/CADUSD/CAD has reached a major level or resistance and is giving us a slight change of character to the downside.
I will be selling usd/cad to the next demand zone looking to catch 100-200 pips.

USDCAD Resistance Ahead!
HI,Traders !
#USDCAD keeps going up
And the pair is locally oversold
So after it hits the horizontal
Resistance of 1.40666 we
Will be expecting a local
Bearish correction !
Comment and subscribe to help us grow !

USD/CAD: Wave of Destruction or Dollar RevivalUSD/CAD: Wave of Destruction or Dollar Revival
📈 Possible Scenarios for the Week
Bearish Scenario (Main Scenario):
Price breaks below ~1.3777
Wave (5) is developing → possible decline to ~1.3570–1.3425
Corrective (Bullish) Scenario:
USD/CAD holds current support
A corrective wave upward is developing to ~1.3970–1.4150
Consolidation:
Range between ~1.3777 and ~1.3970
Prices are gaining strength before the next impulse
✅ Conclusion
USD/CAD could see significant movement in the coming week—the pair is at a crossroads: either the major bearish impulse will continue, or an upward correction will begin.
Key levels: 1.3777 (support) and 1.3970 (resistance)
When trading, it's worth watching for confirmation of the wave structure and price reaction at the designated levels.

There is potential for a correction in the coming months.We are entering one of the most exciting market phases: the start of new major impulse waves in various currency pairs.
For the USD/CAD pair, the corrective phase is coming to an end, and the next major move is forming. What happens next could define opportunities for the next 3–6 months.
Additional Context Analysis:
This analysis uses Elliott Wave terminology, which divides market movements into impulse waves (movements in line with the trend) and corrective waves (movements against the trend).
The key message is that the recent USD/CAD price volatility is merely a correction ahead of a much larger and more profitable impulse move.

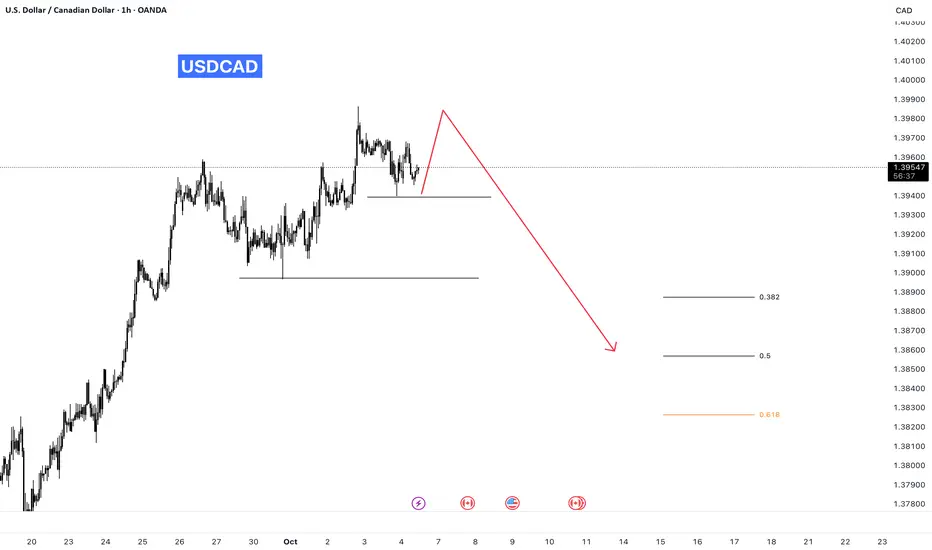
USD/CAD) Bearish trend analysis Read The captionSMC Trading point update
Technical analysis of USD/CAD on the 1-hour timeframe. Let’s break down the analysis idea clearly:
---
l Market Context
The overall trend is bearish, as price is trading below both the 50 EMA and 200 EMA, which are sloping downward.
The recent bullish correction appears to have been a retracement within the broader downtrend.
---
Key Technical Insights
1. Bearish Structure:
Price broke below a previous low and confirmed a lower low (LL).
A small bearish flag or rising channel formed during the retracement — a common continuation pattern.
2. Supply Zone (Blue Box):
This zone represents the previous demand turned supply, where sellers re-entered strongly.
Price tapped into this area and sharply rejected, confirming supply dominance.
3. EMA Confluence:
Both EMA(50) and EMA(200) are above price, acting as dynamic resistance.
The rejection from the blue zone occurred around EMA confluence — a strong bearish confirmation signal.
---
Projected Price Action
The structure suggests a minor pullback (to form a lower high) before continuing downward.
The drawn path shows price retesting a small intraday resistance area before resuming the drop.
Target Point: 1.39689 — near the next structural low / liquidity area.
---
Trade Idea Summary
Bias: Bearish continuation
Entry Zone: 1.4010–1.4030 area (retest of minor resistance or broken structure)
Target: 1.3969
Stop-Loss: Above 1.4048 (above supply zone / EMAs)
Risk/Reward Ratio: Approx. 1:2.5 to 1:3 potential setup
Mr SMC Trading point
---
Concept Summary
This setup follows Smart Money Concepts (SMC) logic:
Break of structure → Retracement into supply → Continuation in direction of the higher timeframe trend.
---
Please support boost 🚀 this analysis

USDCAD Eye a Deeper Pullback as Oil & Dollar Momentum CoolsUSDCAD, After a sharp rebound toward 1.4020, USD/CAD is showing signs of exhaustion as selling pressure re-emerges at the top of the recent range. With oil prices stabilizing near mid-60s and the Bank of Canada signaling patience amid weak but steady domestic data, the pair faces the risk of another leg lower toward 1.39 and possibly 1.38 if U.S. data underperforms.
Current Bias
Bearish – USDCAD is holding below key resistance at 1.4030, with price action suggesting a potential correction toward 1.3910 and 1.3810 in the short term.
Key Fundamental Drivers
Oil Recovery: Crude oil has rebounded from recent lows, supporting the Canadian dollar and easing upward pressure on USD/CAD.
Divergent Central Bank Tone: The Fed remains cautious on cuts, while the BoC maintains a “wait and assess” stance, reflecting a balanced policy gap that limits upside for USD/CAD.
Data Softness: Canada’s growth data remains sluggish, but labor market strength offsets deeper pessimism. Meanwhile, U.S. consumer and manufacturing resilience keeps USD demand steady.
Yield Differentials: Modest narrowing between U.S. and Canadian yields favors mild CAD appreciation if risk sentiment holds stable.
Macro Context
U.S. economy continues to show solid momentum, though some leading indicators are flattening. Fed officials, including Logan and Schmid, have signaled that rates are restrictive enough but still not ready for aggressive cuts.
In Canada, Q2 GDP showed contraction, but employment and wage data suggest the downturn is shallow. The BoC remains cautious, preferring stability over immediate easing. Oil’s moderate rebound and stable export demand provide underlying CAD support.
Globally, energy market stabilization and China’s steady PMI data are limiting risk-off flows, reducing USD’s haven premium.
Primary Risk to the Trend
A sudden decline in oil prices or a hawkish shift from the Fed could reignite USD strength and push USD/CAD back toward 1.41+. Conversely, an unexpected BoC hawkish tone or strong Canadian employment data could accelerate the downside.
Most Critical Upcoming News/Event
U.S. ISM Manufacturing and Services PMI
U.S. Non-Farm Payrolls and CPI data
Canada Employment Report and Ivey PMI
BoC’s Business Outlook Survey
Leader/Lagger Dynamics
USD/CAD typically acts as a lagger to broader USD trends but a leader among commodity-linked currencies (AUD/CAD, NZD/CAD). Oil and Treasury yield moves drive its direction, while DXY strength or weakness sets the overall bias.
Key Levels
Support Levels: 1.3910, 1.3810
Resistance Levels: 1.4030, 1.4080
Stop Loss (SL): 1.4070 (above structural resistance)
Take Profit (TP): 1.3810 (lower support confluence)
Summary: Bias and Watchpoints
USDCAD carries a bearish bias as short-term momentum fades below 1.4030. The combination of firmer oil prices, a steady BoC stance, and a cooling dollar backdrop sets the stage for a pullback toward 1.3910 and potentially 1.3810. Traders should watch for confirmation from upcoming U.S. ISM and jobs data, which could either reinforce the correction or restore USD dominance. A stop above 1.4070 helps protect against sudden yield-driven spikes, while 1.3810 remains the key target zone aligned with both technical structure and the evolving macro narrative.

USDCAD: Momentum Falters as Bears Eye Deeper CorrectionAfter a strong run higher, USDCAD is now showing signs of exhaustion. Price action has slipped below a short-term trendline, and with CAD fundamentals anchored by oil prices, the pair looks increasingly vulnerable to a pullback. The recent stalling near 1.4070 suggests buyers may be losing grip, opening the door for sellers to drive a corrective wave lower.
Current Bias
Bearish – momentum has shifted, with lower highs forming and trendline support already breached.
Key Fundamental Drivers
USD: Fed officials remain cautious on cutting rates too quickly, but sticky inflation risks could limit downside in the dollar.
CAD: Supported by oil market stability and resilient wage data, even as broader growth remains soft.
Relative Outlook: CAD gains the upper hand in commodity-driven environments, particularly when oil stays bid.
Macro Context
Interest Rates: Fed is on a slower path to easing compared to the BoC, but markets have priced in eventual US rate cuts.
Economic Growth: US growth is slowing but still outpacing Canada, though oil revenues balance the picture for CAD.
Commodity Flows: Oil prices remain the most critical support for CAD. Any extended rally in energy prices strengthens downside bias in USDCAD.
Geopolitical Themes: US trade tensions and global policy risks feed USD volatility, while CAD’s link to oil offers a clearer directional driver.
Primary Risk to the Trend
A sudden drop in oil prices or a hawkish Fed surprise could lift USD and break bearish momentum in USDCAD.
Most Critical Upcoming News/Event
US PCE inflation and labor market data.
Canada employment and CPI releases.
Weekly oil inventories and OPEC+ commentary.
Leader/Lagger Dynamics
USDCAD often trades as a lagger, following USD moves against majors like EURUSD or DXY. It also shadows oil fluctuations, making CAD more reactive than proactive.
Key Levels
Support Levels: 1.3910, 1.3818, 1.3738
Resistance Levels: 1.4029, 1.4079
Stop Loss (SL): 1.4079
Take Profit (TP): 1.3818 (first), 1.3738 (extended)
Summary: Bias and Watchpoints
USDCAD is leaning bearish after breaking below its short-term trendline, with price action suggesting a correction toward 1.3910 and potentially 1.3818. The trade setup favors shorts with SL above 1.4079 to protect against Fed-driven dollar spikes. CAD strength remains tied to oil, so energy headlines are crucial watchpoints. While USD remains fundamentally supported, the short-term flow favors sellers, making this a correction opportunity rather than a trend reversal.

USDCAD Will Go Down!
HI,Traders !
#USDCAD made a bearish
Breakout of the rising support
And is now consolidating
Below the line so we are
Bearish biased and we will
Be expecting a further
Bearish continuation !
Comment and subscribe to help us grow !

USD/CAD(20251022)Today's AnalysisMarket News:
Citigroup has turned bearish on gold prices, predicting a drop to $4,000 within the next three months.
Technical Analysis:
Today's Buy/Sell Levels:
1.4029
Support and Resistance Levels:
1.4091
1.4068
1.4053
1.4006
1.3991
1.3967
Trading Strategy:
If the price breaks above 1.4029, consider a buy entry, with the first target at 1.4053.
If the price breaks below 1.4006, consider a sell entry, with the first target at 1.3991

SHORT ON USD/CADUSD/CAD is ready for a drop.
I will be selling USD/CAD to the next demand level looking to catch 100-150 pips

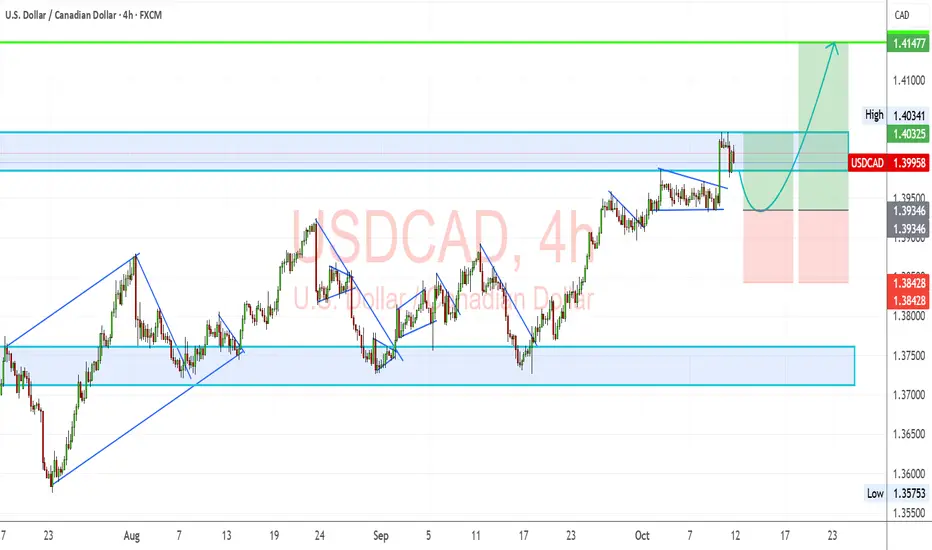
USDCAD Dollar Building as Loonie Struggles with Oil & Weak DataUSDCAD has surged into a key resistance zone, showing resilience even against temporary pullbacks. The pair is benefiting from broad USD strength as the Fed maintains a cautious stance on rate cuts, while the Canadian dollar is weighed down by weaker labor data and softer oil demand. Price action suggests the market is gearing up for another bullish extension if buyers can defend current support.
Current Bias
Bullish – upward momentum is intact with strong support holding above 1.3930 and potential continuation toward higher resistance.
Key Fundamental Drivers
USD Strength: Supported by sticky US inflation and a Fed reluctant to accelerate cuts.
CAD Weakness: Canada’s job market recovery remains patchy, with unemployment elevated and wage growth cooling.
Oil Prices: Recent volatility in crude undermines CAD, which typically benefits from higher energy prices.
Macro Context
Interest Rate Expectations: Fed holding rates steady longer, BoC facing pressure to ease further if labor market slack persists.
Economic Growth Trends: US growth remains steady, Canada showing signs of stagnation.
Commodity Flows: Oil fluctuations weigh directly on CAD; weaker demand outlook adds to downside risk.
Geopolitical Themes: Global tariff disputes and risk aversion support USD safe-haven flows at the expense of CAD.
Primary Risk to the Trend
A sharp rebound in oil prices or stronger-than-expected Canadian inflation data could strengthen CAD and cap USD gains.
Most Critical Upcoming News/Event
Canada CPI (Oct 22) will be critical for BoC expectations.
US CPI and Fed speeches remain key for dollar direction.
Leader/Lagger Dynamics
USDCAD is more of a lagger, reacting to USD moves and oil-driven CAD flows. It follows broader USD direction but can influence CAD crosses like CADJPY and EURCAD.
Key Levels
Support Levels:
1.3930 (short-term support)
1.3842 (structural support)
Resistance Levels:
1.4035 (near-term resistance)
1.4147 (major target)
Stop Loss (SL): 1.3842
Take Profit (TP): 1.4147
Summary: Bias and Watchpoints
USDCAD bias is bullish, with buyers defending support and positioning for another leg higher. The fundamental backdrop of a stronger USD and weaker CAD underpins the move, with oil prices adding a bearish weight to the Canadian dollar. The setup looks favorable for continuation toward 1.4147, provided support at 1.3930 holds. Stop loss sits at 1.3842 to protect against a deeper correction, while the take profit is set at 1.4147. The pair remains a lagger, following USD strength and oil dynamics, making US and Canadian inflation data the most important watchpoints ahead.
usdcad bearish swing setupRSI Divergence
Wait for a double top formation.
Enter on the last higher low (HL).
Maintain a risk-to-reward ratio (RRR) of 1:2.
The bullish trend on the higher timeframe should ideally correct to the 50–60% Fibonacci retracement level.
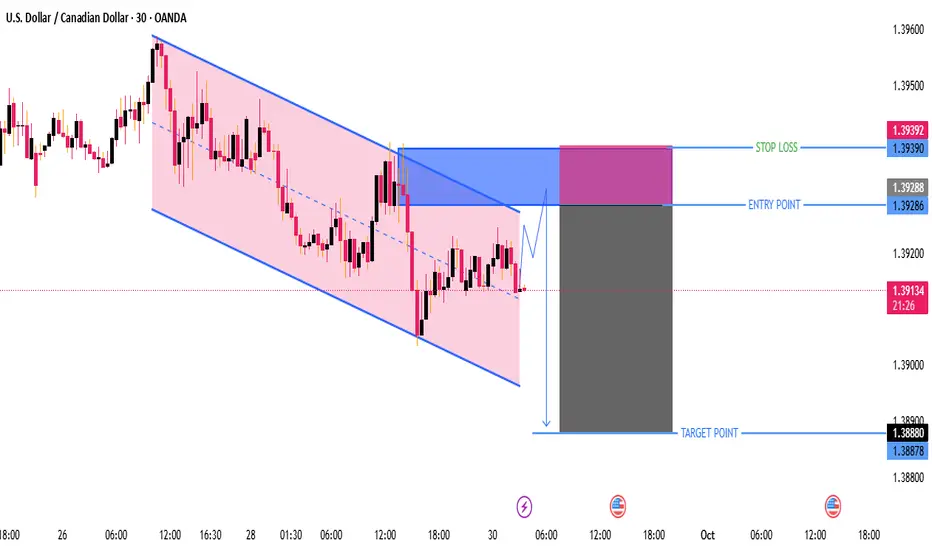
USD/CAD Bearish Channel Breakout – Short SetupThis chart is for USD/CAD (30-min timeframe) and shows a clear bearish setup.
Here’s the breakdown:
---
1. Pattern
Price is moving inside a downward channel (highlighted in pink).
Currently near the midline of the channel with potential to retest the upper boundary.
The plan here seems to be a sell setup after a small bullish pullback.
---
2. Key Levels
Entry Point: 1.39286 (after price pulls back into the blue zone).
Stop Loss: 1.39392 (just above the channel and resistance zone – good risk management).
Target Point: 1.38880 (near the lower channel boundary, aligning with previous support).
---
3. Risk-to-Reward Ratio (RRR)
This setup offers a favorable RRR (roughly 1:3), meaning potential reward is about 3x the risk.
---
4. Bias
Bearish bias – expecting continuation of the downtrend after price retests resistance.
The market is respecting the descending channel, and unless price breaks above 1.3940, sellers remain in control.
---
5. Confirmation to Watch
Look for rejection candles or bearish engulfing in the blue zone before taking entry.
If price breaks and closes above 1.3940, this setup becomes invalid (bullish breakout likely).
---
✅ Summary:
This is a well-planned short (sell) setup. Wait for price to pull back to 1.3928 – 1.3930, then sell with stop above 1.3940 and target near 1.3888.