USDCHF Under Pressure! SELL!
My dear followers,
This is my opinion on the USDCHF next move:
The asset is approaching an important pivot point 0.8094
Bias - Bearish
Technical Indicators: Supper Trend generates a clear short signal while Pivot Point HL is currently determining the overall Bearish trend of the market.
Goal - 0.8070
About Used Indicators:
For more efficient signals, super-trend is used in combination with other indicators like Pivot Points.
Disclosure: I am part of Trade Nation's Influencer program and receive a monthly fee for using their TradingView charts in my analysis.
———————————
WISH YOU ALL LUCK
Usdchf!

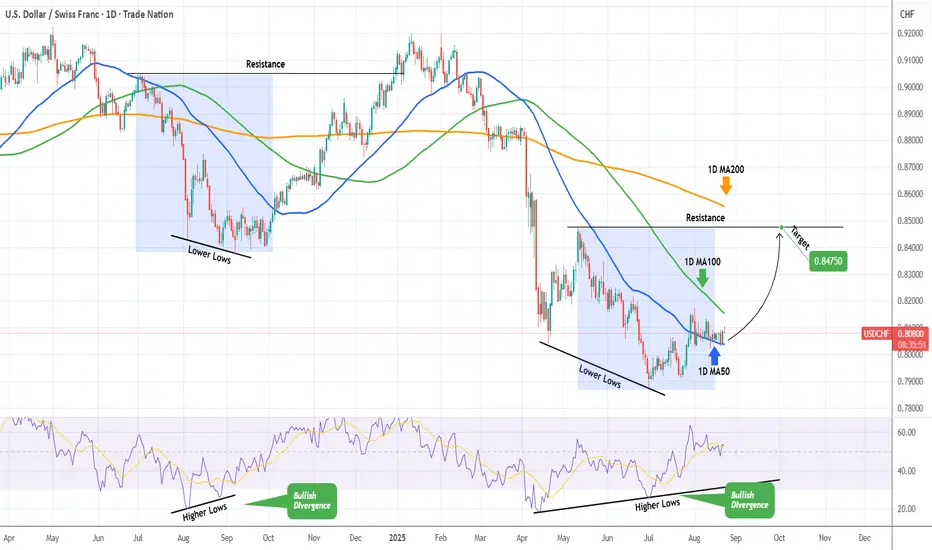
USDCHF Strong buy signal on a 2024 fractal.Last time we looked at the USDCHF pair (June 19, see chart below), we took the most optimal sell at the top of the Channel Down, which easily hit the 0.80565 Target:
This time we are getting a strong buy signal as not only is the price supported on the 1D MA50 (blue trend-line) in what seems like a Bull Flag, but also the 1D RSI is on a huge Bullish Divergence (Higher Lows against the price's Lower Lows), similar to he August 2024 pattern.
That sequence rose all the way to the upper Resistance (even broke it), so we do expect the pair to resume the rally and Target 0.84750. That might also be just in time to test the 1D MA200 (orange trend-line) for the first time since April 03.
-------------------------------------------------------------------------------
** Please LIKE 👍, FOLLOW ✅, SHARE 🙌 and COMMENT ✍ if you enjoy this idea! Also share your ideas and charts in the comments section below! This is best way to keep it relevant, support us, keep the content here free and allow the idea to reach as many people as possible. **
-------------------------------------------------------------------------------
Disclosure: I am part of Trade Nation's Influencer program and receive a monthly fee for using their TradingView charts in my analysis.
💸💸💸💸💸💸
👇 👇 👇 👇 👇 👇
USDCHF Will Go Higher! Long!
Here is our detailed technical review for USDCHF.
Time Frame: 4h
Current Trend: Bullish
Sentiment: Oversold (based on 7-period RSI)
Forecast: Bullish
The market is testing a major horizontal structure 0.808.
Taking into consideration the structure & trend analysis, I believe that the market will reach 0.811 level soon.
P.S
Overbought describes a period of time where there has been a significant and consistent upward move in price over a period of time without much pullback.
Disclosure: I am part of Trade Nation's Influencer program and receive a monthly fee for using their TradingView charts in my analysis.
Like and subscribe and comment my ideas if you enjoy them!

USDCHF BUY TREND LONG POSITIONFormed a triangle for accumulation, now its broken and gave view it going to go upside slowly. So Buy USD for long time investment now

Bearish reversal off?The Swissie (USD/CHF) is rising towards the pivot and could reverse to the multi swing low support.
Pivot: 0.81198
1st Support: 0.8033
1st Resistance: 0.8171
Risk Warning:
Trading Forex and CFDs carries a high level of risk to your capital and you should only trade with money you can afford to lose. Trading Forex and CFDs may not be suitable for all investors, so please ensure that you fully understand the risks involved and seek independent advice if necessary.
Disclaimer:
The above opinions given constitute general market commentary, and do not constitute the opinion or advice of IC Markets or any form of personal or investment advice.
Any opinions, news, research, analyses, prices, other information, or links to third-party sites contained on this website are provided on an "as-is" basis, are intended only to be informative, is not an advice nor a recommendation, nor research, or a record of our trading prices, or an offer of, or solicitation for a transaction in any financial instrument and thus should not be treated as such. The information provided does not involve any specific investment objectives, financial situation and needs of any specific person who may receive it. Please be aware, that past performance is not a reliable indicator of future performance and/or results. Past Performance or Forward-looking scenarios based upon the reasonable beliefs of the third-party provider are not a guarantee of future performance. Actual results may differ materially from those anticipated in forward-looking or past performance statements. IC Markets makes no representation or warranty and assumes no liability as to the accuracy or completeness of the information provided, nor any loss arising from any investment based on a recommendation, forecast or any information supplied by any third-party.

USD_CHF RISKY LONG|
✅USD_CHF has retested a key support level of 0.8030
And as the pair is already making a bullish rebound
A move up to retest the supply level above at 0.8060 is likely
LONG🚀
✅Like and subscribe to never miss a new idea!✅

USDCHF H4 | Potential bearish dropBased on the H4 chart analysis, we could see that the price has reacted off the sell entry, which is a pullback support, and could drop from this level to the downside.
Sell entry is at 0.8049, which is a pullback resistance.
Stop loss is at 0.8087, which is a multi swing high resistance.
Take profit is at 0.7985, which is a pullback support that lines up with the 138.2% Fibonacci extension.
High Risk Investment Warning
Trading Forex/CFDs on margin carries a high level of risk and may not be suitable for all investors. Leverage can work against you.
Stratos Markets Limited (tradu.com ):
CFDs are complex instruments and come with a high risk of losing money rapidly due to leverage. 65% of retail investor accounts lose money when trading CFDs with this provider. You should consider whether you understand how CFDs work and whether you can afford to take the high risk of losing your money.
Stratos Europe Ltd (tradu.com ):
CFDs are complex instruments and come with a high risk of losing money rapidly due to leverage. 66% of retail investor accounts lose money when trading CFDs with this provider. You should consider whether you understand how CFDs work and whether you can afford to take the high risk of losing your money.
Stratos Global LLC (tradu.com ):
Losses can exceed deposits.
Please be advised that the information presented on TradingView is provided to Tradu (‘Company’, ‘we’) by a third-party provider (‘TFA Global Pte Ltd’). Please be reminded that you are solely responsible for the trading decisions on your account. There is a very high degree of risk involved in trading. Any information and/or content is intended entirely for research, educational and informational purposes only and does not constitute investment or consultation advice or investment strategy. The information is not tailored to the investment needs of any specific person and therefore does not involve a consideration of any of the investment objectives, financial situation or needs of any viewer that may receive it. Kindly also note that past performance is not a reliable indicator of future results. Actual results may differ materially from those anticipated in forward-looking or past performance statements. We assume no liability as to the accuracy or completeness of any of the information and/or content provided herein and the Company cannot be held responsible for any omission, mistake nor for any loss or damage including without limitation to any loss of profit which may arise from reliance on any information supplied by TFA Global Pte Ltd.
The speaker(s) is neither an employee, agent nor representative of Tradu and is therefore acting independently. The opinions given are their own, constitute general market commentary, and do not constitute the opinion or advice of Tradu or any form of personal or investment advice. Tradu neither endorses nor guarantees offerings of third-party speakers, nor is Tradu responsible for the content, veracity or opinions of third-party speakers, presenters or participants.

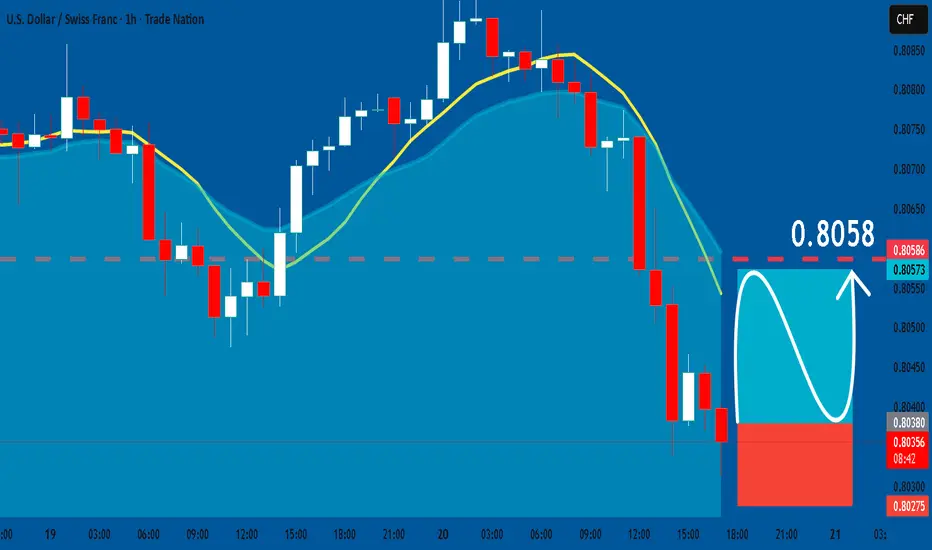
USDCHF: Long Signal with Entry/SL/TP
USDCHF
- Classic bullish setup
- Our team expects bullish continuation
SUGGESTED TRADE:
Swing Trade
Long USDCHF
Entry Point - 0.8037
Stop Loss - 0.8027
Take Profit - 0.8058
Our Risk - 1%
Start protection of your profits from lower levels
Disclosure: I am part of Trade Nation's Influencer program and receive a monthly fee for using their TradingView charts in my analysis.
❤️ Please, support our work with like & comment! ❤️
USDCHF Buyers In Panic! SELL!
My dear friends,
My technical analysis for USDCHF is below:
The market is trading on 0.8074 pivot level.
Bias - Bearish
Technical Indicators: Both Super Trend & Pivot HL indicate a highly probable USDCHF continuation.
Target - 0.8052
About Used Indicators:
A pivot point is a technical analysis indicator, or calculations, used to determine the overall trend of the market over different time frames.
Disclosure: I am part of Trade Nation's Influencer program and receive a monthly fee for using their TradingView charts in my analysis.
———————————
WISH YOU ALL LUCK

USDCHF pivotal zone consolidationThe USD/CHF pair is currently trading with a bearish bias, aligned with the broader downward trend. Recent price action shows a retest of the falling resistance, suggesting a temporary relief rally within the downtrend.
Key resistance is located at 0.8130, a prior consolidation zone. This level will be critical in determining the next directional move.
A bearish rejection from 0.8130 could confirm the resumption of the downtrend, targeting the next support levels at 0.8013, followed by 0.7985 and 0.7960 over a longer timeframe.
Conversely, a decisive breakout and daily close above 0.8130 would invalidate the current bearish setup, shifting sentiment to bullish and potentially triggering a move towards 0.8160, then 0.8200.
Conclusion:
The short-term outlook remains bearish unless the pair breaks and holds above 0.8130. Traders should watch for price action signals around this key level to confirm direction. A rejection favours fresh downside continuation, while a breakout signals a potential trend reversal or deeper correction.
This communication is for informational purposes only and should not be viewed as any form of recommendation as to a particular course of action or as investment advice. It is not intended as an offer or solicitation for the purchase or sale of any financial instrument or as an official confirmation of any transaction. Opinions, estimates and assumptions expressed herein are made as of the date of this communication and are subject to change without notice. This communication has been prepared based upon information, including market prices, data and other information, believed to be reliable; however, Trade Nation does not warrant its completeness or accuracy. All market prices and market data contained in or attached to this communication are indicative and subject to change without notice.

USDCHF - enter the zone with caution, follow the plan Team,
please follow the guideline carefully! we been killing the USDCHF last few months with proper strategy
The first probe (0.8055–0.8060) is absorbing, but sellers still have momentum.
A wick down into 0.8045–0.8035 would be the “capitulation flush” — weak longs stop out, liquidity
Phase 1 (light probe): You’re already in smal
Phase 2 (storm entry): Add heavier size at 0.8045–0.8035 (but keep stops just below 0.8020).
Phase 3 (ride the wave): If price reclaims 0.8080 → momentum flips bullish, shorts trapped.
Upside magnet: 0.8120 zone (prior supply).

USDCHF H4 | Bearish dropBased on the H4 chart analysis, we can see that the price has rejected off the sell entry and could potentially drop from this level to the downside.
Sell entry is at 0.8087, which is a pullback resistance.
Stop loss is at 0.8120, which is a pullback resistance.
Take profit is at 0.8018, which is a pullback support that is slightly below the 61.8% Fibonacci projection.
High Risk Investment Warning
Trading Forex/CFDs on margin carries a high level of risk and may not be suitable for all investors. Leverage can work against you.
Stratos Markets Limited (tradu.com ):
CFDs are complex instruments and come with a high risk of losing money rapidly due to leverage. 65% of retail investor accounts lose money when trading CFDs with this provider. You should consider whether you understand how CFDs work and whether you can afford to take the high risk of losing your money.
Stratos Europe Ltd (tradu.com ):
CFDs are complex instruments and come with a high risk of losing money rapidly due to leverage. 66% of retail investor accounts lose money when trading CFDs with this provider. You should consider whether you understand how CFDs work and whether you can afford to take the high risk of losing your money.
Stratos Global LLC (tradu.com ):
Losses can exceed deposits.
Please be advised that the information presented on TradingView is provided to Tradu (‘Company’, ‘we’) by a third-party provider (‘TFA Global Pte Ltd’). Please be reminded that you are solely responsible for the trading decisions on your account. There is a very high degree of risk involved in trading. Any information and/or content is intended entirely for research, educational and informational purposes only and does not constitute investment or consultation advice or investment strategy. The information is not tailored to the investment needs of any specific person and therefore does not involve a consideration of any of the investment objectives, financial situation or needs of any viewer that may receive it. Kindly also note that past performance is not a reliable indicator of future results. Actual results may differ materially from those anticipated in forward-looking or past performance statements. We assume no liability as to the accuracy or completeness of any of the information and/or content provided herein and the Company cannot be held responsible for any omission, mistake nor for any loss or damage including without limitation to any loss of profit which may arise from reliance on any information supplied by TFA Global Pte Ltd.
The speaker(s) is neither an employee, agent nor representative of Tradu and is therefore acting independently. The opinions given are their own, constitute general market commentary, and do not constitute the opinion or advice of Tradu or any form of personal or investment advice. Tradu neither endorses nor guarantees offerings of third-party speakers, nor is Tradu responsible for the content, veracity or opinions of third-party speakers, presenters or participants.

August 11, Forex Outlook: Key Market Expectations for the Week!Welcome back, traders!
In today’s video, we’ll be conducting a Forex Weekly Outlook, analyzing multiple currency pairs from a top-down perspective—starting from the higher timeframes and working our way down to the lower timeframes.
Pairs to focus on this Week:
USDCAD
EURGBP
EURJPY
GBPCHF
USDCHF
NZDCHF
EURNZD
Our focus will be on identifying high-probability price action scenarios using clear market structure, institutional order flow, and key confirmation levels. This detailed breakdown is designed to give you a strategic edge and help you navigate this week’s trading opportunities with confidence.
📊 What to Expect in This Video:
1. Higher timeframe trend analysis
2. Key zones of interest and potential setups
3. High-precision confirmations on lower timeframes
4. Institutional insight into where price is likely to go next
Stay tuned, take notes, and be sure to like, comment, and subscribe so you don’t miss future trading insights!
Have a great week ahead, God bless you!
The Architect 🏛️📉

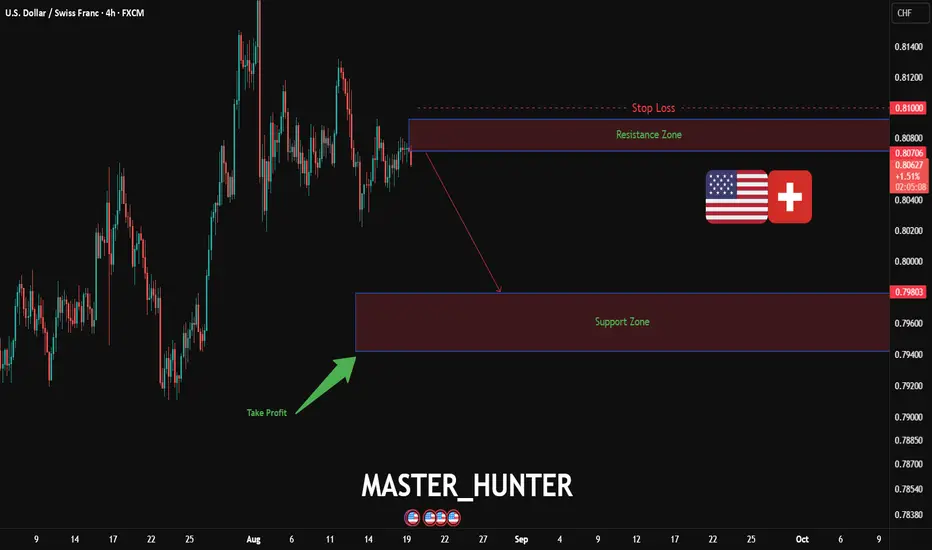
USD/CHF: Swiss Slide to 0.79795 Ahead? FX:USDCHF is showing signs of a bearish move on the 4-hour chart , with an entry zone at the red box around 0.8065 near a key resistance level. The target at 0.79795 aligns with the next support zone, offering a clear downside potential. Set a stop loss at 0.81 on a close above to manage risk effectively.
A break below 0.805 with increasing volume could confirm this slide, driven by USD weakness and CHF strength. Watch Swiss economic data and global risk sentiment as catalysts.
Ready for this move? Do you see this USD/CHF slide coming? Share your view!
#USDCHF #ForexTrading #TechnicalAnalysis #TradingView #CurrencyPairs #DayTrading #MarketSignals
Bearish Bat Pattern Forms – USDCHF Looks Ready to DropToday, I want to review USDCHF ( OANDA:USDCHF ) and lay out the fundamental and technical reasons supporting a Short position bias.
1-Fed policy expectations are the main focus — attention is on the Jackson Hole symposium and signals about the Fed’s path; this has tilted market pricing toward a less hawkish Fed.
2-Dovish bets weigh on the USD — markets are pricing in a softer Fed outlook (rate-cut expectations/pauses), which weakens the dollar.
3-CHF supported by safe-haven flows — amid global uncertainty, the Swiss franc tends to attract demand; SNB’s stance also matters for medium-term flows.
Fundamental takeaway: weaker USD (on Fed expectations) + safe-haven CHF demand = a reinforced bearish case for USDCHF in the short term.
-----------------------------------------------
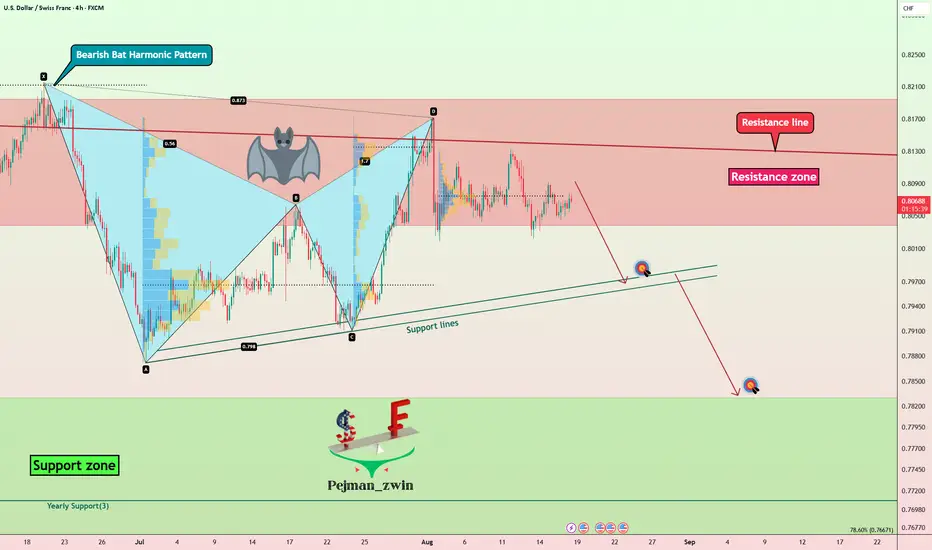
Now let's take a look at the USDCHF chart on the 4-hour time frame .
USDCHF is trading in the Resistance zone(0.819 CHF-0.804 CHF) and near the Resistance line .
It also looks like USDCHF could continue its downtrend with the help of the Bearish Bat Harmonic Pattern .
I expect USDCHF to decline at least to the Support lines .
Second Target: Support zone(0.783 CHF-0.767 CHF)
Note: Stop Loss(SL): 0.818 CHF
Please respect each other's ideas and express them politely if you agree or disagree.
U.S Dollar/Swiss Franc Analysis (USDCHF), 4-hour time frame.
Be sure to follow the updated ideas.
Do not forget to put a Stop loss for your positions (For every position you want to open).
Please follow your strategy and updates; this is just my Idea, and I will gladly see your ideas in this post.
Please do not forget the ✅' like '✅ button 🙏😊 & Share it with your friends; thanks, and Trade safe.
USD/CHF Under Downward Pressure - Will it Continue?Hello everyone, it's great to see you again.
OANDA:USDCHF is still under downward pressure after testing the resistance near the main trendline twice without breaking through. The price has been moving within a symmetrical triangle, fluctuating around the 0.805 zone.
The strong decline observed earlier in the chart shows that sellers are still in control. The environment remains favorable for the bears, with the next target for the sellers being the support zone at 0.802 - 0.800.
Do you think USD/CHF will continue to drop? Leave your thoughts in the comments below!


USDCHF OUTLOOK - SWING SETUPExpecting a bullish dollar in the next few months, which in turn will be bullish for USDCHF.
Note: ****I forgot to publish/share the trade setup after annotation.
"May fortune attend thee, and thy trade prosper." .......L2Earned

USDCHF - Follow The Bulls!Hello TradingView Family / Fellow Traders. This is Richard, also known as theSignalyst.
📈USDCHF has been overall bullish trading within the rising channel marked in blue.
This week, USDCHF has been retesting the lower bound of the channel.
Moreover, the green zone is a strong demand.
🏹 Thus, the highlighted blue circle is a strong area to look for buy setups as it is the intersection of the lower blue trendline and green demand.
📚 As per my trading style:
As #USDCHF approaches the blue circle zone, I will be looking for trend-following bullish reversal setups (like a double bottom pattern, trendline break , and so on...)
📚 Always follow your trading plan regarding entry, risk management, and trade management.
Good luck!
All Strategies Are Good; If Managed Properly!
~Rich
Disclosure: I am part of Trade Nation's Influencer program and receive a monthly fee for using their TradingView charts in my analysis.

USDCHF testing support level at 0.7970The USD/CHF pair is currently trading with a bearish bias, aligned with the broader downward trend. Recent price action shows a retest of the falling resistance, suggesting a temporary relief rally within the downtrend.
Key resistance is located at 0.8130, a prior consolidation zone. This level will be critical in determining the next directional move.
A bearish rejection from 0.8130 could confirm the resumption of the downtrend, targeting the next support levels at 0.7970, followed by 0.7930 and 0.7900 over a longer timeframe.
Conversely, a decisive breakout and daily close above 0.8130 would invalidate the current bearish setup, shifting sentiment to bullish and potentially triggering a move towards 0.8160, then 0.8200.
Conclusion:
The short-term outlook remains bearish unless the pair breaks and holds above 0.8045. Traders should watch for price action signals around this key level to confirm direction. A rejection favours fresh downside continuation, while a breakout signals a potential trend reversal or deeper correction.
This communication is for informational purposes only and should not be viewed as any form of recommendation as to a particular course of action or as investment advice. It is not intended as an offer or solicitation for the purchase or sale of any financial instrument or as an official confirmation of any transaction. Opinions, estimates and assumptions expressed herein are made as of the date of this communication and are subject to change without notice. This communication has been prepared based upon information, including market prices, data and other information, believed to be reliable; however, Trade Nation does not warrant its completeness or accuracy. All market prices and market data contained in or attached to this communication are indicative and subject to change without notice.

USD/CHF SENDS CLEAR BEARISH SIGNALS|SHORT
Hello, Friends!
USD/CHF pair is trading in a local downtrend which know by looking at the previous 1W candle which is red. On the 1H timeframe the pair is going up. The pair is overbought because the price is close to the upper band of the BB indicator. So we are looking to sell the pair with the upper BB line acting as resistance. The next target is 0.804 area.
Disclosure: I am part of Trade Nation's Influencer program and receive a monthly fee for using their TradingView charts in my analysis.
✅LIKE AND COMMENT MY IDEAS✅

USDCHF Will Go Higher From Support! Long!
Take a look at our analysis for USDCHF.
Time Frame: 4h
Current Trend: Bullish
Sentiment: Oversold (based on 7-period RSI)
Forecast: Bullish
The price is testing a key support 0.806.
Current market trend & oversold RSI makes me think that buyers will push the price. I will anticipate a bullish movement at least to 0.811 level.
P.S
Overbought describes a period of time where there has been a significant and consistent upward move in price over a period of time without much pullback.
Disclosure: I am part of Trade Nation's Influencer program and receive a monthly fee for using their TradingView charts in my analysis.
Like and subscribe and comment my ideas if you enjoy them!

Could the price bounce from here?The Swissie (USD/CHF) is reacting to the pivot and could bounce to the 1st resistance.
Pivot: 0.8040
1st Support: 0.7879
1st Resistance: 0.8171
Risk Warning:
Trading Forex and CFDs carries a high level of risk to your capital and you should only trade with money you can afford to lose. Trading Forex and CFDs may not be suitable for all investors, so please ensure that you fully understand the risks involved and seek independent advice if necessary.
Disclaimer:
The above opinions given constitute general market commentary, and do not constitute the opinion or advice of IC Markets or any form of personal or investment advice.
Any opinions, news, research, analyses, prices, other information, or links to third-party sites contained on this website are provided on an "as-is" basis, are intended only to be informative, is not an advice nor a recommendation, nor research, or a record of our trading prices, or an offer of, or solicitation for a transaction in any financial instrument and thus should not be treated as such. The information provided does not involve any specific investment objectives, financial situation and needs of any specific person who may receive it. Please be aware, that past performance is not a reliable indicator of future performance and/or results. Past Performance or Forward-looking scenarios based upon the reasonable beliefs of the third-party provider are not a guarantee of future performance. Actual results may differ materially from those anticipated in forward-looking or past performance statements. IC Markets makes no representation or warranty and assumes no liability as to the accuracy or completeness of the information provided, nor any loss arising from any investment based on a recommendation, forecast or any information supplied by any third-party.
