USDCHF Breakout in Progress – Reversal from Key Support?#USDCHF
**Pair:** USDCHF
**Current Price:** ~0.8265
**Bias:** Bullish
---
**Analysis:**
USDCHF appears to be forming a **base structure near the 0.8265 level**, where buyers are gradually stepping in. The price has broken above a short-term consolidation zone (highlighted in red) and is now attempting to push higher.
This move suggests a potential **reversal from the recent downtrend**, especially if the price holds above the **0.8265 key support**. A successful breakout and retest scenario could propel USDCHF toward the **0.8600** and even **0.9000** levels.
---
**Technical Highlights:**
- **Support Level:** 0.8265 (established demand zone)
- **Breakout Pattern:** Consolidation breakout
- **Upside Target Zones:** 0.8600 and 0.9000
- **Invalidation:** Close below 0.8265
---
**Trade Idea (Not Financial Advice):**
Watch for a bullish retest above 0.8265 for continuation plays. Confirmation with bullish momentum may open the path to medium-term upside targets.
---
> **Disclaimer:**
> This content is for educational purposes only and does not constitute financial advice. Always perform your own analysis and manage your risk carefully. Trading involves substantial risk and is not suitable for every investor.
Usdchf!

USDCHF Short Term Buy Trade Update!!!Hi Traders, on April 24th I shared this idea "USDCHF - Expecting Bullish Continuation In The Short Term"
I expected further continuation higher from the marked Fibonacci support zones. You can read the full post using the link above.
Price reached the first Fibonacci support zone, respected it and bounced higher as expected!!!
If you enjoy this idea, don’t forget to LIKE 👍, FOLLOW ✅, SHARE 🙌, and COMMENT ✍! Drop your thoughts and charts below to keep the discussion going. Your support helps keep this content free and reach more people! 🚀
-------------------------------------------------------------------------------------------------------------------
Disclosure: I am part of Trade Nation's Influencer program and receive a monthly fee for using their TradingView charts in my analysis.

USDCHF 30min | Fibonacci + Order Block Combo Reversal Setup💵 USDCHF 30-Min Smart Money Breakdown — May 14, 2025
This is a prime example of a multi-confluence reversal trade. Let’s walk through this sniper setup:
🔍 1. Market Structure & Context
Price has been flowing within a solid descending channel
We just witnessed a sharp impulse leg downward, now reacting from a key demand area
Channel bottom + OB + fib = confluence stacker heaven
🧱 2. Zone Confluence
Price taps into a high-probability Order Block (highlighted purple)
Lining up with the 61.8% fib retracement, one of the most powerful golden pockets
Immediate reaction seen with bullish wick rejection — evidence of smart money stepping in
📈 3. Entry Logic
Entry: Around 0.83350
SL: Below 0.83200 (protected under 70.5%)
TP: Near 0.84700
RRR ≈ 1:5+ — perfect for prop firm funded traders or swing-style scalpers
🔁 Management & Outlook
Key confirmation = break above midline channel
Scale out at 0.83700 (50% fib), then trail SL for runners
If price rolls back under 0.83200, it may seek the 79% or deeper liquidity zone
💡This type of setup is what separates reactive traders from anticipatory Smart Money traders. You’re not chasing—you're waiting in the kill zone.
💬 Comment “🔥” if you’d take this setup.
🔁 Repost if you love OB + Fib sniper logic.
📲 Follow @ChartNinjas88 for next-level breakdowns.

USD/CHF H4 | Falling toward a pullback supportUSD/CHF is falling towards a pullback support and could potentially bounce off this level to climb higher.
Buy entry is at 0.8315 which is a pullback support that aligns with the 38.2% Fibonacci retracement.
Stop loss is at 0.8175 which is a level that lies underneath a multi-swing-low support and the 61.8% Fibonacci retracement.
Take profit is at 0.8467 which is a swing-high resistance.
High Risk Investment Warning
Trading Forex/CFDs on margin carries a high level of risk and may not be suitable for all investors. Leverage can work against you.
Stratos Markets Limited (tradu.com):
CFDs are complex instruments and come with a high risk of losing money rapidly due to leverage. 63% of retail investor accounts lose money when trading CFDs with this provider. You should consider whether you understand how CFDs work and whether you can afford to take the high risk of losing your money.
Stratos Europe Ltd (tradu.com):
CFDs are complex instruments and come with a high risk of losing money rapidly due to leverage. 63% of retail investor accounts lose money when trading CFDs with this provider. You should consider whether you understand how CFDs work and whether you can afford to take the high risk of losing your money.
Stratos Global LLC (tradu.com):
Losses can exceed deposits.
Please be advised that the information presented on TradingView is provided to Tradu (‘Company’, ‘we’) by a third-party provider (‘TFA Global Pte Ltd’). Please be reminded that you are solely responsible for the trading decisions on your account. There is a very high degree of risk involved in trading. Any information and/or content is intended entirely for research, educational and informational purposes only and does not constitute investment or consultation advice or investment strategy. The information is not tailored to the investment needs of any specific person and therefore does not involve a consideration of any of the investment objectives, financial situation or needs of any viewer that may receive it. Kindly also note that past performance is not a reliable indicator of future results. Actual results may differ materially from those anticipated in forward-looking or past performance statements. We assume no liability as to the accuracy or completeness of any of the information and/or content provided herein and the Company cannot be held responsible for any omission, mistake nor for any loss or damage including without limitation to any loss of profit which may arise from reliance on any information supplied by TFA Global Pte Ltd.
The speaker(s) is neither an employee, agent nor representative of Tradu and is therefore acting independently. The opinions given are their own, constitute general market commentary, and do not constitute the opinion or advice of Tradu or any form of personal or investment advice. Tradu neither endorses nor guarantees offerings of third-party speakers, nor is Tradu responsible for the content, veracity or opinions of third-party speakers, presenters or participants.

USD/CHF BEARS WILL DOMINATE THE MARKET|SHORT
Hello, Friends!
It makes sense for us to go short on USD/CHF right now from the resistance line above with the target of 0.820 because of the confluence of the two strong factors which are the general downtrend on the previous 1W candle and the overbought situation on the lower TF determined by it’s proximity to the upper BB band.
Disclosure: I am part of Trade Nation's Influencer program and receive a monthly fee for using their TradingView charts in my analysis.
✅LIKE AND COMMENT MY IDEAS✅

Bullish continuation?The Swissie (USD/CHF) is falling towards the pivot, which acts as pullback support that aligns with the 50% Fibonacci retracement and could bounce to the 1st resistance.
Pivot: 0.8333
1st Support: 0.8260
1st Resistance: 0.8515
Risk Warning:
Trading Forex and CFDs carries a high level of risk to your capital and you should only trade with money you can afford to lose. Trading Forex and CFDs may not be suitable for all investors, so please ensure that you fully understand the risks involved and seek independent advice if necessary.
Disclaimer:
The above opinions given constitute general market commentary, and do not constitute the opinion or advice of IC Markets or any form of personal or investment advice.
Any opinions, news, research, analyses, prices, other information, or links to third-party sites contained on this website are provided on an "as-is" basis, are intended only to be informative, is not an advice nor a recommendation, nor research, or a record of our trading prices, or an offer of, or solicitation for a transaction in any financial instrument and thus should not be treated as such. The information provided does not involve any specific investment objectives, financial situation and needs of any specific person who may receive it. Please be aware, that past performance is not a reliable indicator of future performance and/or results. Past Performance or Forward-looking scenarios based upon the reasonable beliefs of the third-party provider are not a guarantee of future performance. Actual results may differ materially from those anticipated in forward-looking or past performance statements. IC Markets makes no representation or warranty and assumes no liability as to the accuracy or completeness of the information provided, nor any loss arising from any investment based on a recommendation, forecast or any information supplied by any third-party.

Falling towards 61.8% Fibonacci support?USD/CHF is falling towards the support level which his a pullback support that aligns with the 61.8% Fibonacci retracement and could bounce from this level to our take profit.
Entry: 0.8322
Why we like it:
There is a pullback support level that lines up with the 61.8% Fibonacci retracement.
Stop loss: 0.8197
Why we like it:
There is a pullback support level.
Take profit: 0.8510
Why we like it:
There is a pullback resistance that is slightly below the 61.8% Fibonacci retracement.
Enjoying your TradingView experience? Review us!
lease be advised that the information presented on TradingView is provided to Vantage (‘Vantage Global Limited’, ‘we’) by a third-party provider (‘Everest Fortune Group’). Please be reminded that you are solely responsible for the trading decisions on your account. There is a very high degree of risk involved in trading. Any information and/or content is intended entirely for research, educational and informational purposes only and does not constitute investment or consultation advice or investment strategy. The information is not tailored to the investment needs of any specific person and therefore does not involve a consideration of any of the investment objectives, financial situation or needs of any viewer that may receive it. Kindly also note that past performance is not a reliable indicator of future results. Actual results may differ materially from those anticipated in forward-looking or past performance statements. We assume no liability as to the accuracy or completeness of any of the information and/or content provided herein and the Company cannot be held responsible for any omission, mistake nor for any loss or damage including without limitation to any loss of profit which may arise from reliance on any information supplied by Everest Fortune Group.

USDCHF A Fall Expected! SELL!
My dear followers,
I analysed this chart on USDCHF and concluded the following:
The market is trading on 0.8441 pivot level.
Bias - Bearish
Technical Indicators: Both Super Trend & Pivot HL indicate a highly probable Bearish continuation.
Target - 0.8299
Safe Stop Loss - 0.8525
About Used Indicators:
A super-trend indicator is plotted on either above or below the closing price to signal a buy or sell. The indicator changes color, based on whether or not you should be buying. If the super-trend indicator moves below the closing price, the indicator turns green, and it signals an entry point or points to buy.
Disclosure: I am part of Trade Nation's Influencer program and receive a monthly fee for using their TradingView charts in my analysis.
———————————
WISH YOU ALL LUCK

USDCHF: Correctional Movement Ahead?! 🇺🇸🇨🇭
USDCHF may continue a correctional movement after
a release of the today's US CPI data.
A technical price action confirmation that I spotted is a
valid Change of Character CHoCH on an hourly time frame.
We can expect a bearish continuation to 0.8358
❤️Please, support my work with like, thank you!❤️
I am part of Trade Nation's Influencer program and receive a monthly fee for using their TradingView charts in my analysis.

USDCHF 30M Smart Money Entry from Demand — Watch This Level🧠 USDCHF 30M | SMC Precision Entry
Let’s break down this sniper play on USDCHF that’s setting up right from a Smart Money demand zone.
🔻 1. Liquidity Sweep Into Demand
Price broke structure earlier, then pulled back into a clear demand block.
We saw liquidity grabbed beneath multiple swing lows before this sharp rejection.
This is classic Smart Money accumulation — they take out weak hands before pumping it up.
🧱 2. Order Block + FVG Alignment
Price is reacting off a refined OB zone (marked in red) with a Fair Value Gap right above.
That OB was the last down move before the push up, and price just tapped into it clean.
The overlap of these two areas adds confluence for bulls.
📈 3. Entry + TP Setup (RRR ≈ 3:1)
📍 Entry Zone: 0.84070 – 0.84200 (inside OB)
❌ Stop-Loss: Below OB, around 0.84000
✅ Take Profit: 0.84750 (clean imbalance above)
There’s a wide imbalance zone above, which price may be magnetized toward.
🔥 4. Why This Works
✅ Liquidity Grab
✅ OB + FVG Confluence
✅ Bullish Reaction Wicks
✅ Tight SL Below Structure
✅ Clean RRR
This setup is Smart Money 101 — let them sweep, you step in with precision 💯
💬 Drop “📍USDCHF OB Tap” if you saw this coming.
📊 Follow @ChartNinjas88 for SMC setups that work.

USDCHF Analysis: Break & Retest or Mean Reversion?Hello traders!
USDCHF is offering two trading scenarios on the daily timeframe.
The first scenario suggests the pair may react bearishly from the resistance zone, setting up a break-and-retest opportunity that could drive price lower toward the 0.80001 area.
The second scenario anticipates a bounce toward the 0.89100 region, where a mean reversion setup may come into play (if sellers step in and price action confirms bearish intent near that resistance).
Discretionary Trading: Where Experience Becomes the Edge
Discretionary trading is all about making decisions based on what you see, what you feel, and what you've learned through experience. Unlike systematic strategies that rely on fixed rules or algorithms, discretionary traders use their judgment to read the market in real time. It's a skill that can't be rushed, because it's built on screen time, pattern recognition, and the ability to stay calm under pressure.
There's no shortcut here. You need to see enough market conditions, wins, and losses to build that intuition—the kind that tells you when to pull the trigger or sit on your hands. Charts might look the same, but context changes everything, and that's something only experience can teach you.
At the end of the day, discretionary trading is an art, refined over time, sharpened through mistakes, and driven by instinct. It's not for everyone, but for those who've put in the work, it can be a powerful way to trade.

Bearish reversal?The Swissie (USD/CHF) is rising towards the pivot, which lines up with the 61.8% Fibonacci retracement and could drop to the 1st support, which is a pullback support.
Pivot: 0.8519
1st Support: 0.8334
1st Resistance: 0.8604
Risk Warning:
Trading Forex and CFDs carries a high level of risk to your capital and you should only trade with money you can afford to lose. Trading Forex and CFDs may not be suitable for all investors, so please ensure that you fully understand the risks involved and seek independent advice if necessary.
Disclaimer:
The above opinions given constitute general market commentary, and do not constitute the opinion or advice of IC Markets or any form of personal or investment advice.
Any opinions, news, research, analyses, prices, other information, or links to third-party sites contained on this website are provided on an "as-is" basis, are intended only to be informative, is not an advice nor a recommendation, nor research, or a record of our trading prices, or an offer of, or solicitation for a transaction in any financial instrument and thus should not be treated as such. The information provided does not involve any specific investment objectives, financial situation and needs of any specific person who may receive it. Please be aware, that past performance is not a reliable indicator of future performance and/or results. Past Performance or Forward-looking scenarios based upon the reasonable beliefs of the third-party provider are not a guarantee of future performance. Actual results may differ materially from those anticipated in forward-looking or past performance statements. IC Markets makes no representation or warranty and assumes no liability as to the accuracy or completeness of the information provided, nor any loss arising from any investment based on a recommendation, forecast or any information supplied by any third-party.

USDCHF H4 I Bullish Bounce Off Based on the H4 chart analysis, the price is falling toward our buy entry level at 0.8316, a pullback support.
Our take profit is set at 0.8509, a pullback resistance.
The stop loss is placed at 0.8184 , a swing low support.
High Risk Investment Warning
Trading Forex/CFDs on margin carries a high level of risk and may not be suitable for all investors. Leverage can work against you.
Stratos Markets Limited (tradu.com):
CFDs are complex instruments and come with a high risk of losing money rapidly due to leverage. 63% of retail investor accounts lose money when trading CFDs with this provider. You should consider whether you understand how CFDs work and whether you can afford to take the high risk of losing your money.
Stratos Europe Ltd (tradu.com):
CFDs are complex instruments and come with a high risk of losing money rapidly due to leverage. 63% of retail investor accounts lose money when trading CFDs with this provider. You should consider whether you understand how CFDs work and whether you can afford to take the high risk of losing your money.
Stratos Global LLC (tradu.com):
Losses can exceed deposits.
Please be advised that the information presented on TradingView is provided to Tradu (‘Company’, ‘we’) by a third-party provider (‘TFA Global Pte Ltd’). Please be reminded that you are solely responsible for the trading decisions on your account. There is a very high degree of risk involved in trading. Any information and/or content is intended entirely for research, educational and informational purposes only and does not constitute investment or consultation advice or investment strategy. The information is not tailored to the investment needs of any specific person and therefore does not involve a consideration of any of the investment objectives, financial situation or needs of any viewer that may receive it. Kindly also note that past performance is not a reliable indicator of future results. Actual results may differ materially from those anticipated in forward-looking or past performance statements. We assume no liability as to the accuracy or completeness of any of the information and/or content provided herein and the Company cannot be held responsible for any omission, mistake nor for any loss or damage including without limitation to any loss of profit which may arise from reliance on any information supplied by TFA Global Pte Ltd.
The speaker(s) is neither an employee, agent nor representative of Tradu and is therefore acting independently. The opinions given are their own, constitute general market commentary, and do not constitute the opinion or advice of Tradu or any form of personal or investment advice. Tradu neither endorses nor guarantees offerings of third-party speakers, nor is Tradu responsible for the content, veracity or opinions of third-party speakers, presenters or participants.

USD/CHF Reversal Setup (Read-Caption)🧠 Professional Technical Analysis – USD/CHF 💱
🗓️ Date: May 6, 2025
🕰️ Timeframe: Likely 4H or Daily
📊 Current Price: ~0.82218
🔍 Technical Indicators
🔵 EMA 20: 0.84190 (short-term trend)
🔴 EMA 50: 0.82524 (mid-term trend)
❗ Bearish crossover: EMA 20 is below EMA 50 → short-term bearish bias 🐻
📉 Support Zone Analysis 🛡️
🟥 Key Demand Zone (Support): 0.82084 – 0.81437
🔁 Price has bounced here before 🪃
🕯️ Candles with long lower wicks = buyers stepping in 🧍♂️💪
🟠 This is the “bounce zone” 📈
🧭 Trade Idea
✅ Long Entry: Around 0.82084–0.82200
🛑 Stop Loss: Below 0.81437 ❌
🎯 Take Profit: Around 0.83600 🟢
⚖️ Risk/Reward: Excellent (>2:1) if bounce holds 🚀
🔄 Price Action Outlook
📉 Downtrend approaching major support
🕯️ Looking for bullish candlestick confirmation (engulfing, hammer, etc.)
📈 Target area aligns with mean reversion to EMA 20
📌 Conclusion
👀 Watching for bullish reversal signs 🔄
🛒 Buy zone is clearly defined ✅
⛔ Setup is invalidated if price closes below 0.81437

Could the price reverse from here?USD/CHF is rising towards the resistance level, which is a pullback resistance that is slightly below the 61.8% Fibonacci retracement and could reverse from this level to our take profit.
Entry: 0.85076
Why we like it:
There is a pullback resistance level that is slightly below the 61.8% Fibonacci retracement.
Stop loss: 0.8619
Why we like it:
There is a pullback resistance level that lines up with the 71% Fibonacci retracement.
Take profit: 0.8366
Why we like it:
There is a pullback support.
Enjoying your TradingView experience? Review us!
Please be advised that the information presented on TradingView is provided to Vantage (‘Vantage Global Limited’, ‘we’) by a third-party provider (‘Everest Fortune Group’). Please be reminded that you are solely responsible for the trading decisions on your account. There is a very high degree of risk involved in trading. Any information and/or content is intended entirely for research, educational and informational purposes only and does not constitute investment or consultation advice or investment strategy. The information is not tailored to the investment needs of any specific person and therefore does not involve a consideration of any of the investment objectives, financial situation or needs of any viewer that may receive it. Kindly also note that past performance is not a reliable indicator of future results. Actual results may differ materially from those anticipated in forward-looking or past performance statements. We assume no liability as to the accuracy or completeness of any of the information and/or content provided herein and the Company cannot be held responsible for any omission, mistake nor for any loss or damage including without limitation to any loss of profit which may arise from reliance on any information supplied by Everest Fortune Group.

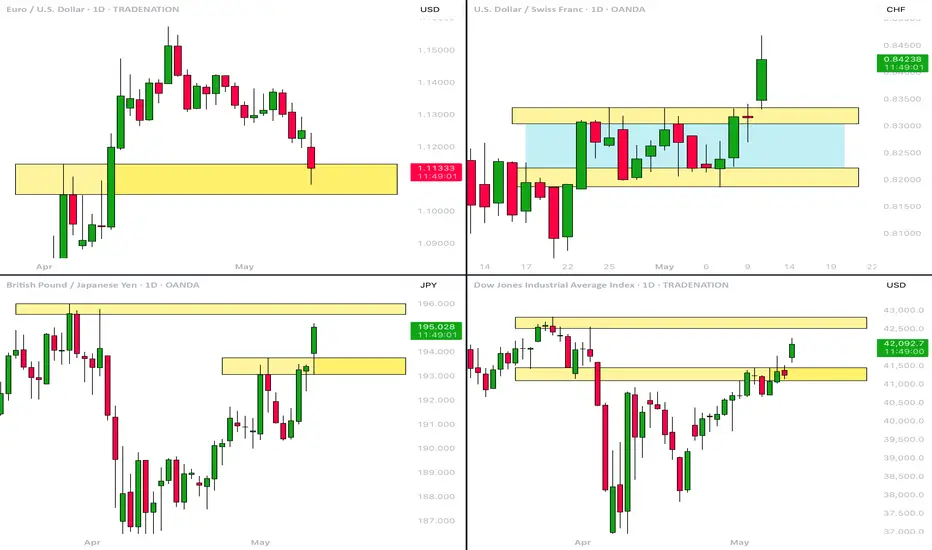
MarketBreakdown | EURUSD, USDCHF, GBPJPY, US30
Here are the updates & outlook for multiple instruments in my watch list.
1️⃣ #EURUSD daily time frame 🇪🇺🇺🇸
As I predicted, EURUSD dropped after the market opening.
The price is currently testing a significant daily demand zone.
Because the market looks relatively oversold after a selloff,
I think that there will be a high chance to see a pullback.
2️⃣ #USDCHF daily time frame 🇺🇸🇨🇭
The price completed a consolidation and a bullish accumulation
within a horizontal range on a daily.
Its resistance breakout is an important bullish signal.
Probabilities are high that the market will continue rising after a pullback.
3️⃣ #GBPJPY daily time frame 🇬🇧🇯🇵
The pair broke above a significant daily resistance cluster.
It opens a potential for more rise.
The market will most likely reach the underlined yellow resistance soon.
4️⃣ #US30 Index Dow Jones daily time frame 🇦🇺🇺🇸
The index successfully violated a major daily resistance.
Rise will continue and the market will reach the underlined
liquidity zone soon.
Do you agree with my market breakdown?
❤️Please, support my work with like, thank you!❤️
I am part of Trade Nation's Influencer program and receive a monthly fee for using their TradingView charts in my analysis.
USDCHF LONG FORECAST Q2 W20 D12 Y25USDCHF LONG FORECAST Q2 W20 D12 Y25
Professional Risk Managers👋
Welcome back to another FRGNT chart update📈
Diving into some Forex setups using predominantly higher time frame order blocks alongside confirmation breaks of structure.
Let’s see what price action is telling us today!
💡Here are some trade confluences📝
✅Weekly order block rejection
✅Daily order block rejection
✅15’ order block
✅Intraday bullish breaks of structure
🔑 Remember, to participate in trading comes always with a degree of risk, therefore as professional risk managers it remains vital that we stick to our risk management plan as well as our trading strategies.
📈The rest, we leave to the balance of probabilities.
💡Fail to plan. Plan to fail.
🏆It has always been that simple.
❤️Good luck with your trading journey, I shall see you at the very top.
🎯Trade consistent, FRGNT X

Bearish reversal?The Swissie (USD/CHF) is rising towards the pivot and could reverse to the 1st support, which is a pullback support.
Pivot: 0.8391
1st Support: 0.8195
1st Resistance: 0.8598
Risk Warning:
Trading Forex and CFDs carries a high level of risk to your capital and you should only trade with money you can afford to lose. Trading Forex and CFDs may not be suitable for all investors, so please ensure that you fully understand the risks involved and seek independent advice if necessary.
Disclaimer:
The above opinions given constitute general market commentary, and do not constitute the opinion or advice of IC Markets or any form of personal or investment advice.
Any opinions, news, research, analyses, prices, other information, or links to third-party sites contained on this website are provided on an "as-is" basis, are intended only to be informative, is not an advice nor a recommendation, nor research, or a record of our trading prices, or an offer of, or solicitation for a transaction in any financial instrument and thus should not be treated as such. The information provided does not involve any specific investment objectives, financial situation and needs of any specific person who may receive it. Please be aware, that past performance is not a reliable indicator of future performance and/or results. Past Performance or Forward-looking scenarios based upon the reasonable beliefs of the third-party provider are not a guarantee of future performance. Actual results may differ materially from those anticipated in forward-looking or past performance statements. IC Markets makes no representation or warranty and assumes no liability as to the accuracy or completeness of the information provided, nor any loss arising from any investment based on a recommendation, forecast or any information supplied by any third-party.

Bullish rise?USD/CHF has bounced off the support level which is a pullback support that lines up with the 38.2% Fibonacci retracement and could rise from this level to our take profit.
Entry: 0.8278
Why we like it:
There is a pullback support level that lines up with the 38.2% Fibonacci retracement.
Stop loss: 0.8244
Why we like it:
There is a pullback support that aligns with the 61.8% Fibonacci retracement.
Take profit: 0.8366
Why we like it:
There is a pullback resistance that lines up with the 61.8% Fibonacci projection.
Enjoying your TradingView experience? Review us!
Please be advised that the information presented on TradingView is provided to Vantage (‘Vantage Global Limited’, ‘we’) by a third-party provider (‘Everest Fortune Group’). Please be reminded that you are solely responsible for the trading decisions on your account. There is a very high degree of risk involved in trading. Any information and/or content is intended entirely for research, educational and informational purposes only and does not constitute investment or consultation advice or investment strategy. The information is not tailored to the investment needs of any specific person and therefore does not involve a consideration of any of the investment objectives, financial situation or needs of any viewer that may receive it. Kindly also note that past performance is not a reliable indicator of future results. Actual results may differ materially from those anticipated in forward-looking or past performance statements. We assume no liability as to the accuracy or completeness of any of the information and/or content provided herein and the Company cannot be held responsible for any omission, mistake nor for any loss or damage including without limitation to any loss of profit which may arise from reliance on any information supplied by Everest Fortune Group.

USDCHF RANGEPrice is overall bearish. Price has been in a range for a few weeks so one could either look for trades near support/resistance or wait for price to break support/resistance.

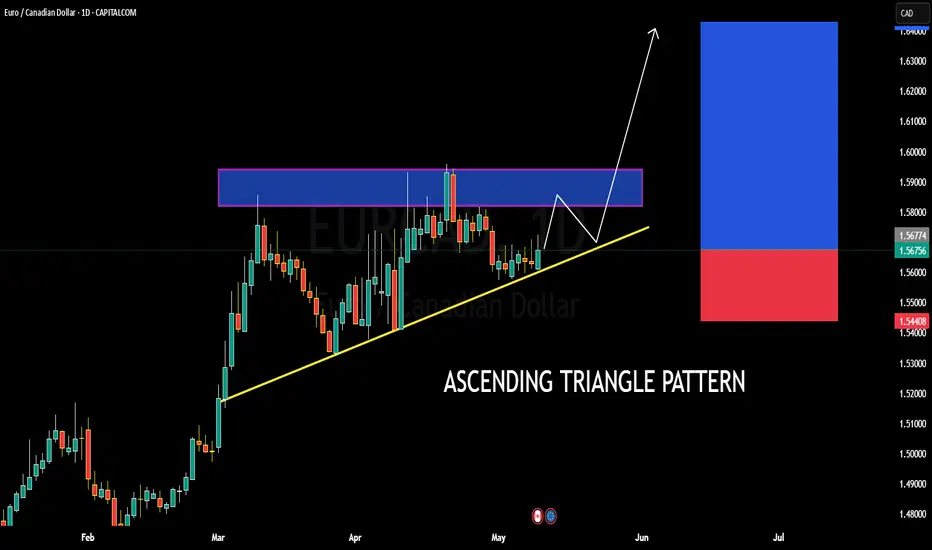
EURCAD BULLISH OR BEARISH DETAILED ANALYSISEURCAD is currently trading around 1.5600 and is consolidating within a textbook ascending triangle pattern on the daily timeframe. This setup signals a strong bullish bias as the pair continues to form higher lows, tightening under a key horizontal resistance zone between 1.5730 and 1.5770. Price is respecting the ascending trendline very well, indicating buyer strength. A breakout above this resistance zone could open the doors for a clean rally toward the 1.6400 psychological level, offering a strong risk-to-reward opportunity.
From a fundamental standpoint, the euro is gaining traction as recent Eurozone economic indicators suggest improving sentiment and a potential shift in ECB tone toward neutral. Meanwhile, the Canadian dollar remains pressured by falling crude oil prices and softening domestic data, including disappointing employment numbers this week. This divergence in fundamentals aligns well with the bullish technical structure for EURCAD, creating a high-probability scenario for buyers.
Looking ahead, a confirmed breakout above 1.5770 with volume could trigger a strong bullish impulse. The measured move from the triangle’s base supports a projection toward the 1.6400 area, making this setup attractive for swing traders aiming to ride the next leg higher. Risk should remain controlled below 1.5440, where the ascending structure would be invalidated.
I’m closely monitoring the price action near the breakout zone. Patience is key, but once we see bullish momentum pushing through the resistance, this trade setup has the potential to deliver a solid upside run. EURCAD remains one of my top bullish forex plays going into mid-May.
USDCHF Confirmed bottom Buy SignalLast time we looked at the USDCHF pair was three months ago (February 05 2025, see chart below) and it gave us the best sell signal possible, easily hitting our 0.8400 Target:
This time the long-term price action has transitioned into a Megaphone pattern, whose bottom was reached on the April 21 Low. At the same time the 1D RSI hit the 18.90 Support, which has been the Ultimate Buy Signal for the August 05 2024 and December 28 2023 Lows.
Since the price has been rebounding since, we view this as a confirmed buy signal and the start of the Megaphone's new Bullish Leg. The previous two rose by +10% and +10.67% respectively so a mere repeat of the +10% rally, will hit at least 0.88000.
-------------------------------------------------------------------------------
** Please LIKE 👍, FOLLOW ✅, SHARE 🙌 and COMMENT ✍ if you enjoy this idea! Also share your ideas and charts in the comments section below! This is best way to keep it relevant, support us, keep the content here free and allow the idea to reach as many people as possible. **
-------------------------------------------------------------------------------
Disclosure: I am part of Trade Nation's Influencer program and receive a monthly fee for using their TradingView charts in my analysis.
💸💸💸💸💸💸
👇 👇 👇 👇 👇 👇

USDCHF: Will Start Falling! Here is Why:
The price of USDCHF will most likely collapse soon enough, due to the supply beginning to exceed demand which we can see by looking at the chart of the pair.
Disclosure: I am part of Trade Nation's Influencer program and receive a monthly fee for using their TradingView charts in my analysis.
❤️ Please, support our work with like & comment! ❤️
