USDCHF OUTLOOK - SWING SETUPExpecting a bullish dollar in the next few months, which in turn will be bullish for USDCHF.
Note: ****I forgot to publish/share the trade setup after annotation.
"May fortune attend thee, and thy trade prosper." .......L2Earned
Usdchf!

USDCHF - Follow The Bulls!Hello TradingView Family / Fellow Traders. This is Richard, also known as theSignalyst.
📈USDCHF has been overall bullish trading within the rising channel marked in blue.
This week, USDCHF has been retesting the lower bound of the channel.
Moreover, the green zone is a strong demand.
🏹 Thus, the highlighted blue circle is a strong area to look for buy setups as it is the intersection of the lower blue trendline and green demand.
📚 As per my trading style:
As #USDCHF approaches the blue circle zone, I will be looking for trend-following bullish reversal setups (like a double bottom pattern, trendline break , and so on...)
📚 Always follow your trading plan regarding entry, risk management, and trade management.
Good luck!
All Strategies Are Good; If Managed Properly!
~Rich
Disclosure: I am part of Trade Nation's Influencer program and receive a monthly fee for using their TradingView charts in my analysis.

USDCHF testing support level at 0.7970The USD/CHF pair is currently trading with a bearish bias, aligned with the broader downward trend. Recent price action shows a retest of the falling resistance, suggesting a temporary relief rally within the downtrend.
Key resistance is located at 0.8130, a prior consolidation zone. This level will be critical in determining the next directional move.
A bearish rejection from 0.8130 could confirm the resumption of the downtrend, targeting the next support levels at 0.7970, followed by 0.7930 and 0.7900 over a longer timeframe.
Conversely, a decisive breakout and daily close above 0.8130 would invalidate the current bearish setup, shifting sentiment to bullish and potentially triggering a move towards 0.8160, then 0.8200.
Conclusion:
The short-term outlook remains bearish unless the pair breaks and holds above 0.8045. Traders should watch for price action signals around this key level to confirm direction. A rejection favours fresh downside continuation, while a breakout signals a potential trend reversal or deeper correction.
This communication is for informational purposes only and should not be viewed as any form of recommendation as to a particular course of action or as investment advice. It is not intended as an offer or solicitation for the purchase or sale of any financial instrument or as an official confirmation of any transaction. Opinions, estimates and assumptions expressed herein are made as of the date of this communication and are subject to change without notice. This communication has been prepared based upon information, including market prices, data and other information, believed to be reliable; however, Trade Nation does not warrant its completeness or accuracy. All market prices and market data contained in or attached to this communication are indicative and subject to change without notice.

USD/CHF SENDS CLEAR BEARISH SIGNALS|SHORT
Hello, Friends!
USD/CHF pair is trading in a local downtrend which know by looking at the previous 1W candle which is red. On the 1H timeframe the pair is going up. The pair is overbought because the price is close to the upper band of the BB indicator. So we are looking to sell the pair with the upper BB line acting as resistance. The next target is 0.804 area.
Disclosure: I am part of Trade Nation's Influencer program and receive a monthly fee for using their TradingView charts in my analysis.
✅LIKE AND COMMENT MY IDEAS✅

USDCHF Will Go Higher From Support! Long!
Take a look at our analysis for USDCHF.
Time Frame: 4h
Current Trend: Bullish
Sentiment: Oversold (based on 7-period RSI)
Forecast: Bullish
The price is testing a key support 0.806.
Current market trend & oversold RSI makes me think that buyers will push the price. I will anticipate a bullish movement at least to 0.811 level.
P.S
Overbought describes a period of time where there has been a significant and consistent upward move in price over a period of time without much pullback.
Disclosure: I am part of Trade Nation's Influencer program and receive a monthly fee for using their TradingView charts in my analysis.
Like and subscribe and comment my ideas if you enjoy them!

Could the price bounce from here?The Swissie (USD/CHF) is reacting to the pivot and could bounce to the 1st resistance.
Pivot: 0.8040
1st Support: 0.7879
1st Resistance: 0.8171
Risk Warning:
Trading Forex and CFDs carries a high level of risk to your capital and you should only trade with money you can afford to lose. Trading Forex and CFDs may not be suitable for all investors, so please ensure that you fully understand the risks involved and seek independent advice if necessary.
Disclaimer:
The above opinions given constitute general market commentary, and do not constitute the opinion or advice of IC Markets or any form of personal or investment advice.
Any opinions, news, research, analyses, prices, other information, or links to third-party sites contained on this website are provided on an "as-is" basis, are intended only to be informative, is not an advice nor a recommendation, nor research, or a record of our trading prices, or an offer of, or solicitation for a transaction in any financial instrument and thus should not be treated as such. The information provided does not involve any specific investment objectives, financial situation and needs of any specific person who may receive it. Please be aware, that past performance is not a reliable indicator of future performance and/or results. Past Performance or Forward-looking scenarios based upon the reasonable beliefs of the third-party provider are not a guarantee of future performance. Actual results may differ materially from those anticipated in forward-looking or past performance statements. IC Markets makes no representation or warranty and assumes no liability as to the accuracy or completeness of the information provided, nor any loss arising from any investment based on a recommendation, forecast or any information supplied by any third-party.

Falling towards major support?USD/CAD is falling toward he support level, which is an overlap support that aligns with the 78.6% Fibonacci projection and could bounce from this level to our take profit.
Entry: 0.8018
Why we like it:
There is an overlap support that lines up with the 78.6% Fibonacci projection.
Stop loss: 0.7972
Why we like it:
There is a pullback support that lines up with the 161.8% Fibonacci extension.
Take profit: 0.8111
Why we like it:
There is a pullback resistance.
Enjoying your TradingView experience? Review us!
Please be advised that the information presented on TradingView is provided to Vantage (‘Vantage Global Limited’, ‘we’) by a third-party provider (‘Everest Fortune Group’). Please be reminded that you are solely responsible for the trading decisions on your account. There is a very high degree of risk involved in trading. Any information and/or content is intended entirely for research, educational and informational purposes only and does not constitute investment or consultation advice or investment strategy. The information is not tailored to the investment needs of any specific person and therefore does not involve a consideration of any of the investment objectives, financial situation or needs of any viewer that may receive it. Kindly also note that past performance is not a reliable indicator of future results. Actual results may differ materially from those anticipated in forward-looking or past performance statements. We assume no liability as to the accuracy or completeness of any of the information and/or content provided herein and the Company cannot be held responsible for any omission, mistake nor for any loss or damage including without limitation to any loss of profit which may arise from reliance on any information supplied by Everest Fortune Group.

USDCHF bullish view
OANDA:USDCHF Before this one, analysis on UC is be man.cl, sharing again and still having bullish expectations.
Bullish push we are have, price is make short revers till zone (0.80250), currently price in zone, from which expecting new bullish push
SUP zone: 0.80400
RES zone: 0.81300, 0.81600

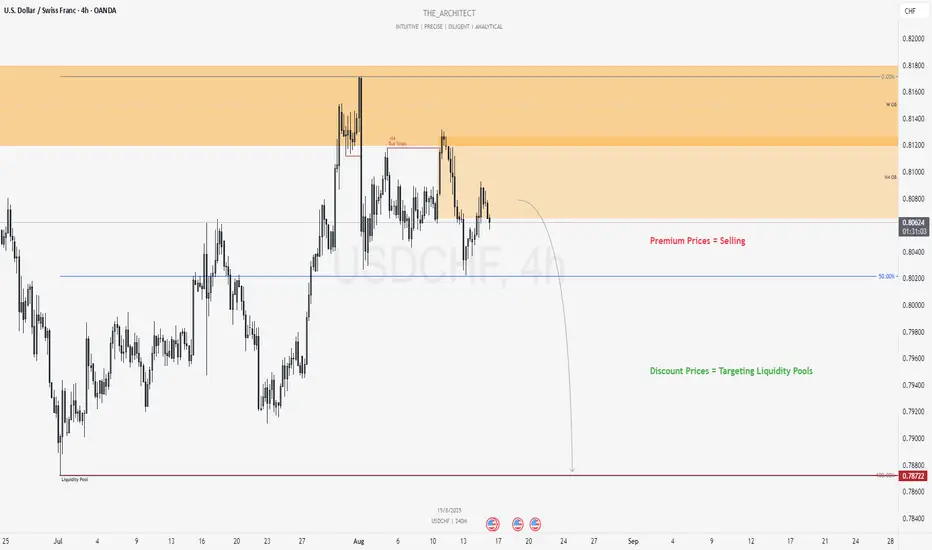
USDCHF: Bearish Continuation Setup From Weekly Supply ZoneGreetings Traders,
In today’s analysis of USDCHF, we observe that the prevailing institutional order flow remains firmly bearish. This directional bias positions us to focus on high-probability selling opportunities aligned with downside liquidity objectives.
Key Observations on H4:
Weekly Bearish Order Block Rejection: Price recently rejected a weekly bearish order block, initiating a decisive market structure shift to the downside. This rejection validates the weekly supply zone as a strong institutional resistance area.
Premium Price Context: Current price action is positioned within premium territory, offering an advantageous zone to seek short setups.
H4 Bearish Order Block Reaction: Price is presently reacting to an H4 bearish order block, strengthening the case for a sell-side continuation.
Trading Plan:
Entry Strategy: Seek confirmation-based entries on the lower timeframes (M15 and below) within the H4 order block to refine risk.
Target Objective: Aim for discount-side liquidity pools, in alignment with institutional objectives to rebalance price and capture liquidity resting below.
Remain disciplined, let the market confirm your bias, and execute with precision risk management.
Kind regards,
The Architect 🏛️📉
Bearish drop?The Swissie (USD/CHF) is rising towards the pivot which is a pullback resistance that lines up with the 61.8% Fibonacci retracement and could drop to the 1st support.
Pivot: 0.8088
1st Support: 0.8123
1st Resistance: 0.8159
Risk Warning:
Trading Forex and CFDs carries a high level of risk to your capital and you should only trade with money you can afford to lose. Trading Forex and CFDs may not be suitable for all investors, so please ensure that you fully understand the risks involved and seek independent advice if necessary.
Disclaimer:
The above opinions given constitute general market commentary, and do not constitute the opinion or advice of IC Markets or any form of personal or investment advice.
Any opinions, news, research, analyses, prices, other information, or links to third-party sites contained on this website are provided on an "as-is" basis, are intended only to be informative, is not an advice nor a recommendation, nor research, or a record of our trading prices, or an offer of, or solicitation for a transaction in any financial instrument and thus should not be treated as such. The information provided does not involve any specific investment objectives, financial situation and needs of any specific person who may receive it. Please be aware, that past performance is not a reliable indicator of future performance and/or results. Past Performance or Forward-looking scenarios based upon the reasonable beliefs of the third-party provider are not a guarantee of future performance. Actual results may differ materially from those anticipated in forward-looking or past performance statements. IC Markets makes no representation or warranty and assumes no liability as to the accuracy or completeness of the information provided, nor any loss arising from any investment based on a recommendation, forecast or any information supplied by any third-party.

USDCHF H4 | Bullish bounce offUSD/CHF has bounced off the buy entry which is an overlap support that aligns with the 78.6% Fibonacci projection and could rise to the take profit.
Buy entry is at 0.8019, which is an overlap support that lines up with the 78.6% Fibonacci projection.
Stop loss is at 0.7970, which is a pullback support that lines up with the 78.6% Fibonacci retracement.
Take profit is at 0.8122, which is a pullback resistance.
High Risk Investment Warning
Trading Forex/CFDs on margin carries a high level of risk and may not be suitable for all investors. Leverage can work against you.
Stratos Markets Limited (tradu.com ):
CFDs are complex instruments and come with a high risk of losing money rapidly due to leverage. 65% of retail investor accounts lose money when trading CFDs with this provider. You should consider whether you understand how CFDs work and whether you can afford to take the high risk of losing your money.
Stratos Europe Ltd (tradu.com ):
CFDs are complex instruments and come with a high risk of losing money rapidly due to leverage. 66% of retail investor accounts lose money when trading CFDs with this provider. You should consider whether you understand how CFDs work and whether you can afford to take the high risk of losing your money.
Stratos Global LLC (tradu.com ):
Losses can exceed deposits.
Please be advised that the information presented on TradingView is provided to Tradu (‘Company’, ‘we’) by a third-party provider (‘TFA Global Pte Ltd’). Please be reminded that you are solely responsible for the trading decisions on your account. There is a very high degree of risk involved in trading. Any information and/or content is intended entirely for research, educational and informational purposes only and does not constitute investment or consultation advice or investment strategy. The information is not tailored to the investment needs of any specific person and therefore does not involve a consideration of any of the investment objectives, financial situation or needs of any viewer that may receive it. Kindly also note that past performance is not a reliable indicator of future results. Actual results may differ materially from those anticipated in forward-looking or past performance statements. We assume no liability as to the accuracy or completeness of any of the information and/or content provided herein and the Company cannot be held responsible for any omission, mistake nor for any loss or damage including without limitation to any loss of profit which may arise from reliance on any information supplied by TFA Global Pte Ltd.
The speaker(s) is neither an employee, agent nor representative of Tradu and is therefore acting independently. The opinions given are their own, constitute general market commentary, and do not constitute the opinion or advice of Tradu or any form of personal or investment advice. Tradu neither endorses nor guarantees offerings of third-party speakers, nor is Tradu responsible for the content, veracity or opinions of third-party speakers, presenters or participants.

Beautifull Bullish Continuation USDCHFUSDCHF has been rallying to the upside recently leaving Demand Zone now we are waiting this pair to come back to this Zone to activate our buy limit order

USDCHF: Market of Buyers
Our strategy, polished by years of trial and error has helped us identify what seems to be a great trading opportunity and we are here to share it with you as the time is ripe for us to buy USDCHF.
Disclosure: I am part of Trade Nation's Influencer program and receive a monthly fee for using their TradingView charts in my analysis.
❤️ Please, support our work with like & comment! ❤️

USDCHF: The Necessary Return to the Manipulation ZoneIn the market, some zones act like magnets, pulling the price back to them. After a powerful move down, USDCHF has left behind a critical manipulation zone—a place where large capital needs to return to close their books before the real trend continues. This analysis is about waiting patiently at that exact spot.
The USDCHF pair continues to be in a global downtrend . After another powerful impulse down on the higher timeframe, the instrument corrected to the 78.6% Fibonacci level of the daily structure. This level, in conjunction with a daily order block, acted as strong resistance and pushed the price down, breaking the 4H corrective structure (BOS).
The interaction with the 78.6% level was accompanied by a manipulation in the form of a new daily order block , with a 4H order block residing inside it. If large capital intends to continue the downtrend, they will first need to close the losing long positions used to conduct the Buy-to-Sell (BTS) manipulation . This makes it a strong Point of Interest (POI) and a magnet for the price.
An additional argument for a short setup forming in this POI is that an untouched daily FVG remains slightly below. The mitigation of this FVG will be the minimum target if a setup is confirmed according to one of the two scenarios, provided the price reaches the POI before this rebalancing occurs.
Two Potential Short Scenarios
SCENARIO 1: Entry from the 61.8% Local Fib
This scenario involves the mitigation of the lower boundary of the daily order block in conjunction with reaching the 61.8% level of the local correction , and a reversal reaction from this confluence.
SCENARIO 2: Entry from the 78.6% Local Fib
If the 61.8% local level is broken, the second scenario comes into play, with the mitigation of the 4H order block in conjunction with the 78.6% level of the local correction , and a reversal reaction from there.
► Invalidation: A break of this level with the price finding acceptance above it would invalidate the short idea from this POI. In that case, the correction on the higher timeframe would continue higher, aiming to capture additional liquidity, at least from the June 19th high, which is also the daily structure's break level.
~~~~~~~~~~~~~~~~~~~~~~~~~~~~~~~~~~~~~~~~~~~~~~~~~~~~~~~~~~~~~~~~~
The principles and conditions for forming the manipulation zones I show in this trade idea are detailed in my educational publication, which was chosen by TradingView for the "Editor's Picks" category and received a huge amount of positive feedback from this insightful trading community. To better understand the logic I've used here and the general principles of price movement in most markets from the perspective of institutional capital, I highly recommend checking out this guide if you haven't already. 👇
P.S. This is not a prediction of the exact price direction. It is a description of high-probability setups that become valid only if specific conditions are met when the price reaches the marked POI. If the conditions are not met, the setups are invalid. No setup has a 100% success rate, so if you decide to use this trade idea, always apply a stop-loss and proper risk management. Trade smart.
~~~~~~~~~~~~~~~~~~~~~~~~~~~~~~~~~~~~~~~~~~~~~~~~~~~~~~~~~~~~~~~~~
If you found this analysis helpful, support it with a Boost! 🚀
Have a question or your own view on this idea? Share it in the comments. 💬
► Follow me on TradingView to get real-time updates on THIS idea (entry, targets & live trade management) and not to miss my next detailed breakdown.
~~~~~~~~~~~~~~~~~~~~~~~~~~~~~~~~~~~~~~~~~~~~~~~~~~~~~~~~~~~~~~~~~

Bearish reversal off pullback resistance?USD/CHF is risng towards the resistance level which is a pullback resistance that aligns with the 38.2% Fibonacci retracement and could drop from this level to our take profit.
Entry: 0.8089
Why we like it:
There is a pullback resistance that lines up with the 38.2% Fibonacci retracement.
Stop loss: 0.8128
Why we like it:
There is a swing high resistance.
Take profit: 0.8019
Why we like it:
There is an overlap support level that lines up with the 161.8% Fibonacci extension.
Enjoying your TradingView experience? Review us!
Please be advised that the information presented on TradingView is provided to Vantage (‘Vantage Global Limited’, ‘we’) by a third-party provider (‘Everest Fortune Group’). Please be reminded that you are solely responsible for the trading decisions on your account. There is a very high degree of risk involved in trading. Any information and/or content is intended entirely for research, educational and informational purposes only and does not constitute investment or consultation advice or investment strategy. The information is not tailored to the investment needs of any specific person and therefore does not involve a consideration of any of the investment objectives, financial situation or needs of any viewer that may receive it. Kindly also note that past performance is not a reliable indicator of future results. Actual results may differ materially from those anticipated in forward-looking or past performance statements. We assume no liability as to the accuracy or completeness of any of the information and/or content provided herein and the Company cannot be held responsible for any omission, mistake nor for any loss or damage including without limitation to any loss of profit which may arise from reliance on any information supplied by Everest Fortune Group.

USDCHF What Next? BUY!
My dear subscribers,
My technical analysis for USDCHF is below:
The price is coiling around a solid key level - 0.8075
Bias - Bullish
Technical Indicators: Pivot Points High anticipates a potential price reversal.
Super trend shows a clear buy, giving a perfect indicators' convergence.
Goal - 0.8093
My Stop Loss - 0.8064
About Used Indicators:
By the very nature of the supertrend indicator, it offers firm support and resistance levels for traders to enter and exit trades. Additionally, it also provides signals for setting stop losses
Disclosure: I am part of Trade Nation's Influencer program and receive a monthly fee for using their TradingView charts in my analysis.
———————————
WISH YOU ALL LUCK

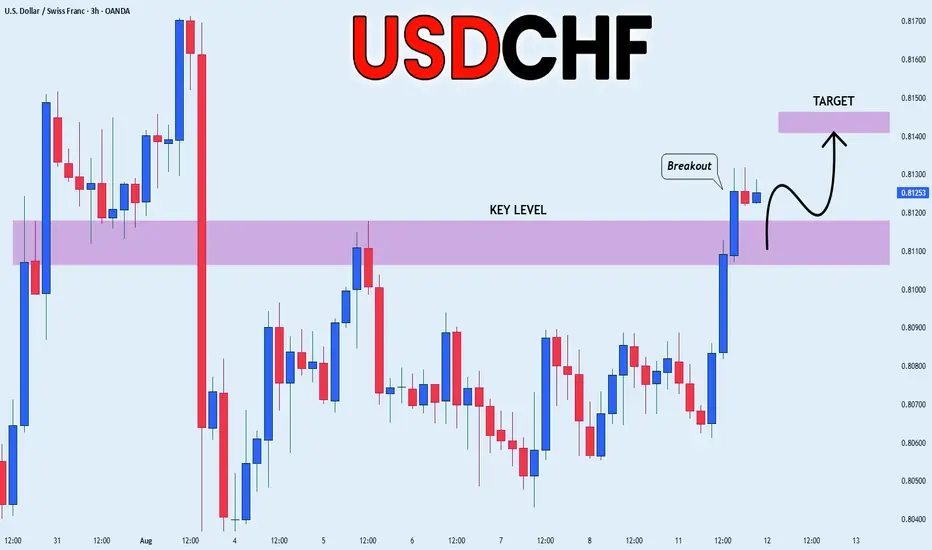
USD_CHF BULLISH BREAKOUT|LONG|
✅USD_CHF is going up
Now and the pair made a bullish
Breakout of the key horizontal
Level of 0.8118 and the breakout
Is confirmed so we are bullish
Biased and we will be expecting
A further bullish move up
LONG🚀
✅Like and subscribe to never miss a new idea!✅
USDCHF will be in the Bullish directionHello Traders
In This Chart USDCHF HOURLY Forex Forecast By FOREX PLANET
today USDCHF analysis 👆
🟢This Chart includes_ (USDCHF market update)
🟢What is The Next Opportunity on USDCHF Market
🟢how to Enter to the Valid Entry With Assurance Profit
This CHART is For Trader's that Want to Improve Their Technical Analysis Skills and Their Trading By Understanding How To Analyze The Market Using Multiple Timeframes and Understanding The Bigger Picture on the Chart

USDCHF Short term bullish?As dxy looks like it wants to run higher, USDCHF will likely also go higher for a short-term buying for a retracement to then continue its down trend. this pair looks good.

USDCHF: Bearish Continuation
It is essential that we apply multitimeframe technical analysis and there is no better example of why that is the case than the current USDCHF chart which, if analyzed properly, clearly points in the downward direction.
Disclosure: I am part of Trade Nation's Influencer program and receive a monthly fee for using their TradingView charts in my analysis.
❤️ Please, support our work with like & comment! ❤️

USDCHF Bullish Continuation ?Preparing to shoot up again. Keep your support and resistance in eyes and do entries on breakout. Can touch 0.81715 again.
Disclaimer:
The content presented in this IMAGE is intended solely for educational and informational purposes. It does not constitute financial, investment, or trading advice.
Trading foreign exchange (Forex) on margin involves a high level of risk and may not be suitable for all investors. The use of leverage can work both for and against you. Before deciding to participate in the Forex market, you should carefully consider your investment objectives, level of experience, and risk tolerance.
There is a possibility that you may incur a loss of some or all of your initial investment, and therefore, you should not invest money that you cannot afford to lose. Be fully aware of all the risks associated with foreign exchange trading, and seek advice from a licensed and independent financial advisor if you have any doubts.
Past performance is not indicative of future results. Always trade responsibly.

USDCHF resistance at 0.8130The USD/CHF pair is currently trading with a bearish bias, aligned with the broader downward trend. Recent price action shows a retest of the falling resistance, suggesting a temporary relief rally within the downtrend.
Key resistance is located at 0.8130, a prior consolidation zone. This level will be critical in determining the next directional move.
A bearish rejection from 0.8130 could confirm the resumption of the downtrend, targeting the next support levels at 0.7970, followed by 0.7930 and 0.7900 over a longer timeframe.
Conversely, a decisive breakout and daily close above 0.8130 would invalidate the current bearish setup, shifting sentiment to bullish and potentially triggering a move towards 0.8160, then 0.8200.
Conclusion:
The short-term outlook remains bearish unless the pair breaks and holds above 0.8045. Traders should watch for price action signals around this key level to confirm direction. A rejection favours fresh downside continuation, while a breakout signals a potential trend reversal or deeper correction.
This communication is for informational purposes only and should not be viewed as any form of recommendation as to a particular course of action or as investment advice. It is not intended as an offer or solicitation for the purchase or sale of any financial instrument or as an official confirmation of any transaction. Opinions, estimates and assumptions expressed herein are made as of the date of this communication and are subject to change without notice. This communication has been prepared based upon information, including market prices, data and other information, believed to be reliable; however, Trade Nation does not warrant its completeness or accuracy. All market prices and market data contained in or attached to this communication are indicative and subject to change without notice.

Bullish bounce off pullback support?The Swissie (USD/CHF) is falling towards the pivot which is a pullback support that aligns with the 50% Fibonacci retracement and could bounce to the 1st resistance.
Pivot: 0.8040
1st Support: 0.7893
1st Resistance: 8169
Risk Warning:
Trading Forex and CFDs carries a high level of risk to your capital and you should only trade with money you can afford to lose. Trading Forex and CFDs may not be suitable for all investors, so please ensure that you fully understand the risks involved and seek independent advice if necessary.
Disclaimer:
The above opinions given constitute general market commentary, and do not constitute the opinion or advice of IC Markets or any form of personal or investment advice.
Any opinions, news, research, analyses, prices, other information, or links to third-party sites contained on this website are provided on an "as-is" basis, are intended only to be informative, is not an advice nor a recommendation, nor research, or a record of our trading prices, or an offer of, or solicitation for a transaction in any financial instrument and thus should not be treated as such. The information provided does not involve any specific investment objectives, financial situation and needs of any specific person who may receive it. Please be aware, that past performance is not a reliable indicator of future performance and/or results. Past Performance or Forward-looking scenarios based upon the reasonable beliefs of the third-party provider are not a guarantee of future performance. Actual results may differ materially from those anticipated in forward-looking or past performance statements. IC Markets makes no representation or warranty and assumes no liability as to the accuracy or completeness of the information provided, nor any loss arising from any investment based on a recommendation, forecast or any information supplied by any third-party.
