USDCHF BULLISH BOUNCE SUPPORT.?USDCHF market moved to bounce back towards aggressive buying this pattern support the market momentum bullish with some specific Targets.
1st Target 🎯 0.86750
Final Target 🎯 0.88500
Conclusion:
The momentum shows if the market moves according to my analysis and reached at my final target then keep holding your trades and make money millionaire.
Usdchfanalysis

USDCHF Short Term Buy Trade Update!!!Hi Traders, on April 24th I shared this idea "USDCHF - Expecting Bullish Continuation In The Short Term"
I expected further continuation higher from the marked Fibonacci support zones. You can read the full post using the link above.
Price reached the first Fibonacci support zone, respected it and bounced higher as expected!!!
If you enjoy this idea, don’t forget to LIKE 👍, FOLLOW ✅, SHARE 🙌, and COMMENT ✍! Drop your thoughts and charts below to keep the discussion going. Your support helps keep this content free and reach more people! 🚀
-------------------------------------------------------------------------------------------------------------------
Disclosure: I am part of Trade Nation's Influencer program and receive a monthly fee for using their TradingView charts in my analysis.

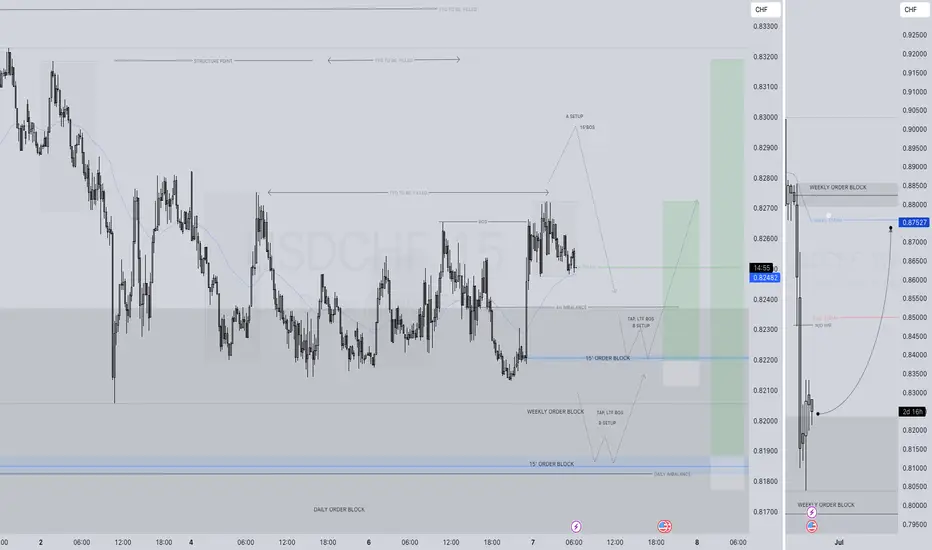
USDCHF LONG FORECAST Q2 W20 D12 Y25USDCHF LONG FORECAST Q2 W20 D12 Y25
Professional Risk Managers👋
Welcome back to another FRGNT chart update📈
Diving into some Forex setups using predominantly higher time frame order blocks alongside confirmation breaks of structure.
Let’s see what price action is telling us today!
💡Here are some trade confluences📝
✅Weekly order block rejection
✅Daily order block rejection
✅15’ order block
✅Intraday bullish breaks of structure
🔑 Remember, to participate in trading comes always with a degree of risk, therefore as professional risk managers it remains vital that we stick to our risk management plan as well as our trading strategies.
📈The rest, we leave to the balance of probabilities.
💡Fail to plan. Plan to fail.
🏆It has always been that simple.
❤️Good luck with your trading journey, I shall see you at the very top.
🎯Trade consistent, FRGNT X

Market Analysis: USD/CHF Regains StrengthMarket Analysis: USD/CHF Regains Strength
USD/CHF is rising and might aim for a move toward the 0.8400 resistance.
Important Takeaways for USD/CHF Analysis Today
- USD/CHF is showing positive signs above the 0.8265 resistance zone.
- There is a connecting bullish trend line forming with support at 0.8300 on the hourly chart at FXOpen.
USD/CHF Technical Analysis
On the hourly chart of USD/CHF at FXOpen, the pair started a decent increase from the 0.8200 support. The US Dollar climbed above the 0.8245 resistance zone against the Swiss Franc.
The bulls were able to pump the pair above the 50-hour simple moving average and 0.8300. A high was formed at 0.8340 and the pair is now consolidating gains above the 23.6% Fib retracement level of the upward move from the 0.8185 swing low to the 0.8340 high.
There is also a connecting bullish trend line forming with support at 0.8300. On the upside, the pair is now facing resistance near 0.8340. The main resistance is now near 0.8350.
If there is a clear break above the 0.8350 resistance zone and the RSI remains above 50, the pair could start another increase. In the stated case, it could test 0.8400. If there is a downside correction, the pair might test the 0.8300 level.
The first major support on the USD/CHF chart is near the 0.8265 level and the 50% Fib retracement level of the upward move from the 0.8185 swing low to the 0.8340 high.
The next key support is near the 0.8245 level. A downside break below 0.8245 might spark bearish moves. Any more losses may possibly open the doors for a move toward the 0.8200 level in the near term.
This article represents the opinion of the Companies operating under the FXOpen brand only. It is not to be construed as an offer, solicitation, or recommendation with respect to products and services provided by the Companies operating under the FXOpen brand, nor is it to be considered financial advice.

USDCHF LONG FORECAST Q2 W19 D9 Y25USDCHF LONG FORECAST Q2 W19 D9 Y25
Professional Risk Managers👋
Welcome back to another FRGNT chart update📈
Diving into some Forex setups using predominantly higher time frame order blocks alongside confirmation breaks of structure.
Let’s see what price action is telling us today!
💡Here are some trade confluences📝
✅Weekly order block rejection
✅Daily order block rejection
✅15’ order block
✅Intraday bullish breaks of structure
🔑 Remember, to participate in trading comes always with a degree of risk, therefore as professional risk managers it remains vital that we stick to our risk management plan as well as our trading strategies.
📈The rest, we leave to the balance of probabilities.
💡Fail to plan. Plan to fail.
🏆It has always been that simple.
❤️Good luck with your trading journey, I shall see you at the very top.
🎯Trade consistent, FRGNT X

USDCHF LONG FORECAST Q2 W19 D8 Y25USDCHF LONG FORECAST Q2 W19 D8 Y25
Professional Risk Managers👋
Welcome back to another FRGNT chart update📈
Diving into some Forex setups using predominantly higher time frame order blocks alongside confirmation breaks of structure.
Let’s see what price action is telling us today!
💡Here are some trade confluences📝
✅Weekly order block rejection
✅Daily order block rejection
✅15’ order block
✅Intraday bullish breaks of structure
🔑 Remember, to participate in trading comes always with a degree of risk, therefore as professional risk managers it remains vital that we stick to our risk management plan as well as our trading strategies.
📈The rest, we leave to the balance of probabilities.
💡Fail to plan. Plan to fail.
🏆It has always been that simple.
❤️Good luck with your trading journey, I shall see you at the very top.
🎯Trade consistent, FRGNT X

USDCHF LONG FORECAST Q2 W19 D7 Y25USDCHF LONG FORECAST Q2 W19 D7 Y25
Professional Risk Managers👋
Welcome back to another FRGNT chart update📈
Diving into some Forex setups using predominantly higher time frame order blocks alongside confirmation breaks of structure.
Let’s see what price action is telling us today!
💡Here are some trade confluences📝
✅Weekly order block rejection
✅Daily order block rejection
✅15’ order block
✅Intraday bullish breaks of structure
🔑 Remember, to participate in trading comes always with a degree of risk, therefore as professional risk managers it remains vital that we stick to our risk management plan as well as our trading strategies.
📈The rest, we leave to the balance of probabilities.
💡Fail to plan. Plan to fail.
🏆It has always been that simple.
❤️Good luck with your trading journey, I shall see you at the very top.
🎯Trade consistent, FRGNT X
USDCHF SUPPLY ZONE (DOWNTREND)PATTERN. Key Technical Levels:
Support: The pair has found support near 0.8220, which has helped stabilize its recent movements .
Resistance: Immediate resistance is observed at 0.8333, with a more significant resistance zone between 0.8482 and 0.8550, aligning with the 38.2% Fibonacci retracement level from the 0.9200 to 0.8038 decline .
Trading Strategy:
Bullish Scenario: A sustained move above 0.8333 could open the path toward the 0.8482–0.8550 resistance zone.
Bearish Scenario: Failure to hold above 0.8220 may lead to a retest of the recent low at 0.8038, potentially resuming the broader downtrend.
Traders should remain vigilant for the Federal Reserve's announcement, as it may introduce volatility and influence the USD/CHF's direction.

USDCHF - EVERYONE Lets make million tonightTeam,
please do very small first
i think we may get a chance buy the second dipped
so take it easy.. the DOW may fall hard later tonight
WHY? Because RATE announcement will create high volatility
which will bring the USDCHF deeper into our double up entry.
We will send out US30 AND NAS later tonight.
Lets kill the market together

USDCHF - another opportunityTeam, this week, we done many trades with USDCHF and very successfully,
Tomorrow RATE announce and NO change.
that mean the USD will like moving strong against most currencies,
We found opportunity to RE-ENTER the USDCHF again
Target base on the chart.
TARGET 1 - reduce 30% volume
TARGET 2 - reduce another 50%
Target 3 - close the remaining
Please follow it accordingly. Do NOT forget to bring trail stop loss to BE once target 1 meet.

USDCHF LONG FORECAST Q2 W19 D6 Y25USDCHF LONG FORECAST Q2 W19 D6 Y25
Professional Risk Managers👋
Welcome back to another FRGNT chart update📈
Diving into some Forex setups using predominantly higher time frame order blocks alongside confirmation breaks of structure.
Let’s see what price action is telling us today!
💡Here are some trade confluences📝
✅Weekly order block rejection
✅Daily order block rejection
✅15’ order block
✅Intraday bullish breaks of structure
🔑 Remember, to participate in trading comes always with a degree of risk, therefore as professional risk managers it remains vital that we stick to our risk management plan as well as our trading strategies.
📈The rest, we leave to the balance of probabilities.
💡Fail to plan. Plan to fail.
🏆It has always been that simple.
❤️Good luck with your trading journey, I shall see you at the very top.
🎯Trade consistent, FRGNT X

USD/CHF at Resistance Wall: Short Setup Poised for Drop!Timeframe: 15-Minute (M15)
Fast-paced short-term trade.
Supply Zone (Entry Area):
Price is rejecting from 0.82720 – 0.82840 resistance zone.
Bearish Signal:
Multiple rejections at red zone suggest sellers are active.
Stop Loss:
Placed slightly above resistance at 0.82846.
Target Zone:
Demand area near 0.82100 – 0.82120, marked as the take-profit zone.
Trend Confirmation:
Lower highs and resistance hold confirm bearish bias.
Risk-Reward Ratio:
Wide green zone vs tight stop — high reward-to-risk trade.

USD/CHF: Bearish ForecastPrice is likely to retrace into the 0.83593 – 0.85750 demand zone or push higher into the FVG (0.8700 – 0.8800) before facing rejection. As long as price holds below these zones, the downtrend should continue, targeting new lows below 0.8100.
Bearish momentum remains intact unless price breaks above the FVG.

USDCHF STRONG BULLIDH (UPTREND) SCENARIOTrade Setup: BUY
Entry Zone (Buy Price Range):
Between 0.81500 – 0.82500 (ideal pullback or breakout entry range depending on current price action)
Stop Loss (Risk Management):
0.80500
Below recent swing low and key support zone
Take Profit Targets:
Target 1: 0.83700 (near-term resistance or Fibonacci level)
Final Target: 0.85800 (major resistance / long-term objective)
Trade Management Plan:
1. After Entry:
Monitor price action at 0.83000–0.83700.
Consider partial profits at Target 1 and move stop to break even.
2. If Target 1 Hits:
Lock profits and trail stop loss below higher lows for continuation to 0.85800.
3. Exit Plan:
Exit completely if price breaks below 0.80500 with strong bearish momentum.

USDCHF LONG FORECAST Q2 W18 D1 Y25USDCHF LONG FORECAST Q2 W18 D1 Y25
Professional Risk Managers👋
Welcome back to another FRGNT chart update📈
Diving into some Forex setups using predominantly higher time frame order blocks alongside confirmation breaks of structure.
Let’s see what price action is telling us today!
💡Here are some trade confluences📝
✅Weekly order block rejection
✅Daily order block rejection
✅15’ order block
✅Intraday bullish breaks of structure
🔑 Remember, to participate in trading comes always with a degree of risk, therefore as professional risk managers it remains vital that we stick to our risk management plan as well as our trading strategies.
📈The rest, we leave to the balance of probabilities.
💡Fail to plan. Plan to fail.
🏆It has always been that simple.
❤️Good luck with your trading journey, I shall see you at the very top.
🎯Trade consistent, FRGNT X

USDCHF: More Bearish Order FlowSimilar to USDJPY , USDCHF has exhibited a change of character, initiating a bearish order flow for the week. Price has reached a key point of interest where a potential continuation to the downside could occur. The DXY is reflecting similar behaviour, supporting the bearish outlook.
An entry position has been established, and now it is a matter of monitoring the trade and allowing the market to develop accordingly.

USDCHF Short Term Buy Trading Plan Update!!!Hi Traders, on April 24th I shared this idea "USDCHF - Expecting Bullish Continuation In The Short Term"
I expected further continuation higher from the marked Fibonacci support zones. You can read the full post using the link above.
Price reached the first Fibonacci support zone, respected it and bounced higher as expected!!!
If you enjoy this idea, don’t forget to LIKE 👍, FOLLOW ✅, SHARE 🙌, and COMMENT ✍! Drop your thoughts and charts below to keep the discussion going. Your support helps keep this content free and reach more people! 🚀
-------------------------------------------------------------------------------------------------------------------
Disclosure: I am part of Trade Nation's Influencer program and receive a monthly fee for using their TradingView charts in my analysis.

USDCHF LONG FORECAST Q2 W18 D30 Y25USDCHF LONG FORECAST Q2 W18 D30 Y25
Professional Risk Managers👋
Welcome back to another FRGNT chart update📈
Diving into some Forex setups using predominantly higher time frame order blocks alongside confirmation breaks of structure.
Let’s see what price action is telling us today!
💡Here are some trade confluences📝
✅Weekly order block rejection
✅Daily order block rejection
✅15’ order block
✅Intraday bullish breaks of structure
🔑 Remember, to participate in trading comes always with a degree of risk, therefore as professional risk managers it remains vital that we stick to our risk management plan as well as our trading strategies.
📈The rest, we leave to the balance of probabilities.
💡Fail to plan. Plan to fail.
🏆It has always been that simple.
❤️Good luck with your trading journey, I shall see you at the very top.
🎯Trade consistent, FRGNT X

Market Analysis: USD/CHF – 4H ChartThe USD/CHF pair is exhibiting a **clear bearish trend** on the 4-hour chart, with price currently consolidating around the **0.81500** level after a sharp decline. This consolidation is forming a **range-bound structure**, with support near the recent H4 low and resistance around the **0.82500** zone.
Key Observations:
Bearish momentum remains dominant, evidenced by lower highs and lower lows.
Price is currently trading just above a well-tested H4 support level.
There are two probable outcomes from this consolidation zone:
Potential Scenarios:
1. Bullish Breakout:
A rejection from the H4 support could see price push back towards the **0.82500** level.
A breakout beyond this resistance could lead to further recovery towards **0.83500** or higher.
2. **Bearish Continuation**:
A break below the H4 support zone would confirm further downside momentum.
This could lead price towards the next key support around **0.80000**, with potential extension to the **0.78500** region.
Conclusion:
USD/CHF is currently at a decision point within a broader bearish structure. Traders should watch for a breakout from the current range to confirm the next directional move, with **0.82500** and **0.80000** acting as critical inflection zones.

USDCHF – breakout (down), retest and bearish continuation The area between 0.8410 and 0.8330 has been a solid support but recently, price broke (to the downside). Now, price has been pulling back for a re-test and I believe that next week we may see a bearish continuation. Price will also come closer to the 20ema that I rely on as a guide to the mean.
I will be watching this area on a lower time frame, looking for bearish price action to go short. If bearish price action does resume, we are likely to see the round number 0.8000 be achieved.
This is not a trade recommendation; it’s merely my own analysis. Trading carries a high level of risk, so only trade with money you can afford to lose and carefully manage your capital and risk. If you like my idea, please give a “boost” and follow me to get even more. Please comment and share your thoughts too!!
It’s not whether you are right or wrong, but how much money you make when you are right and how much you lose when you are wrong – George Soros

USDCHF I Intraday Long Opportunity from Support Welcome back! Let me know your thoughts in the comments!
** USDCHF Analysis - Listen to video!
We recommend that you keep this pair on your watchlist and enter when the entry criteria of your strategy is met.
Please support this idea with a LIKE and COMMENT if you find it useful and Click "Follow" on our profile if you'd like these trade ideas delivered straight to your email in the future.
Thanks for your continued support!Welcome back! Let me know your thoughts in the comments!

USDCHF possible bullish reversal for 08470 & 0.8530#usdchf weekly bar is a key reversal bar, made a new low, closed towards high. market liquidity sweep below the previous double bottom. weekly key reversal bar is an early indication for bullish reversal. trend is quite bearish. better to wait for correction i.e. 61.8fib level, 70.0fib level and 79.0fib level as well. stop loss below the key reversal bar. Initial take profit level is 0.8470, next one is 0.8525-30.

USDCHF LONG FORECAST Q2 W17 D25 Y25USDCHF LONG FORECAST Q2 W17 D25 Y25
Professional Risk Managers👋
Welcome back to another FRGNT chart update📈
Diving into some Forex setups using predominantly higher time frame order blocks alongside confirmation breaks of structure.
Let’s see what price action is telling us today!
💡Trade confluences📝
✅Weekly order block rejection
✅Daily order block rejection
✅15’ order block
✅Intraday bearish breaks of structure
🔑 Remember, to participate in trading comes always with a degree of risk, therefore as professional risk managers it remains vital that we stick to our risk management plan as well as our trading strategies.
📈The rest, we leave to the balance of probabilities.
💡Fail to plan. Plan to fail.
🏆It has always been that simple.
❤️Good luck with your trading journey, I shall see you at the very top.
🎯Trade consistent, FRGNT X
