#USDJPY: 1300+ Pips Swing Buy, Comment Your Views! Dear Traders,
We hope you are trading successfully.
The price has filled the liquidity gap and reversed positively with strong volume emerging. While the USD was extremely bearish, the DXY has begun to show bullish momentum which will directly affect the DXY and the future of the USDJPY.
We have identified two potential targets. The first is a nearby target. If the DXY continues to remain bullish we may see the price reach this target soon. The second target is a swing entry.
We wish you the best of luck and trade safely.
Team Setupsfx
Usdjpyanalysis

USD/JPY – Bearish Flag Breakdown (25.11.2025)📝 Description 📌 Setup Overview FX:USDJPY
USD/JPY has completed a Bearish Flag on the M30 timeframe and price has now broken below the flag support with momentum.
The Ichimoku Cloud is acting as resistance, showing sellers stepping in again after a short pullback.
📉 Bias: Bearish continuation📍 Pattern: Bear Flag (Breakout confirmed)
🎯 Trading Plan
• Entry idea: After a clean breakout & retest confirmation below the flag base zone
• TP1: 156.055 (1st Support)
• TP2: 155.622 (2nd Support)
• SL suggestion: Above 157.000 (invalidates breakdown)
• RR potential: 1:2 — 1:3 depending on entry
🧠 Why this move makes sense
1️⃣ Price rejected Ichimoku cloud + structure resistance
2️⃣ USD weakness continues after recent pullback
3️⃣ JPY demand increases as risk sentiment cools ahead of key macro events
📌 What to expect
If price retests the flag support from below and rejects again, bearish momentum could accelerate toward 156.05 → 155.62.
💬 Your turn
Which target will hit first in your view — TP1 or TP2?
👇 Comment below — I reply to all comments.
🔖 SAVE this post so you don’t miss the trade update.
👍 LIKE if you want more Bear Flag & Triangle setups.
⚠ Disclaimer: For educational purposes only. Not financial advice. Trade based on your plan & risk management.
#USDJPY #forex #bearflag #priceaction #tradingview #technicalanalysis #chartanalysis #forexanalysis #ickycloud #supportandresistance #forextrading #marketstructure #smartmoney

USDJPY setting for a drop daily support!💹 Trade Setup USD/JPY
USDJPY has got rejected from weekly resistance with multiple liquidty sweep.
With potential Fed rate cut in December has weaken DXY which eventually pushing USD/JPY bearish. Besides USD weakness JPY indext also approaching a montly support level which could bring a at least short term pullback of JPY index to the upside.
📈Trading Idea :
Look for bearish setup on a false breakout above 156.35 or above and potential rejection back below can trigger a sell signal.
✈️Targets
1st support 154.93
2nd support 153.705
🔴Stop level above 157.22
follow for more ideas and trade setups!

USDCHF – 1H Bullish Channel Breakout SetupUSDCHF is moving cleanly inside a bullish ascending channel on the 1-hour timeframe.
Currently, the price is consolidating near the resistance zone, creating a potential breakout scenario.
If price breaks above the highlighted resistance box, a strong bullish continuation toward the upper channel boundary is expected.
📌 Key Points:
Market structure: Bullish
Pattern: Ascending Channel
Zone: Breakout required above resistance
Confirmation: Candle close above the box
Expectation: Upside move toward next channel resistance
Wait for a clear breakout before entering.

USDJPY – Bullish Channel Retest Suggests Strong Upside ContinuatUSDJPY is currently respecting its ascending bullish channel on the 4H timeframe. Price has retraced back into the channel support zone, where buyers are beginning to step in again.
As long as price holds above the channel support, the structure favors bullish continuation, with the market maintaining a clear series of higher highs and higher lows.
A strong bounce from this zone could lead to the next impulsive move toward new highs.
Market Bias: Bullish
Key Level: Channel Support
Expectation: Continuation to the upside as shown by the arrow
This chart illustrates a potential re-entry area for buyers in line with the prevailing uptrend.

USDJPY - Signal#USDJPY - Signal
H4 - Formation of the 3rd wave + breakout of the trend line. Stop behind the high of the 1st wave.
Entry: 156.590
TP: 155.169 - 154.103 - 152.759 - 151.405
Stop: 157.990

USD/JPY) berash trend analysis Read The captionSMC Trading point update
Technical analysis of USD/JPY H1 chart:
---
Overall Bias: Bearish
The chart shows a continuation bearish setup after a corrective structure inside supply, followed by a trendline break and rejection from FVG + supply zone.
---
Key Technical Points
Price tapped into the FVG / Supply zone (157.00–157.25) and rejected strongly
→ Sellers confirmed
Rising corrective channel (bearish correction pattern)
→ Breakout already visible (trendline break noted on chart)
Price below EMA 50 and approaching EMA 200
→ Momentum shifting bearish
Market structure
Lower highs forming
Strong rejection wick confirming distribution
Bearish BOS expected after correction completes
---
Target Zone
155.90 – 156.00 Key demand zone & imbalance fill area (Aligned near EMA 200 providing confluence)
---
Trade Idea Approach
Entry idea: Look for retest of broken trendline or lower timeframe supply inside current zone
Target:
155.90 – 156.00
Invalidation / SL:
Break & close above 157.25
---
Smart Money Concept Perspective
Institutional distribution in premium pricing
FVG mitigation completed
Liquidity sweep at highs
Expecting displacement to downside
Mr SMC Trading point
---
Summary
The structure favors selling continuation as long as price stays below the supply & FVG rejection zone. The target of 155.90 is reasonable for the next move.
---
Please support boost 🚀 this analysis

USDJPY - Perfect time to buy.USDJPY Is in a clear uptrend and has been for a while! It is currently inside an upward channel and has recently broken the last major resistance zone which means it is extremely likely to keep heading to the upside for much longer (just a very minor resistance level which is causing slight delays for its bullish movements). The next target will be the fibonacci extension zone which is shown on the chart. USDJPY has struggled to break below support but has constantly been breaking through resistance levels. TIME TO BUY.

USDJPY Correction Ahead!
HI,Traders !
#USDJPY will soon make
A retest of the rising support
Line and as we are bullish
Biased we will be expecting
A local bullish correction
!
Comment and subscribe to help us grow !

I'm still bullish on the Dollar Yenif it's possible for you to refine price in the lower time frame to reduce risk, be my guest and please share with me down in the comments, it will be highly appreciated.

USD/JPY) Bearish trend analysis Read The captionSMC Trading point update
Technical analysis of summary of the chart you shared (USD/JPY H1):
---
Overall Bias: Bearish
The chart suggests a bearish continuation setup after a sharp impulsive drop and current corrective structure.
---
Key Points in the Chart
Price currently trading below EMA 50 (blue) and EMA 200 (black)
→ Indicates shifting momentum to the downside.
Two Supply Zones / FVG Areas Highlighted
First zone around 156.80–157.00
Second zone around 156.40–156.60
Price recently mitigated the lower supply zone and rejected again, showing sellers active.
Market Structure
Lower highs & lower lows forming.
Bearish correction structure drawn (zigzag) pointing continuation lower.
Target Zone
The bearish target is marked around 154.900–155.000, a strong demand zone and liquidity pool.
Likely liquidity sweep below previous lows.
---
Trade Idea Concept
Possible Entry:
Look for short entries after bearish confirmation inside one of the supply zones if price retraces.
TP Target:
154.90 – 155.00 demand zone (major target)
Invalidation:
Break & close above 157.00 invalidates bearish bias.
Mr SMC Trading point
---
Smart Money Concept View
Trend transitioned after BOS
Fair Value Gap + Supply + EMAs as confluence
Targeting imbalance fill & liquidity
---
Summary
The chart shows a strong probability for continued downside, aiming to fill imbalance down to 155.00 region after a corrective pullback.
---
please support boost 🚀 this analysis

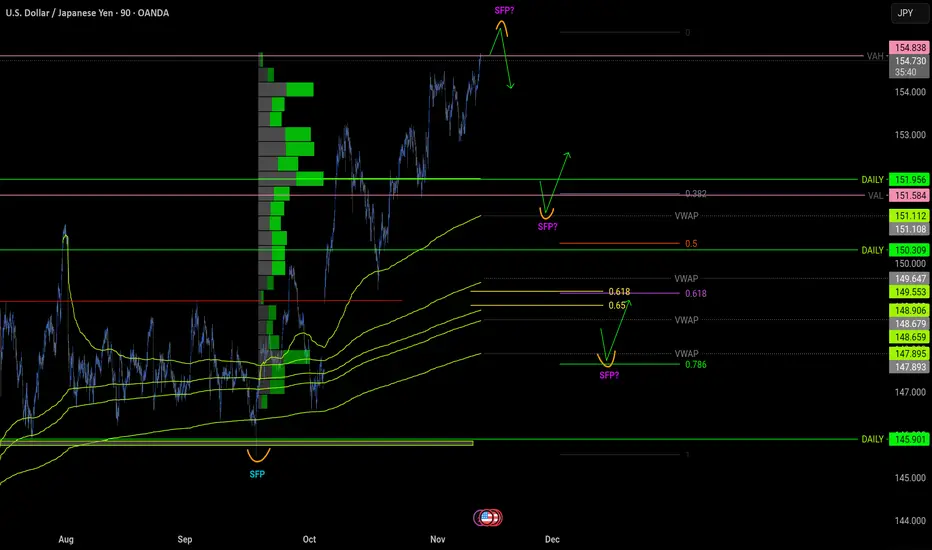
USDJPY idea 12.11.2025I'm primarily following two scenarios in this market: a short position would be possible when the SFP is above the value high. I would like the nearest long when the price drops somewhere around 151.2, where there is a nice confluence. The 0.382 fibo value low level and the daily level are converging. I would like another potential long only after the gap is filled.
USD/JPY break of risising channel, what is next?💹 Trade Setup USD/JPY
USD/JPY has broken out of the rising channel with continued series of higher low and currently retesting the preivous resistance turns support.
Fiscal concerns and BOJ rates are still just 0.5% has weaken futher the JPY while positive data on NFP has boosted USD making USD/JPY a stonger currency pairs among all USD pairs.
with rate cut news from Fed on Friday market rebounded and a daily rejection has seen which currently sitting at the top of the channel at 156.192 and possible falsebrak below and rejection can indicate futher rise to 1st resitance at 158.921
📈Trading Idea :
Look for bullish setup after false breakout of daily support at channel resistance 156.192 and rejection above
✈️Targets
1st Resistance 158.921
2nd Resistance: 161.960
🔴Stop level
at or below 154.802 as the previous swing low
Follow for more ideas and update on this pair and other pairs !

USDJPY 4H Buy Setup with Levels!Hello Everyone,
Let's see how this pair will perform based on the analysis.
Based on my analysis I'm sharing my view.
Make sure you do your research, and based on your confluence, please look for the entry.
Don't rush your trades without any confirmation.
Use proper risk management always and trade safe.
Thank You All in advance for checking my trade idea for your Likes, Comments & Follows, Highly Appreciated your support!
Get the updated ideas.
FOLLOW | LIKE | COMMENT | SHARE
If this analysis helps you plan better 📈

USD/JPY Rises Above 157.00 for the First Time Since JanuaryUSD/JPY Rises Above 157.00 for the First Time Since January
According to media reports, the Japanese government is in the final stages of preparing an economic stimulus package worth 21.3 trillion yen (USD 135.38 billion) to help households cope with persistent inflation. This could become the largest stimulus since the COVID pandemic.
The Cabinet plans to approve the package on Friday, and the supplementary budget to fund it on 28 November, aiming to secure parliamentary approval before the end of the year.
This decision has led to a significant weakening of the national currency.
Technical Analysis of the USD/JPY Chart
Fluctuations in the Japanese yen against the US dollar are forming an upward channel (shown in blue), and the fundamental backdrop this week has caused the price to:
→ break the QL line from below (and after the breakout, the rise accelerated, indicating imbalance — forming a Fair Value Gap pattern);
→ reach the median.
It is reasonable to assume that around the median, supply and demand may balance each other, stabilising the market. It is also possible that the FVG area will act as support in the event of a correction.
This article represents the opinion of the Companies operating under the FXOpen brand only. It is not to be construed as an offer, solicitation, or recommendation with respect to products and services provided by the Companies operating under the FXOpen brand, nor is it to be considered financial advice.

USDJPY – First Reaction @Daily Supply Zone | Watching 4 WeaknessUSDJPY has finally tapped a major Daily Supply Zone that caused the last significant selloff. Liquidity above previous highs has been taken, and price is now reacting for the first time since this zone formed.
This is a premium area where reversal probability increases, but higher-timeframe supply alone is not enough for execution.
What I’m watching next:
– H1 to show the first clean CHoCH
– Early signs of weakening bullish order flow
– A potential retest into newly-formed LTF supply zones
– M15/M5 refinement for precise entries
If H1 fails to break structure, the bullish continuation remains intact.
We watch the Further SO POINT as well
Confirmation comes from structure — not from the zone alone.

USDJPY and GBPJPY Analysis todayHello traders, this is a complete multiple timeframe analysis of this pair. We see could find significant trading opportunities as per analysis upon price action confirmation we may take this trade. Smash the like button if you find value in this analysis and drop a comment if you have any questions or let me know which pair to cover in my next analysis.

USDJPY Near Major Resistance – Rising Wedge Signals Reversal1. What Happened Recently
After the gap up above resistance in early October, USDJPY has continued to climb, recently breaking above the 155.00 psychological level.
However, the entire advance of the past weeks is developing inside a rising wedge pattern — a structure that usually signals loss of momentum and often precedes a bearish reversal.
2. Current Market Context
It is also important to note that if USDJPY rises above 156.50, it enters a major resistance zone, historically triggering significant pullbacks.
So while the trend is still technically up, the risk-reward for new longs is deteriorating rapidly.
3. Technical Outlook
Key levels to watch:
- 156.50 → strong resistance; break above it creates a fade-the-rally opportunity
- Rising wedge support → a break below confirms a reversal signal
- 158.00 → invalidation; strong buying above this level cancels the bearish scenario
Downside target:
- 150.00 → main objective for a completed wedge breakdown
4. Trading Plan
I am currently preparing two sell plans:
- Break above 156.50 → fade rallies
If price spikes above this zone but fails to hold, I will look to sell.
- Break of the wedge support → trend reversal setup
A clean breakdown from the wedge would confirm that the uptrend is exhausted, offering another shorting opportunity.
5. Conclusion
Although USDJPY remains in an uptrend for now, the combination of a rising wedge, major resistance at 156.50, and weak bullish momentum makes a reversal increasingly probable.
My target is 150, with invalidation only if strong buying appears above 158.

USDJPY Will Keep Growing!
HI,Traders !
#USDJPY is trading in an
Uptrend and the pair broke
The key horizontal level
Of 153.179 so we are
Bullish biased and we
Will be expecting a
Further bullish move up !
Comment and subscribe to help us grow !

USDJPY Edges Higher Above 155Today, USDJPY exhibited a oscillatory upward trend and broke through the key psychological level of 155, achieving a slight rise. However, constrained by the implicit risk of Japanese foreign exchange market intervention, there was no significant one-sided upward movement.
On the upside, core resistance is concentrated at the 155.6 level. After breaking through this position, the next strong resistance zone will be around 156.00, which will exert strong pressure on the exchange rate's upward movement.
Regarding downside support, the primary support lies in the 154.45-154.50 range. As a key range for the exchange rate's fluctuations in the early stage, this level possesses certain supporting strength. If this support is breached, the exchange rate may further decline to 153.50. Should this level also be broken, it may subsequently fall to the deeper support level of 152.10.

USDJPY Vulnerable to Deep Pullback After Wave 5USDJPY has completed a full 5-wave rising structure inside a clear wedge pattern, which usually signals exhaustion. The final Wave (5) shows weakening momentum, and price is beginning to slip below the wedge support — an early sign that the trend may be reversing. This suggests the pair is likely entering a deeper corrective decline, potentially retracing toward 150 or lower in an impulsive A-B-C move. In simple terms: uptrend looks tired → wedge breakdown could trigger a strong downside correction.
Stay tuned!
@Money_Dictators
Thank you :)

USDJPY possibly heading to monthly resistanceHello traders, this is a complete multiple timeframe analysis of this pair. We see could find significant trading opportunities as per analysis upon price action confirmation we may take this trade. Smash the like button if you find value in this analysis and drop a comment if you have any questions or let me know which pair to cover in my next analysis.

USD/JPY Steady UpsideUSDJPY broke through the resistance level of 154.5 last week and is currently in a clear high - range consolidation. In today's trading session:
First, on the 4 - hour chart, the stochastic indicator shows a golden cross with indicator stagnation,and the MACD lines are passivating downward. Overall, the indicators are in a state of indicator stagnation,and in terms of form, it is temporarily in a high - level sideways and anti - falling trend. The current high - level support levels are at 154 and 154.5.
Second, on the daily chart, both the stochastic indicator and the MACD indicator are indicator stagnation. The support levels after a pullback are around 153.6, followed by 153.
To sum up, the short - term support levels for USDJPY today are 154.5, 154, 153.6 and 153. In short - term trading, we should follow the principle of trending with the current trend.
